Description
The presented pipeline solves a classical binary classification problem - Titanic passengers survival prediction. This pipeline demonstrates the applying data processing and machine learning scenario to assess which passengers are more likely to survive the Titanic shipwreck.
Problem Statement
Based on the information about the Titanic's passengers, predict if a particular passenger survived the Titanic shipwreck or not.
Dataset
TitanicModeling scenario
General Schema of the Binary Classification: Titanic can be depicted as a sequence:
- Prepare the initial dataset with target variable (survived) and potentially useful explanatory variables
- Extract features that may be relevant for model training
- Split initial data into train\test sets
- Train the prediction models using the train set
- Evaluate built models on the test set and select the best one for further use
Datrics Pipeline
Pipeline Shema
The full pipeline is presented in the following way:
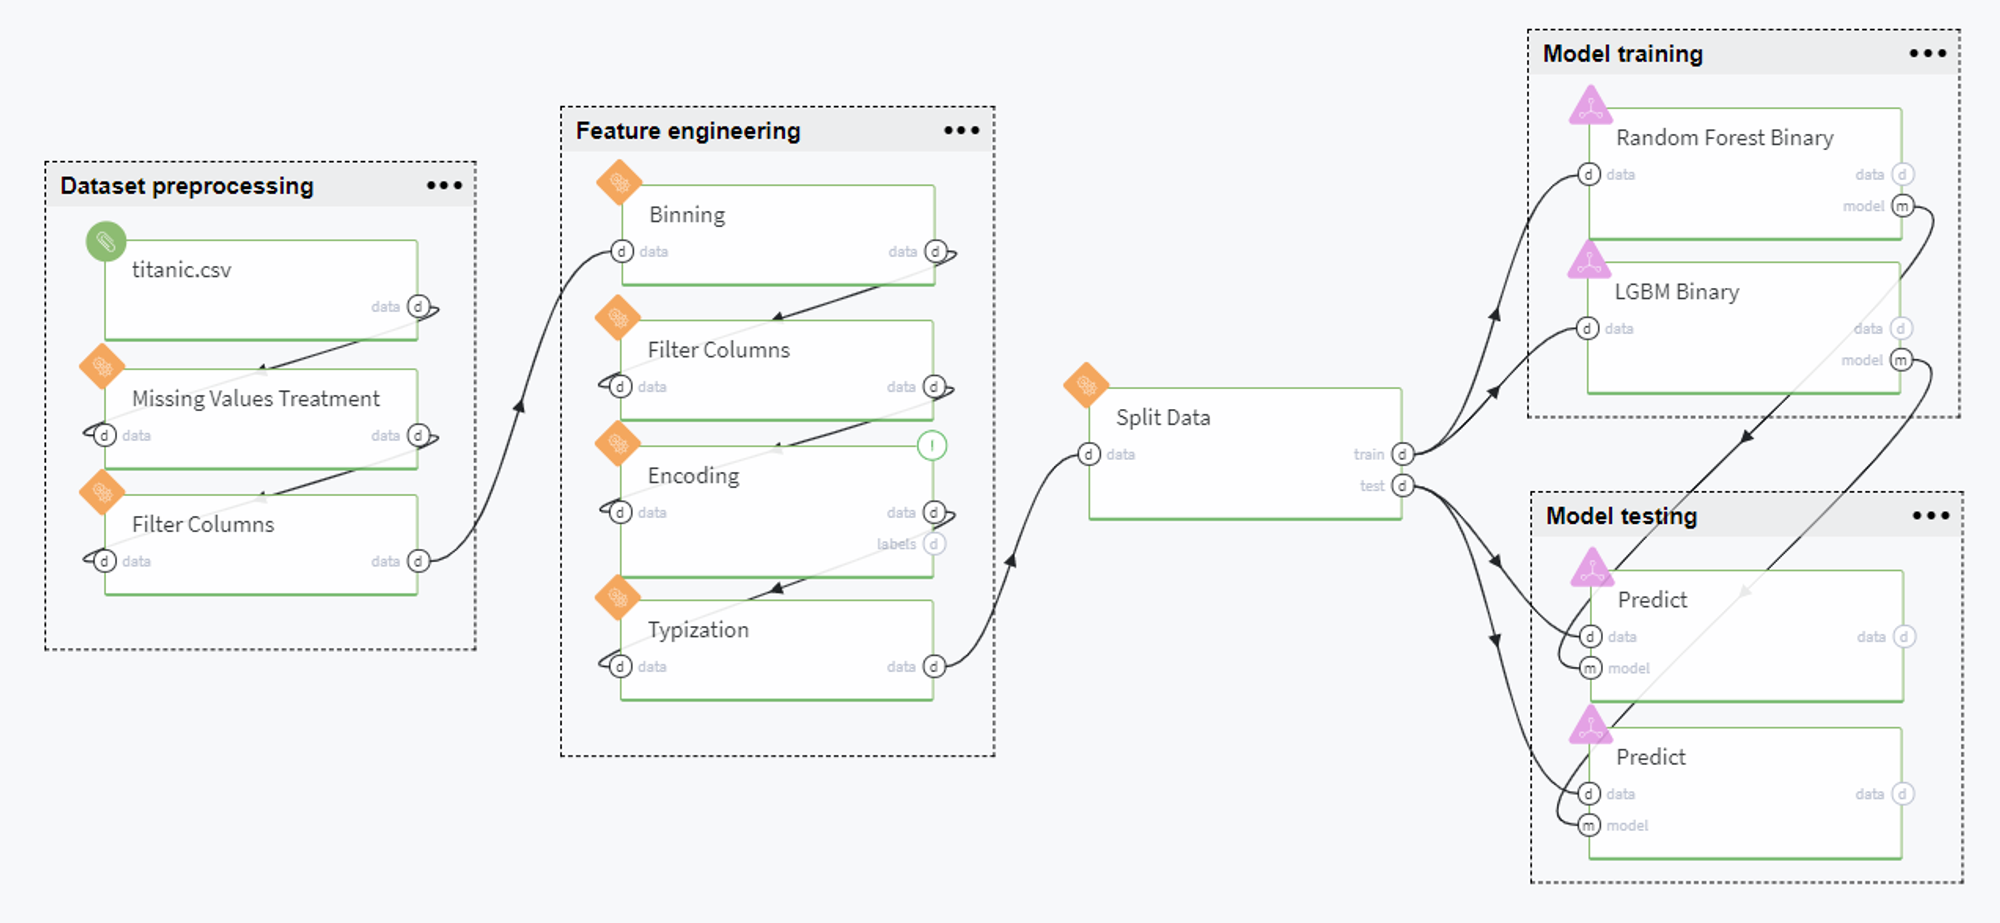
Pipeline Scenario
Overall, the pipeline can be split into the following groups: dataset preprocessing, feature engineering, data splitting, model training and model testing. Let us consider every group in detail below.
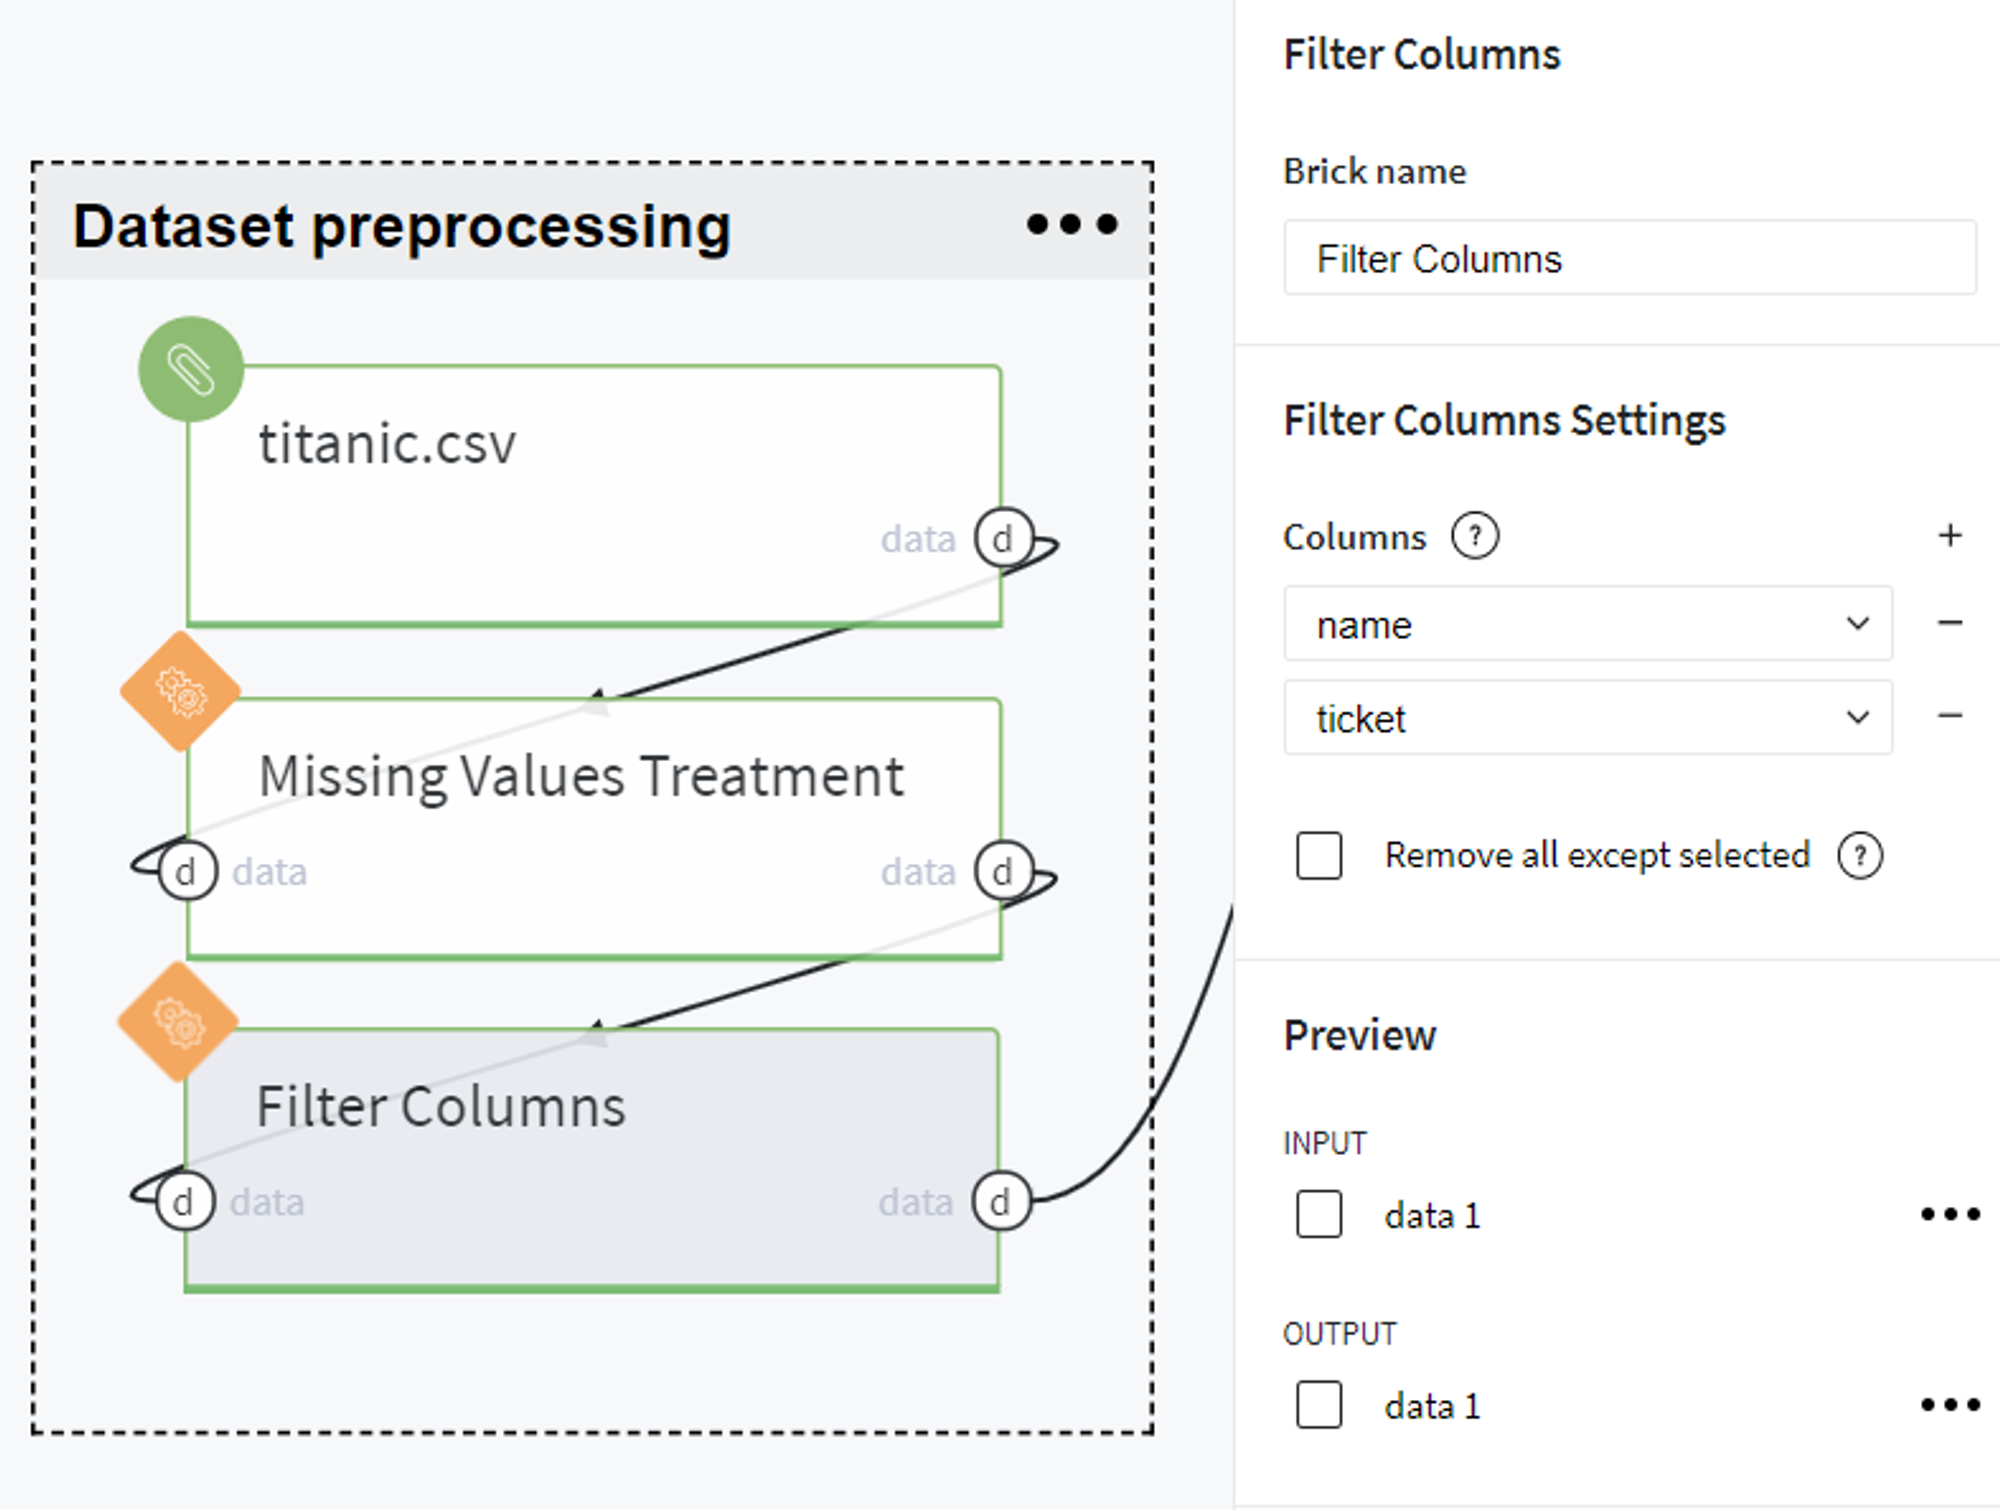
Dataset preprocessing
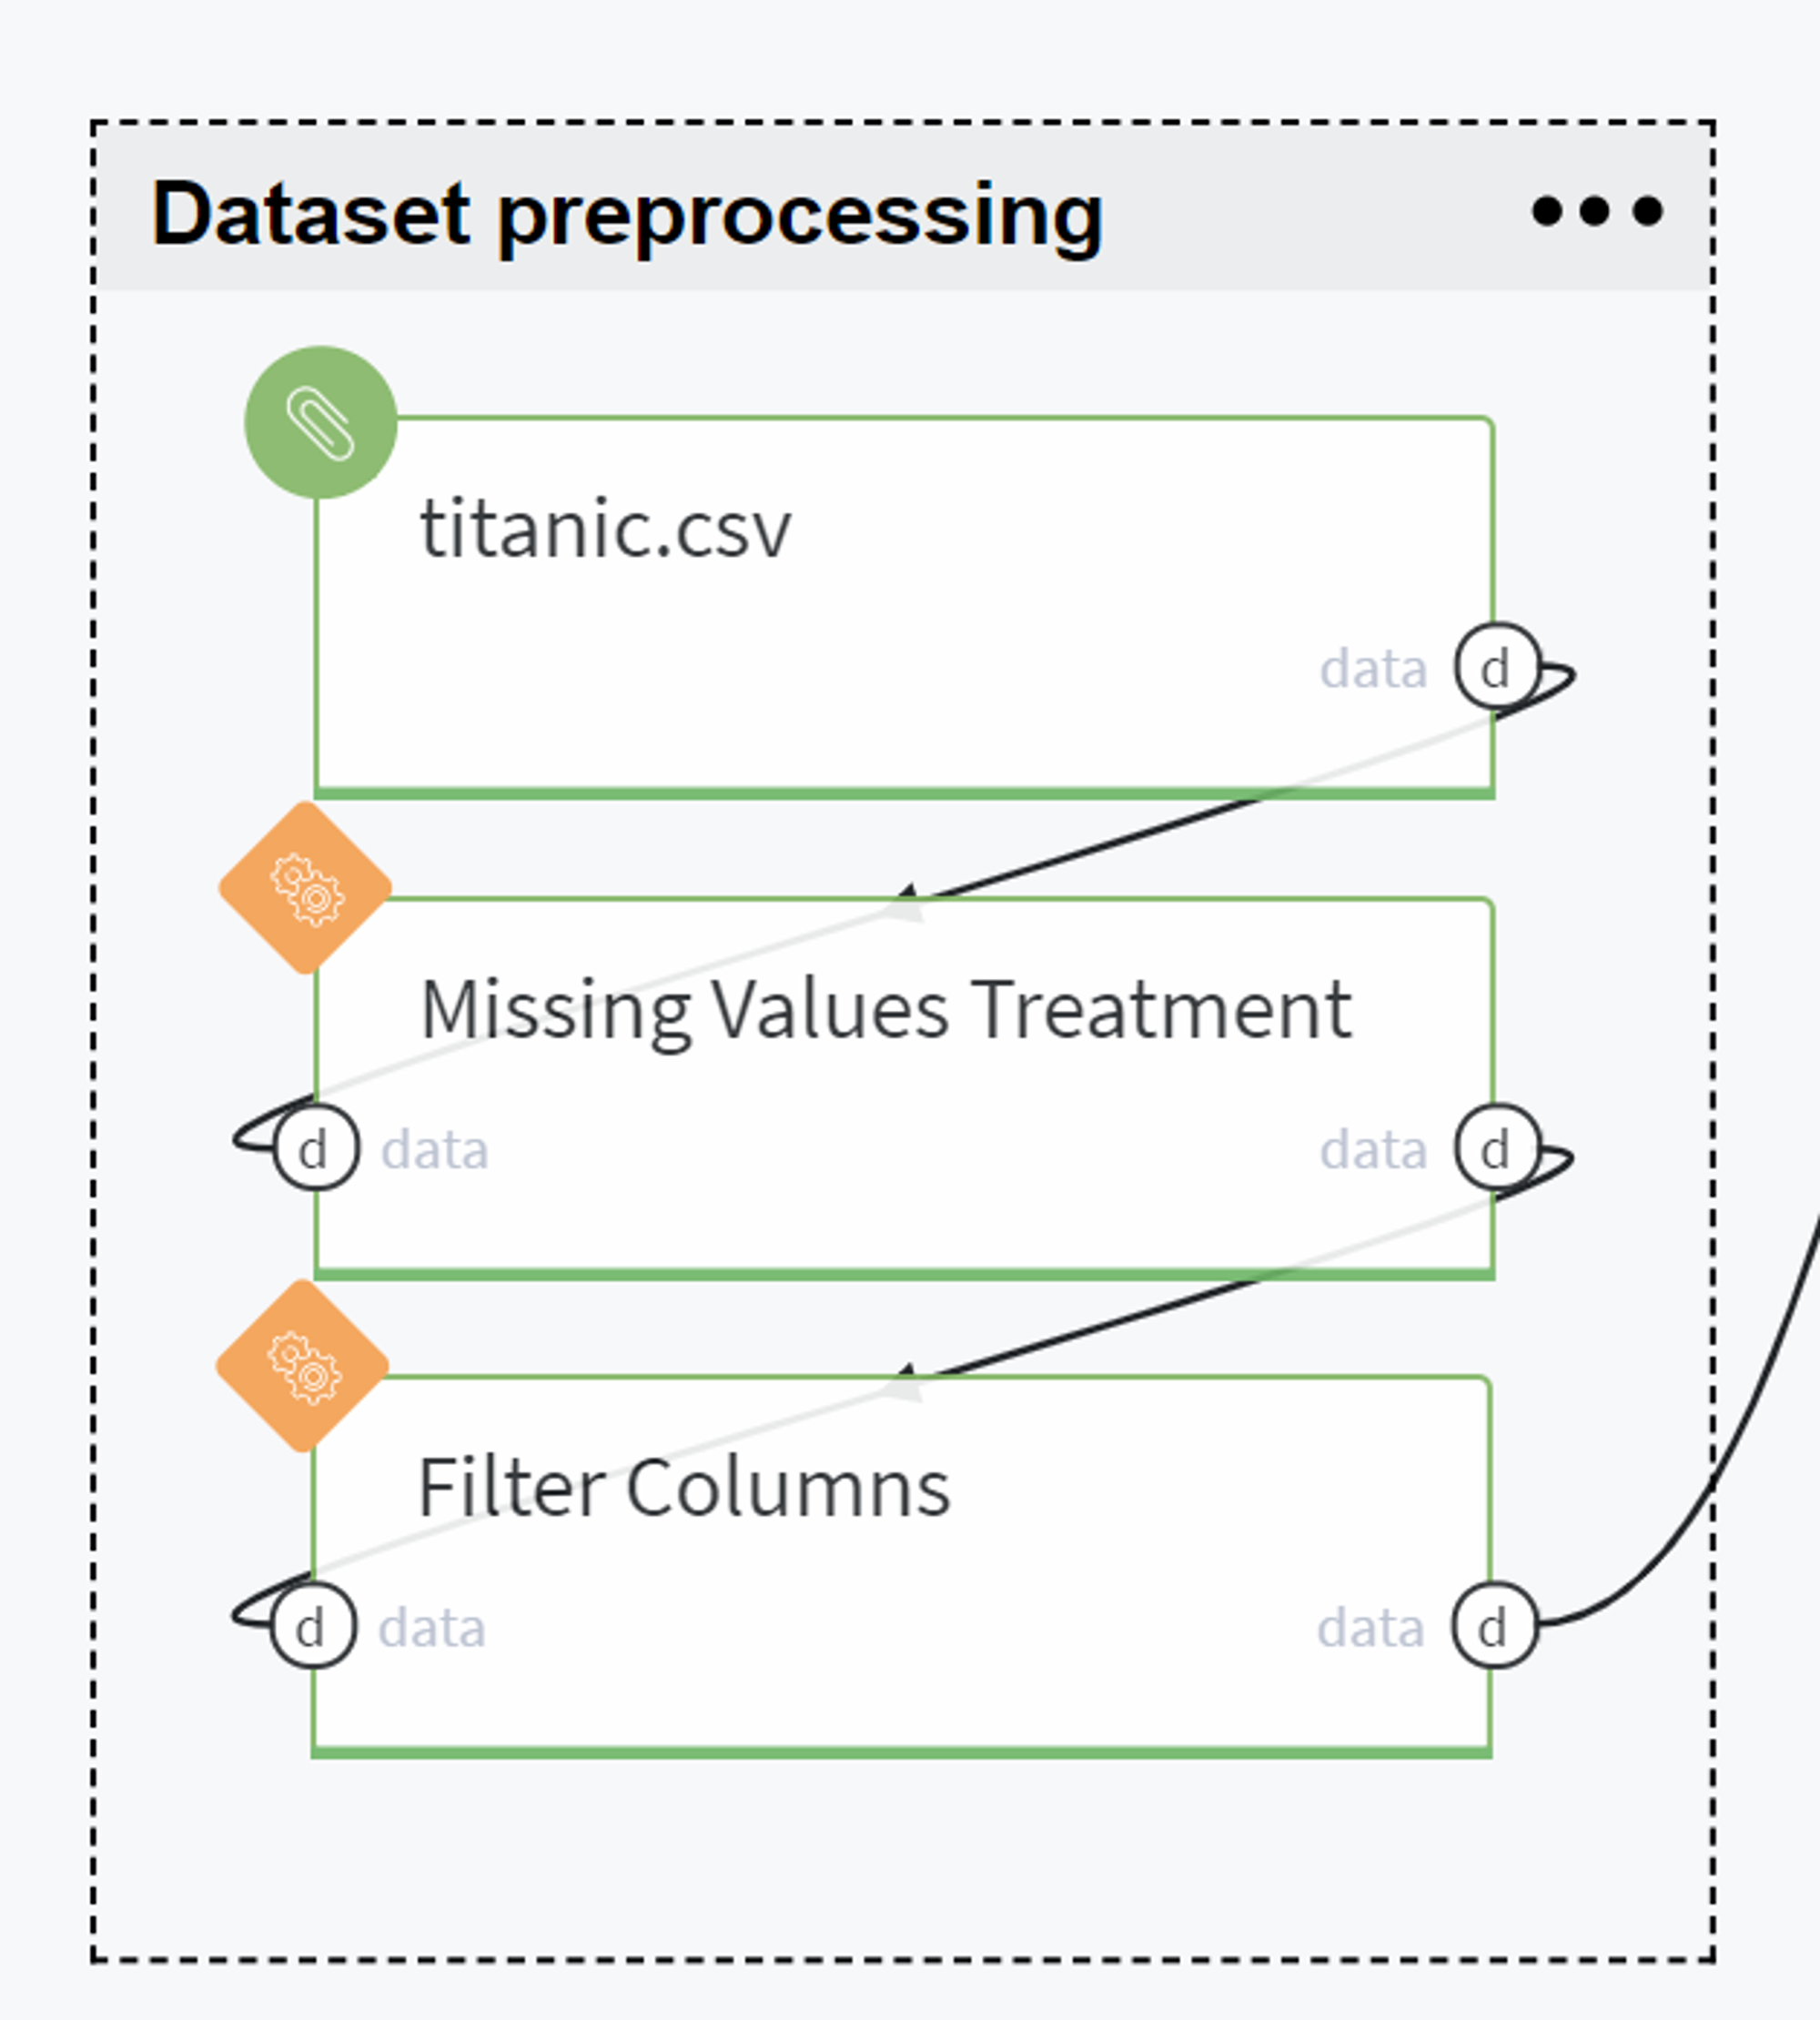
Firstly, we upload the data from Storage → Samples → titanic.csv and verify the number of missing values in the given dataset.
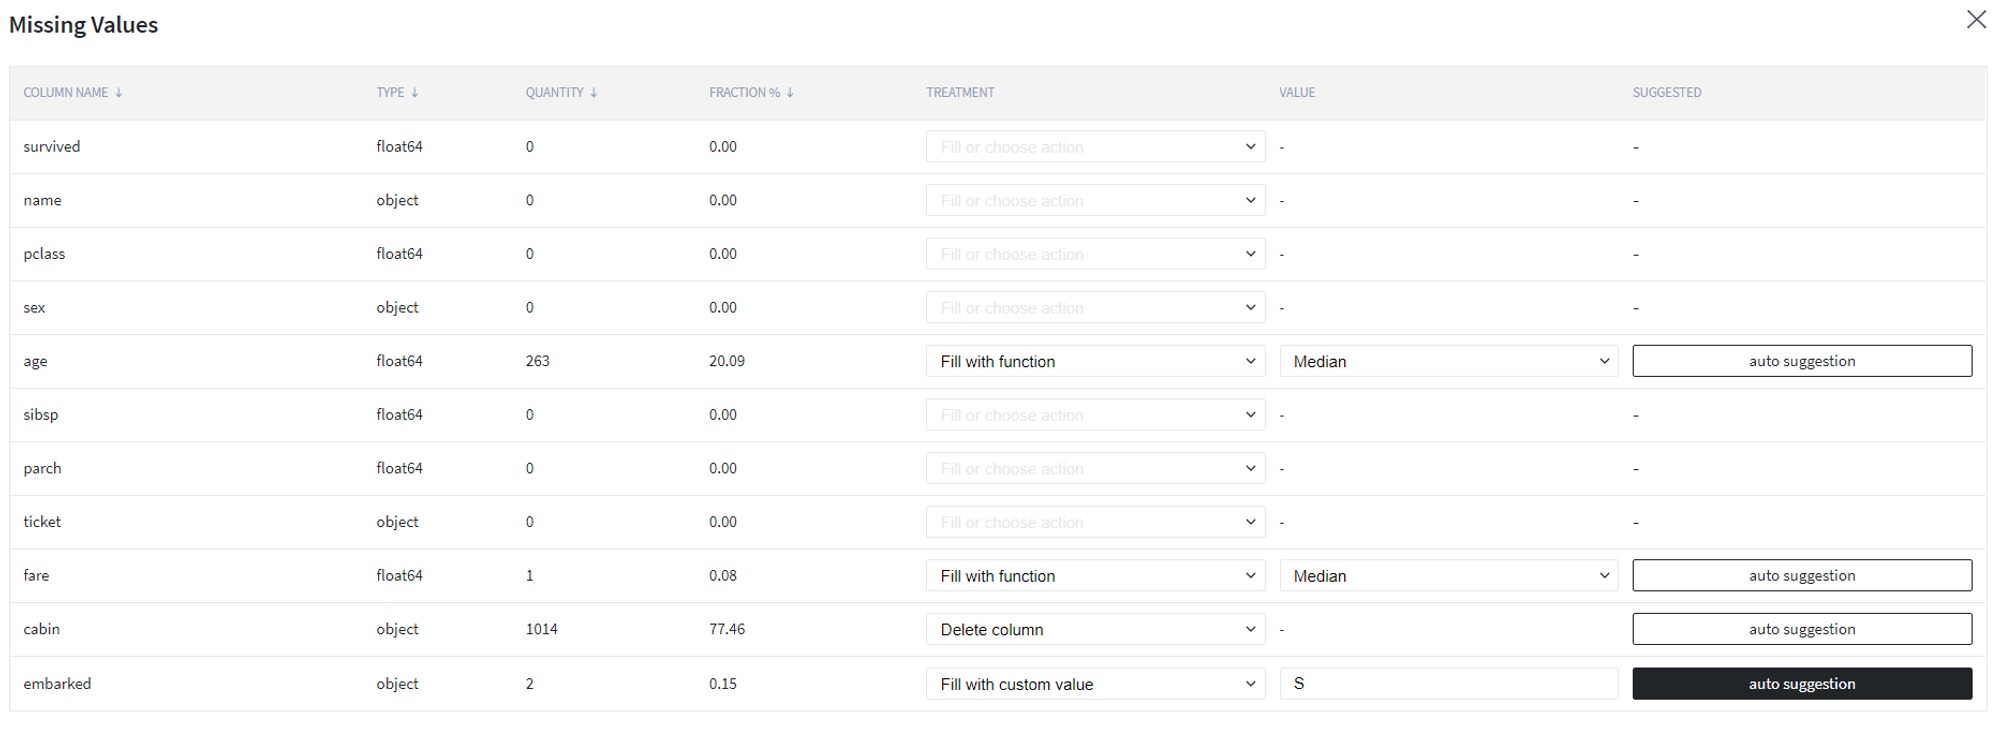
Here we propose to fill the empty values of age and fare columns with the median value calculated on input sampling while deleting the cabin column due to a very high index of missing values. Also, we apply autosuggestion for embarked column and, thus, fill its missing values with the S category.
After that, we filter out other non-informative columns with a very high ratio of unique values, such as passenger name and ticket number, since they identify particular passengers but not their general characteristics.
Feature engineering
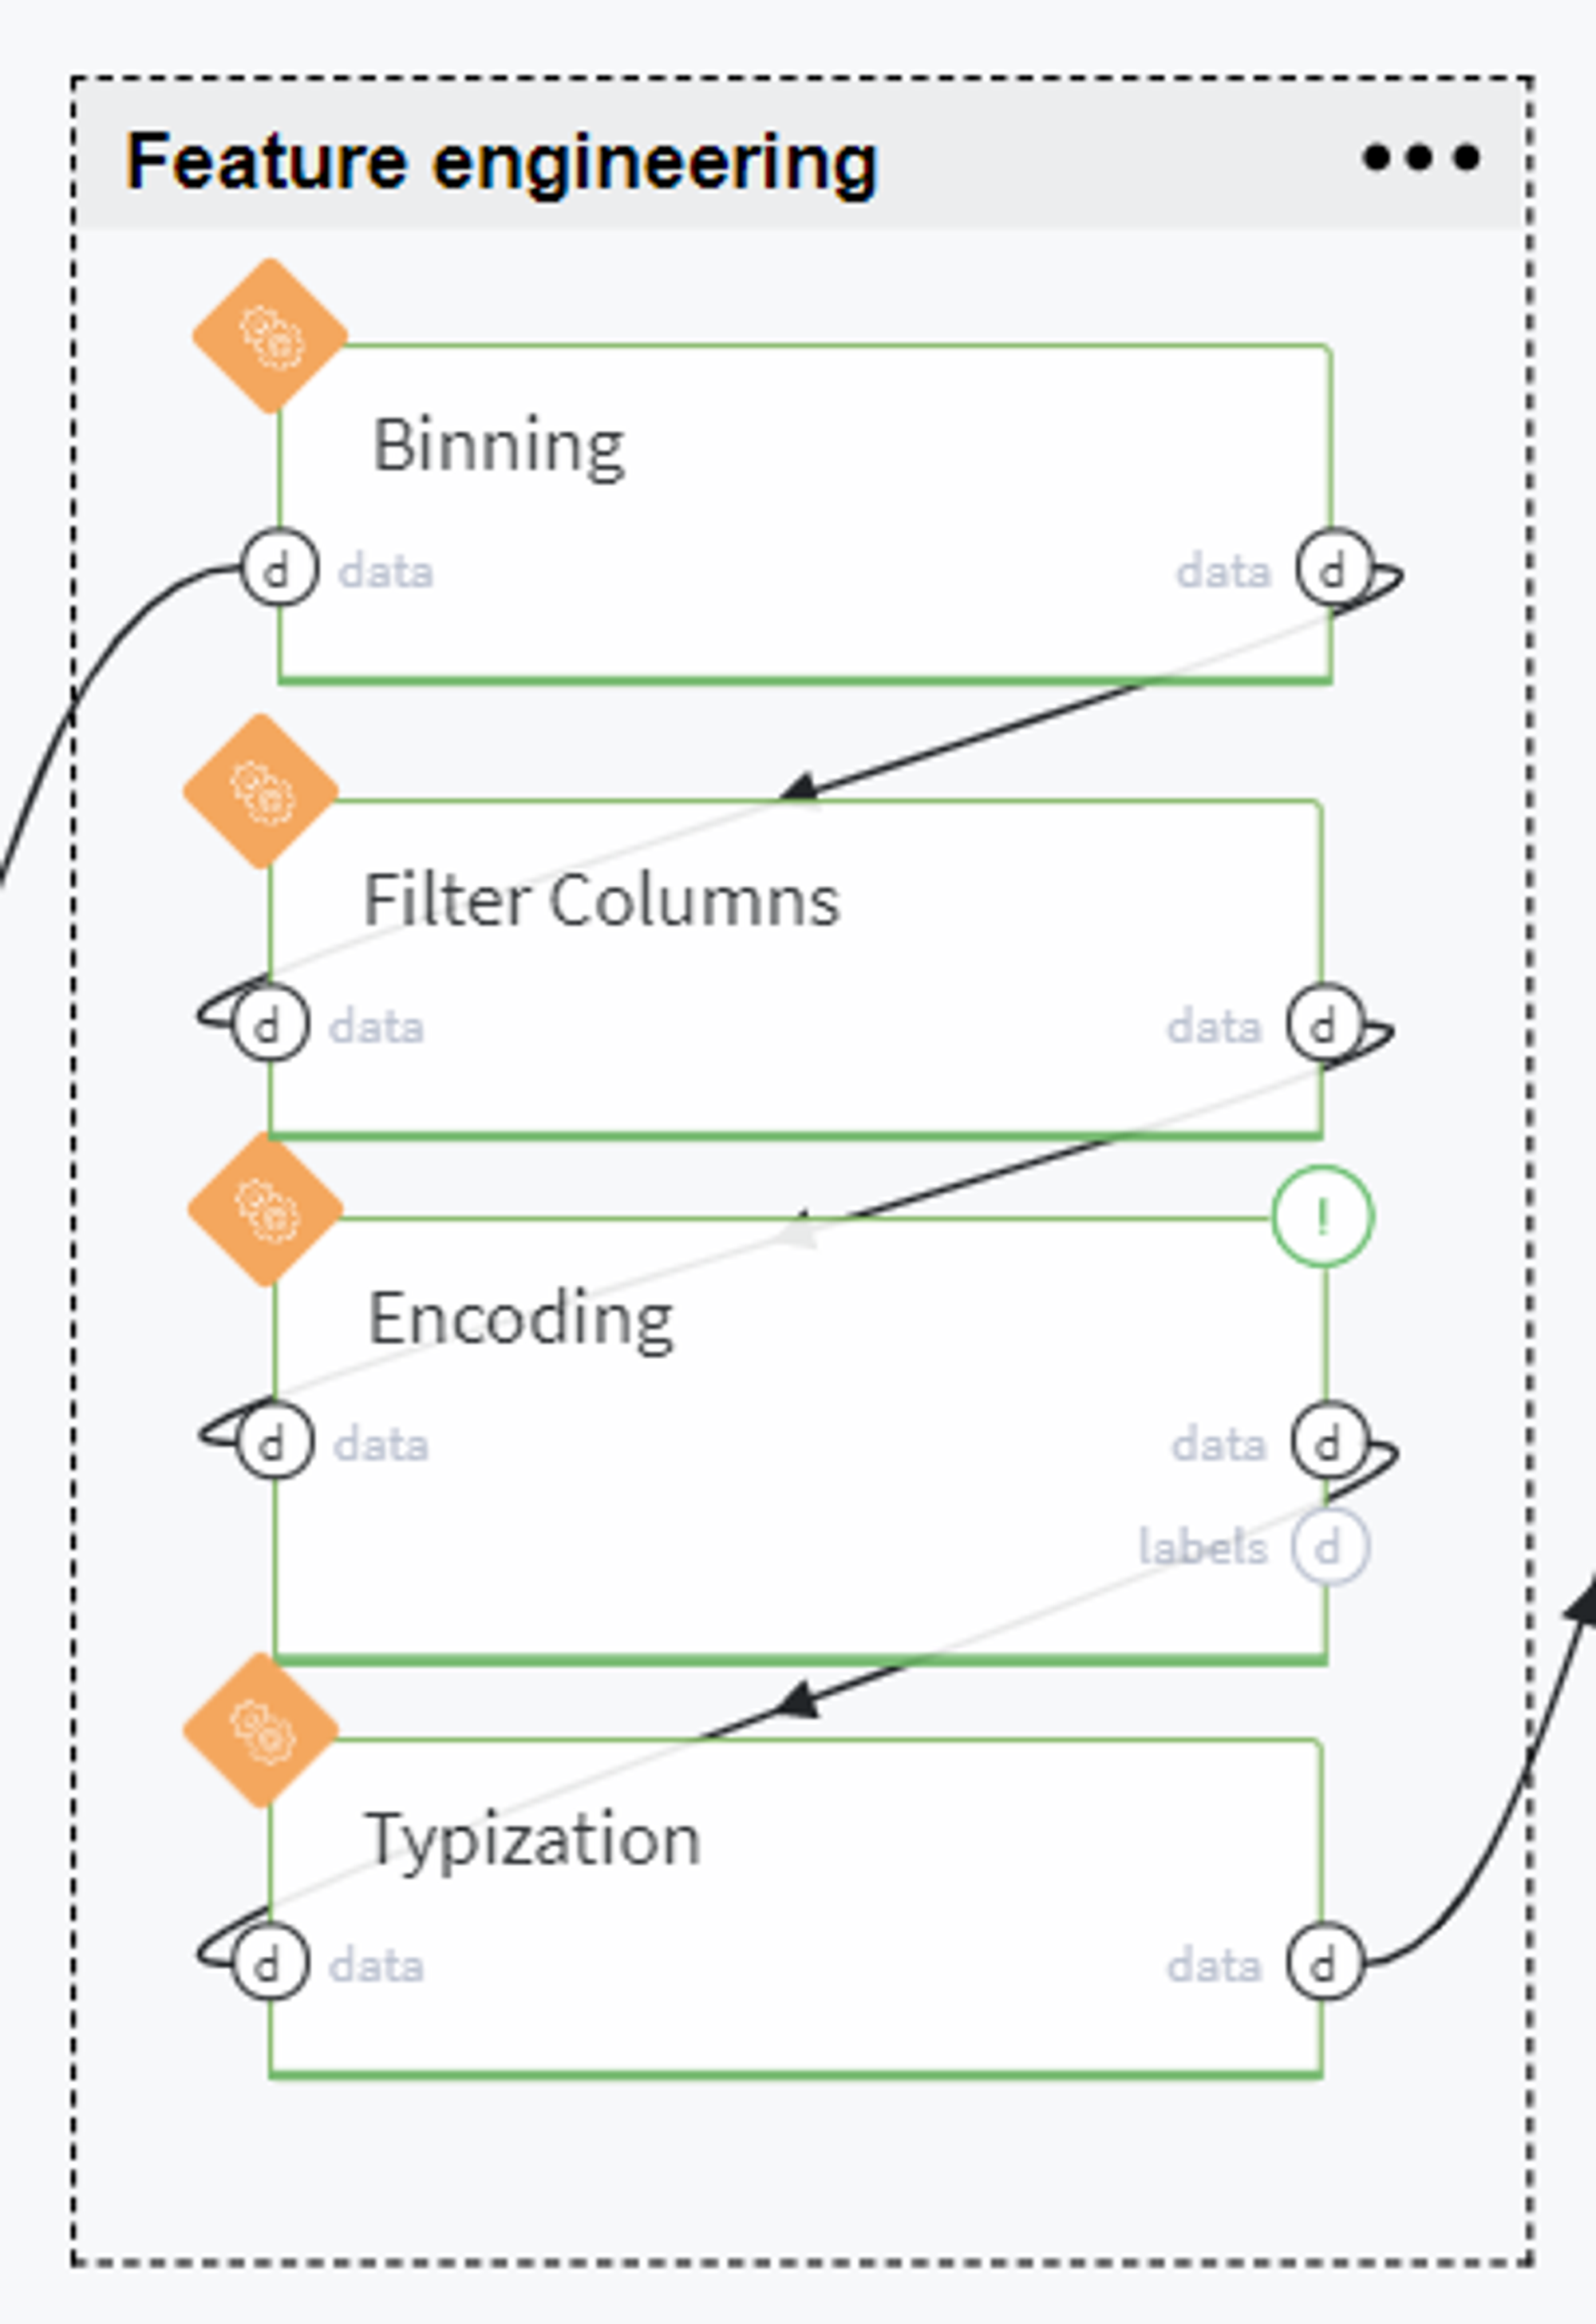
Now we are ready to experiment with feature engineering by encoding the existing variables or deriving new features.
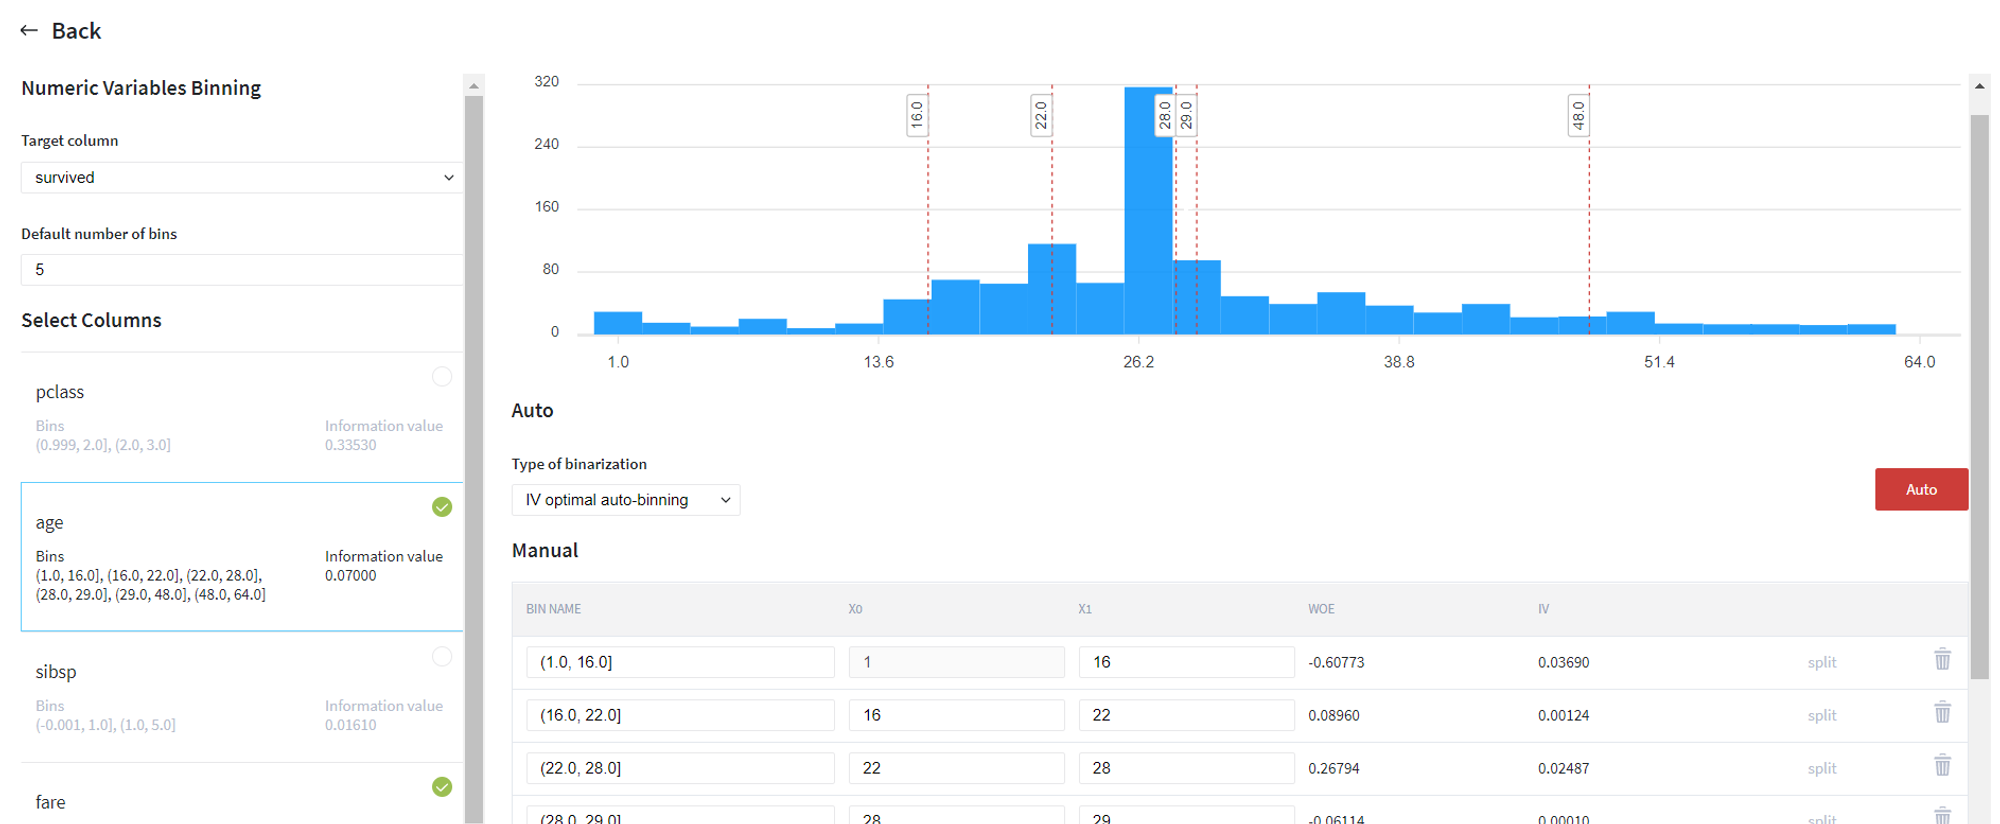
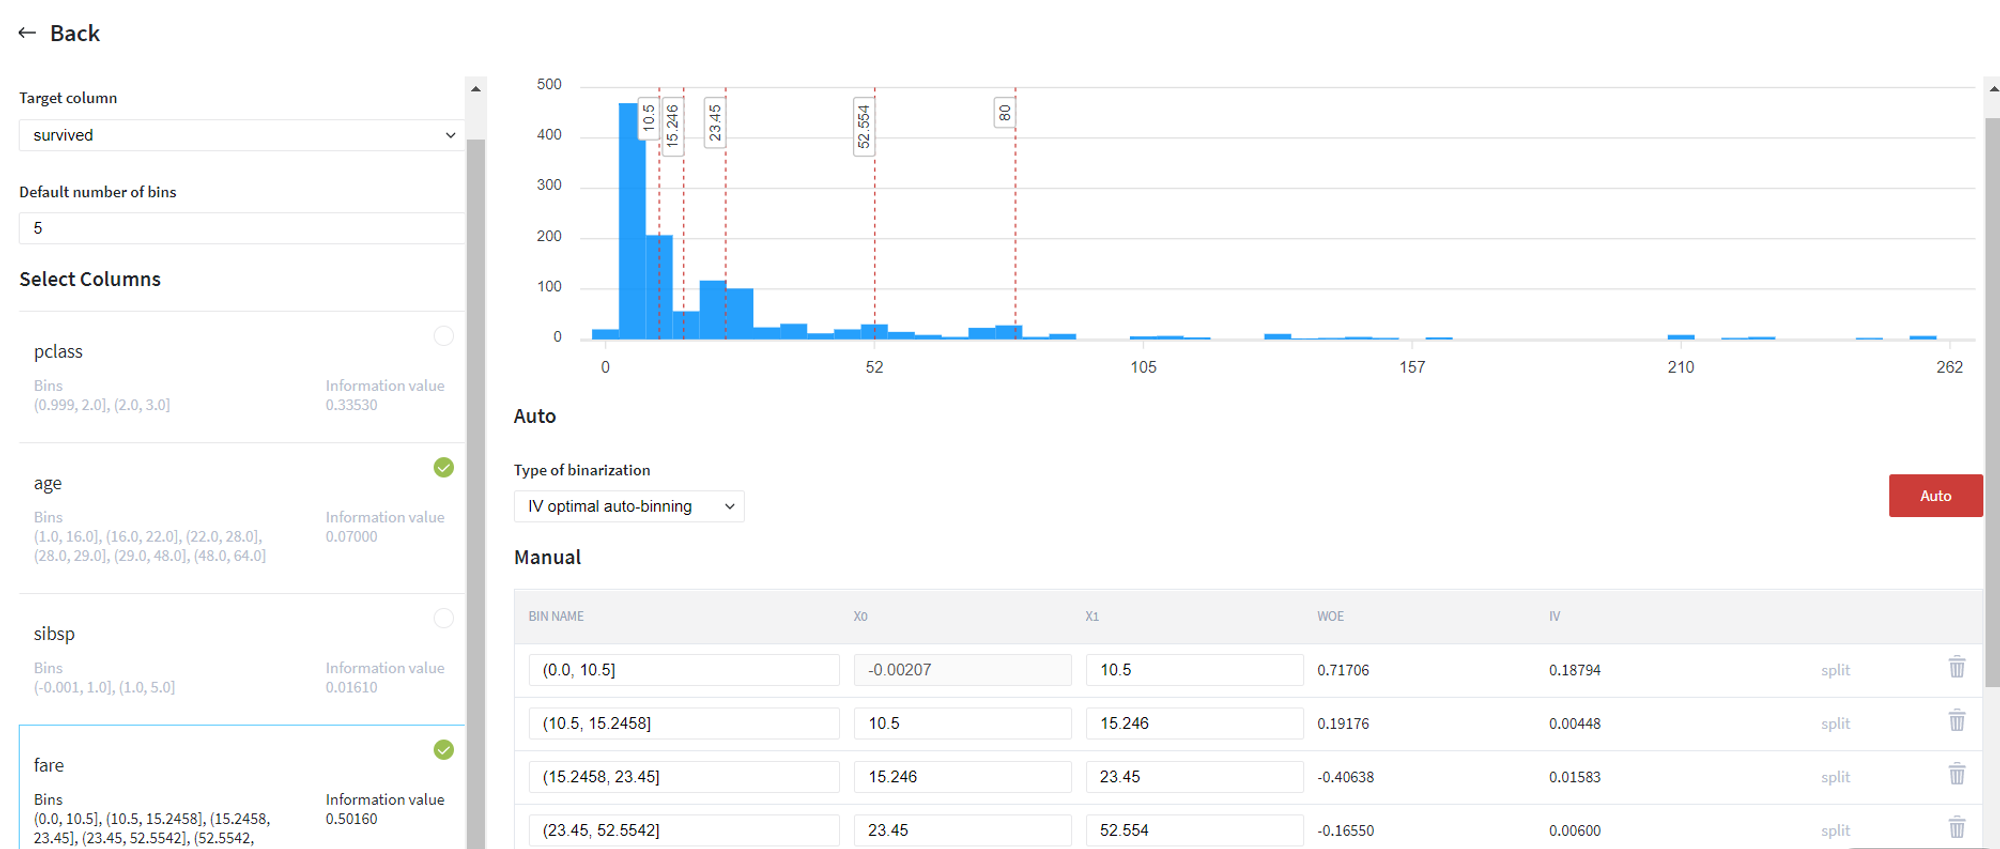
Firstly, we try to transform the continuous variables (age and fare) to categorical by applying IV optimal automatic binning with respect to the target variable (survived):
After that, we received new columns age_bins and fare_bins, so can remove old columns age and fare from the dataset:
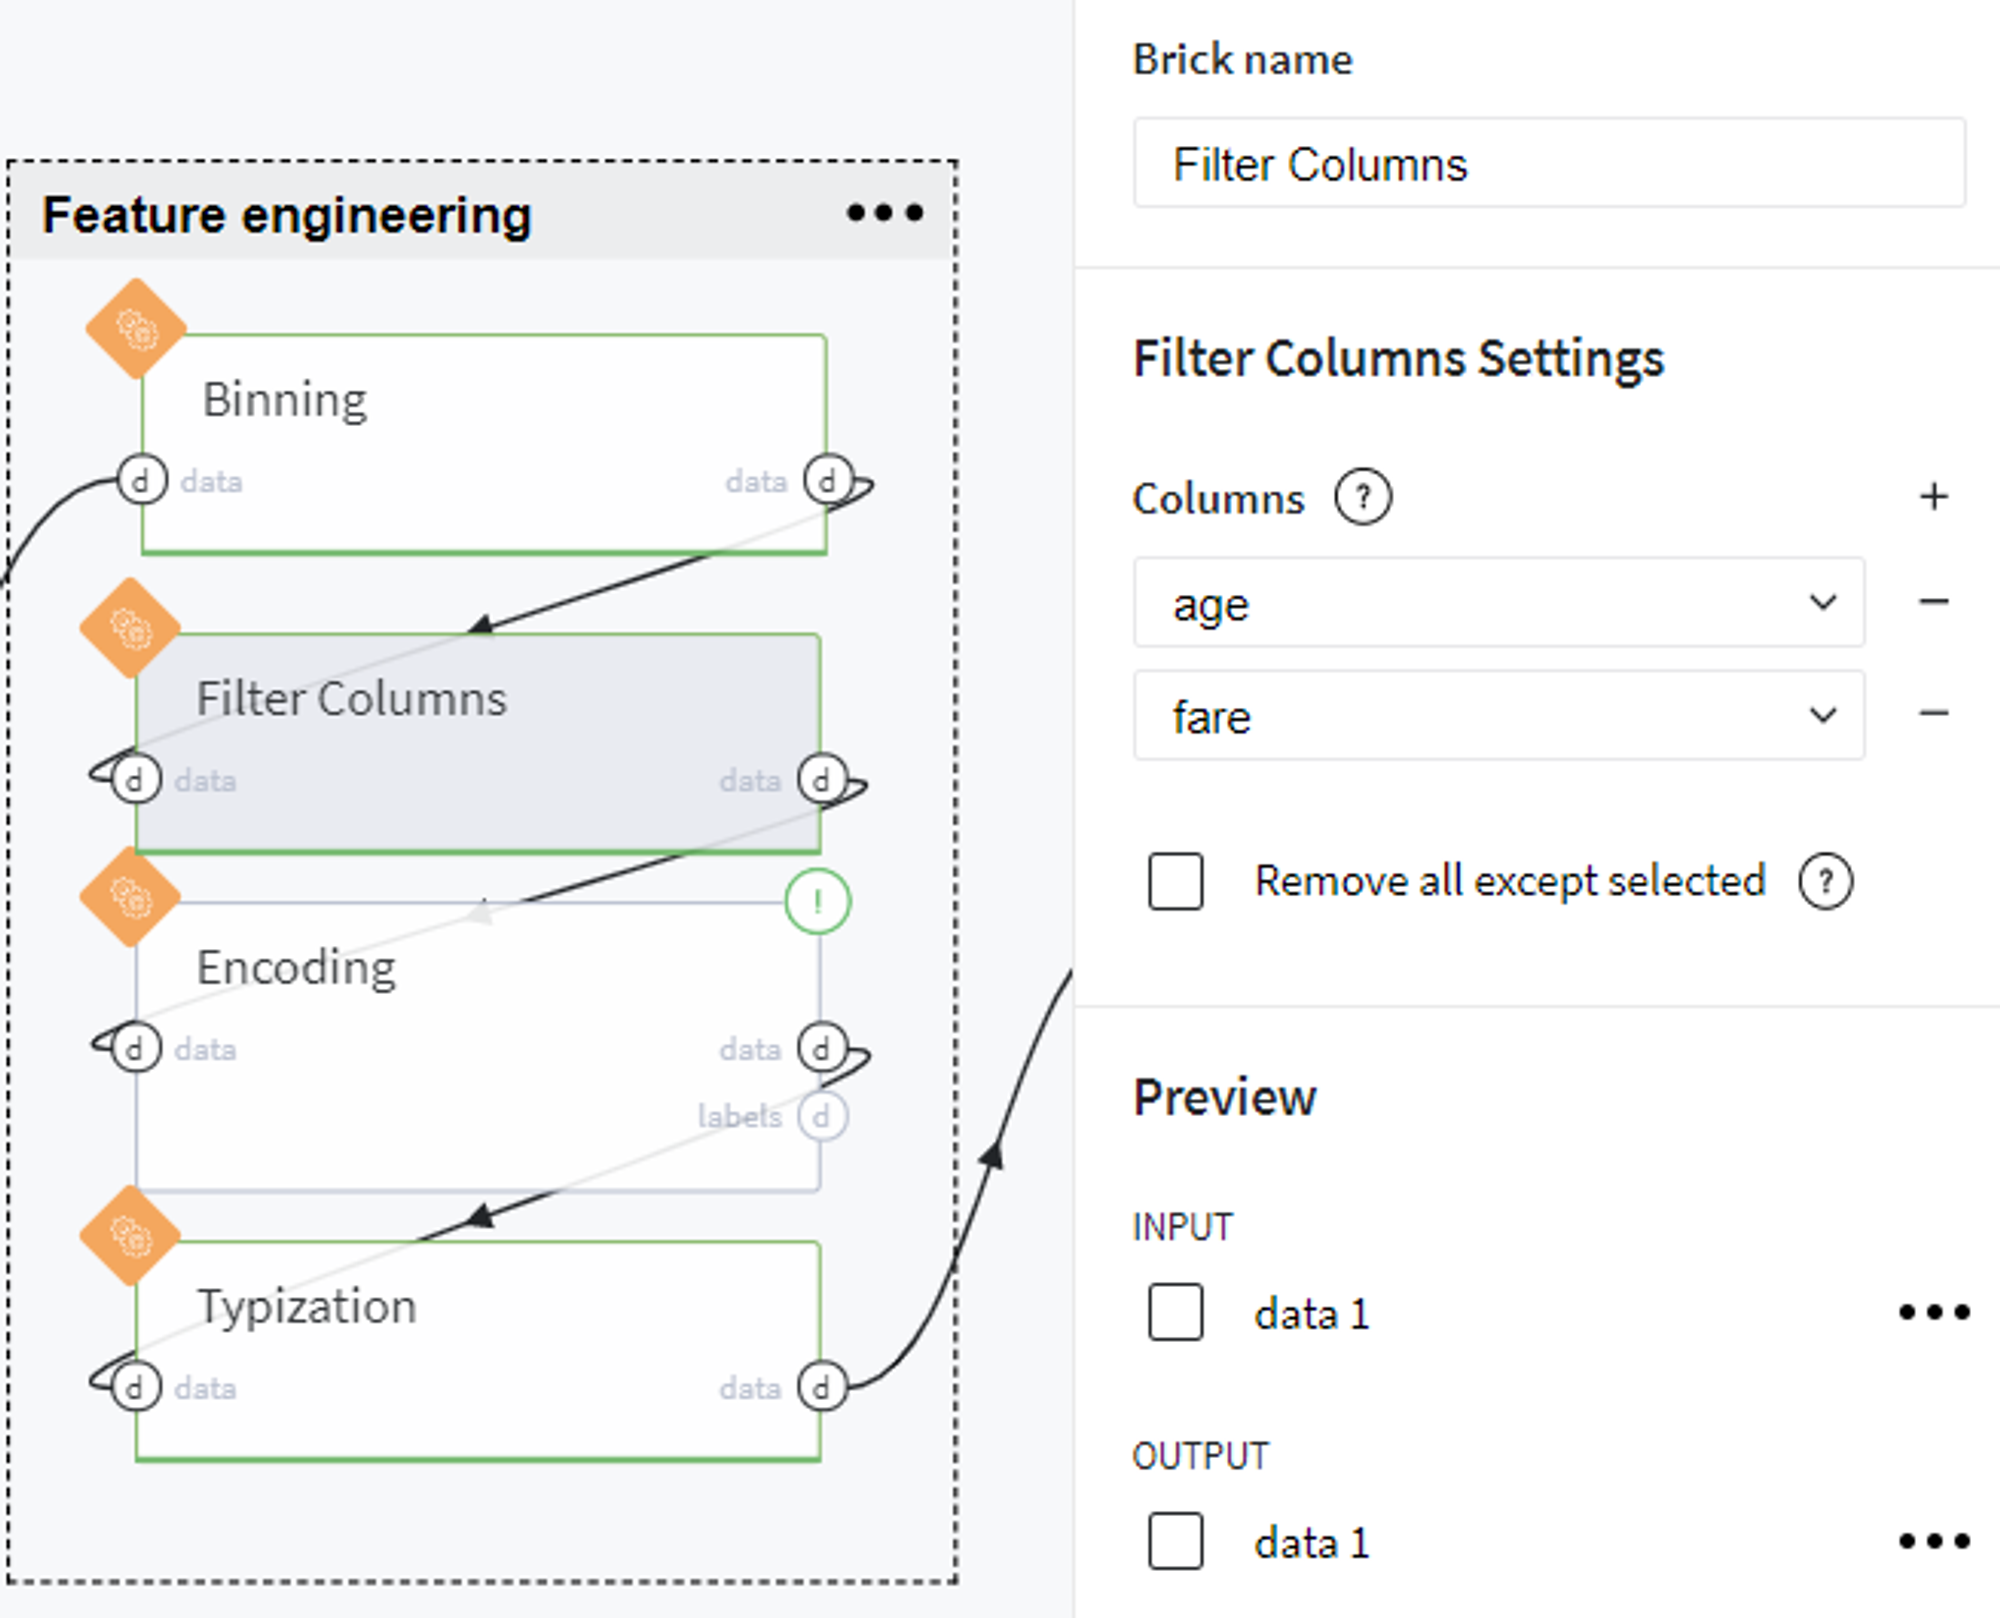
Now we encode some of the columns as follows:
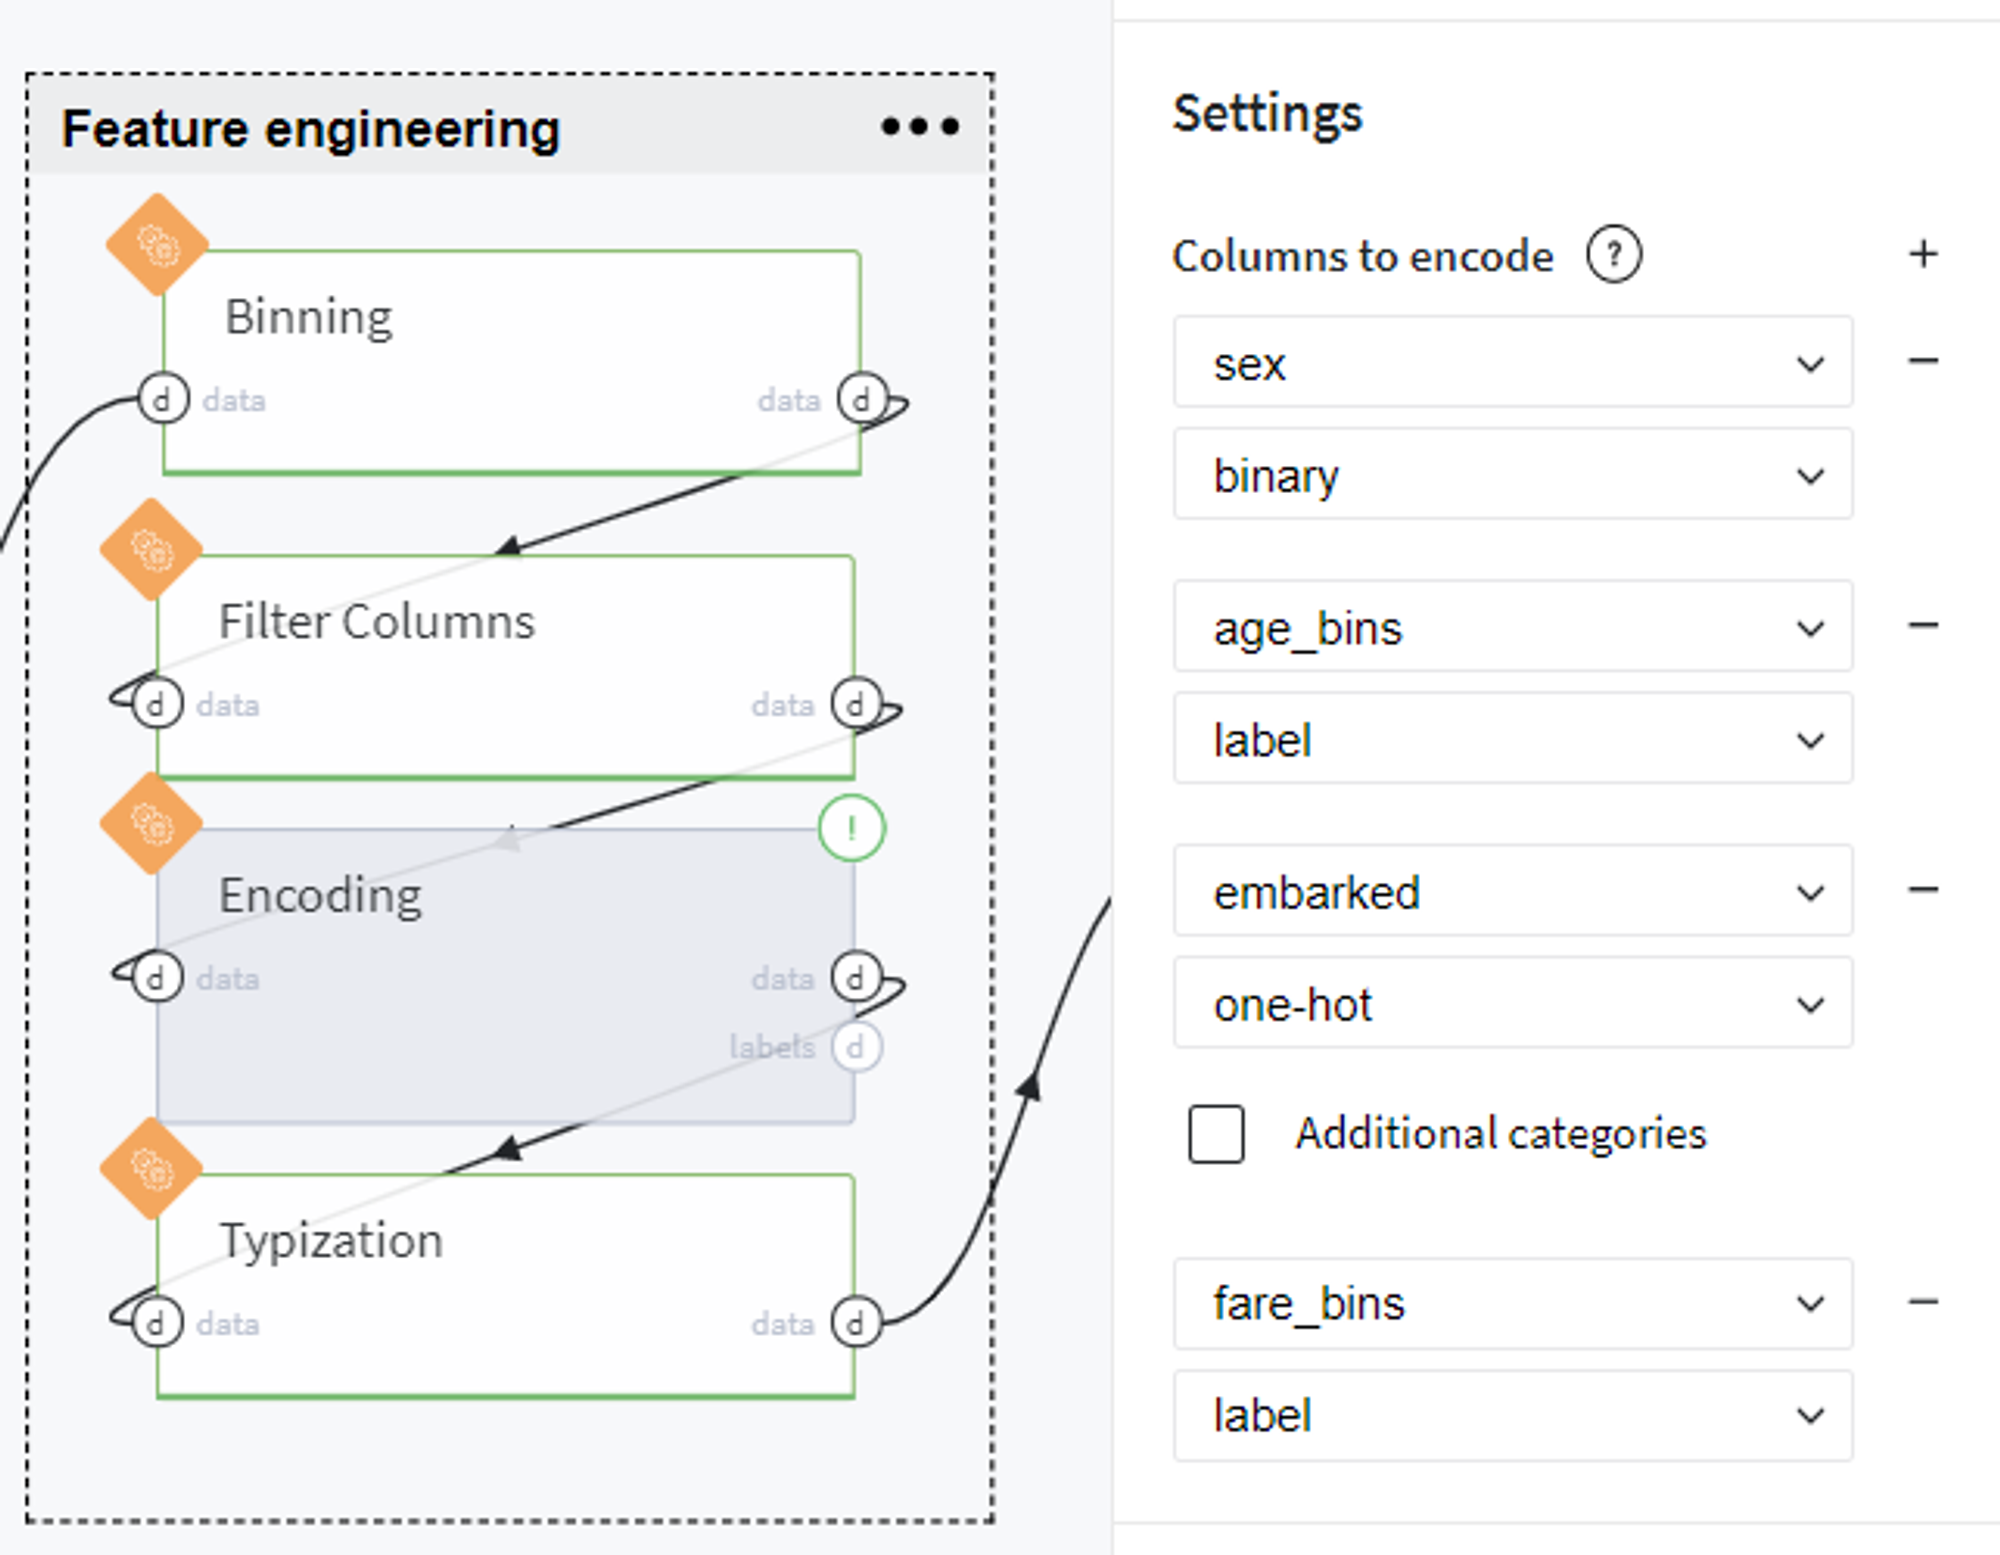
As you can see, we transform the sex column to the binary category, assign label encoder to age_bins and fare_bins, and create dummy variables for the embarked column.
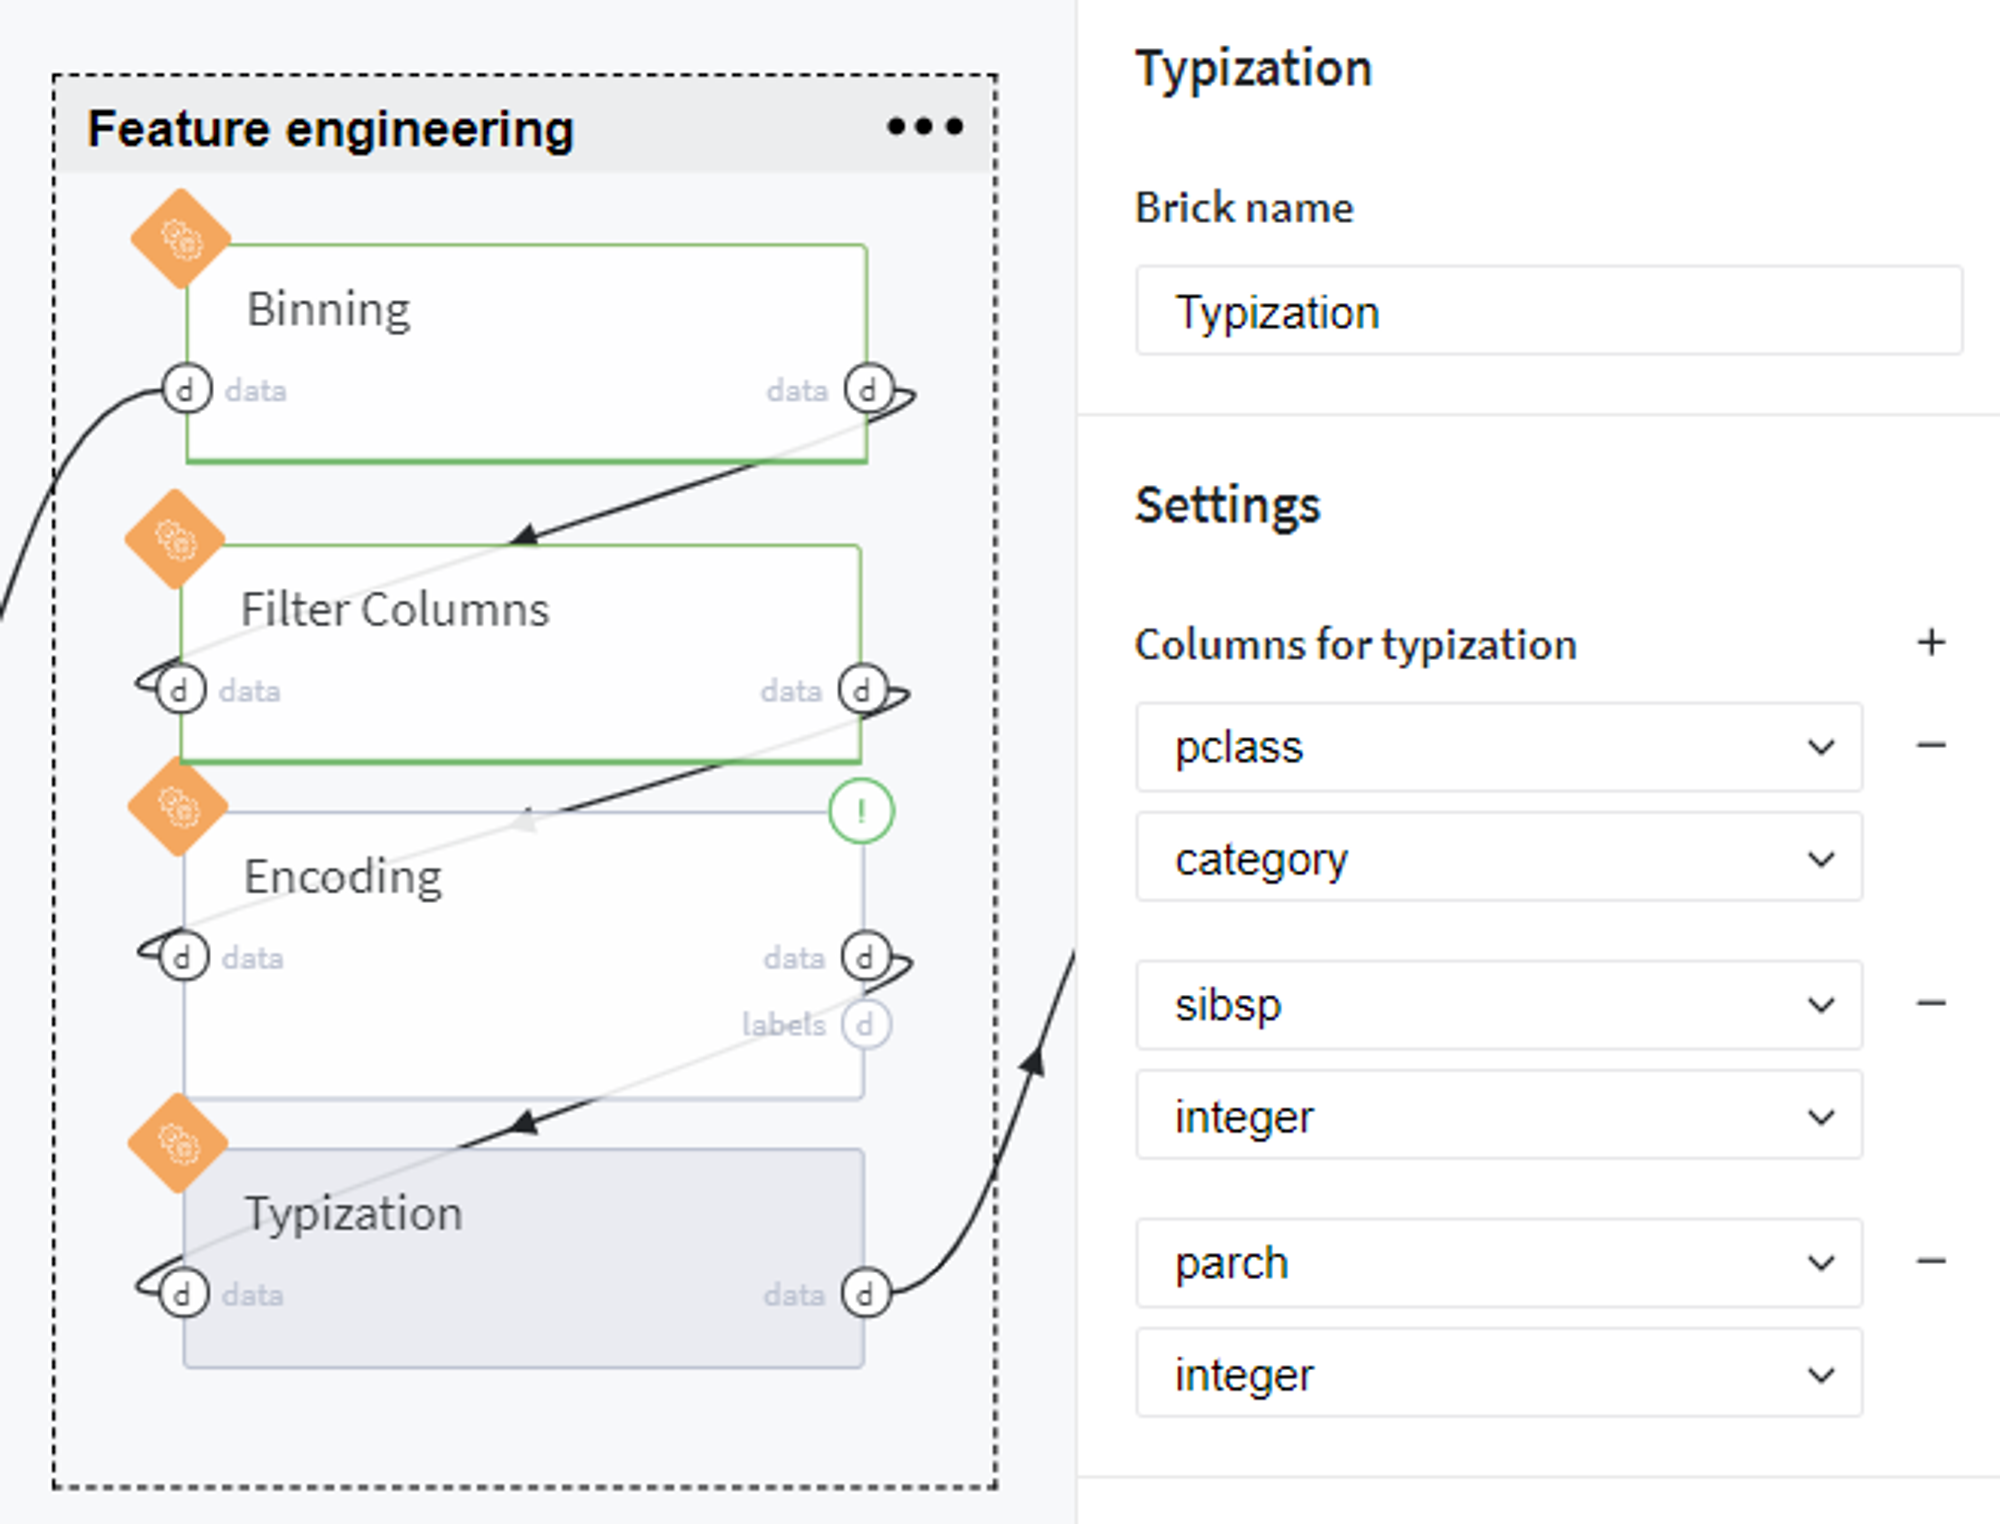
Finally, we provide the relevant data types for existing columns and proceed with the obtained dataset to the next step.
Split data
BRICKS:
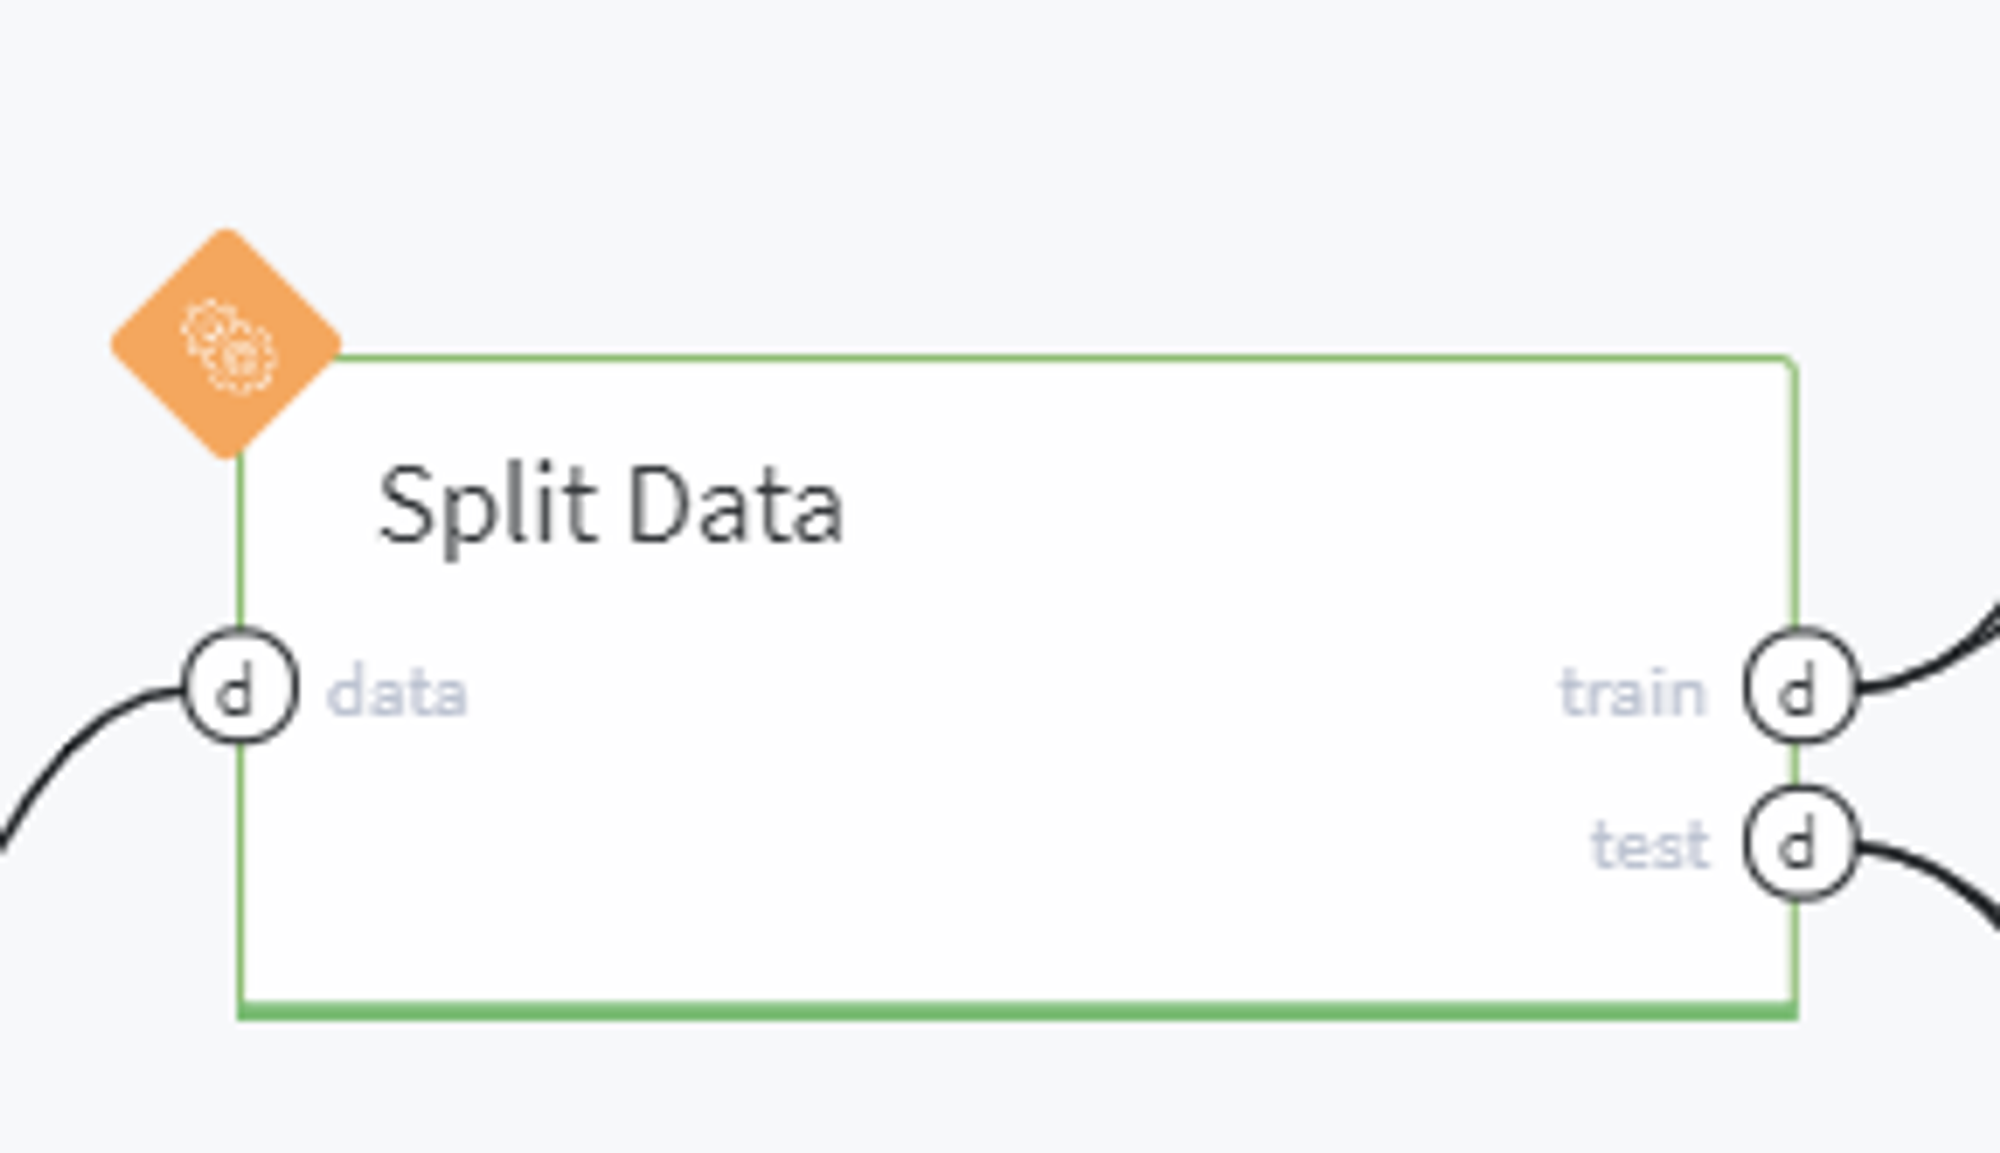
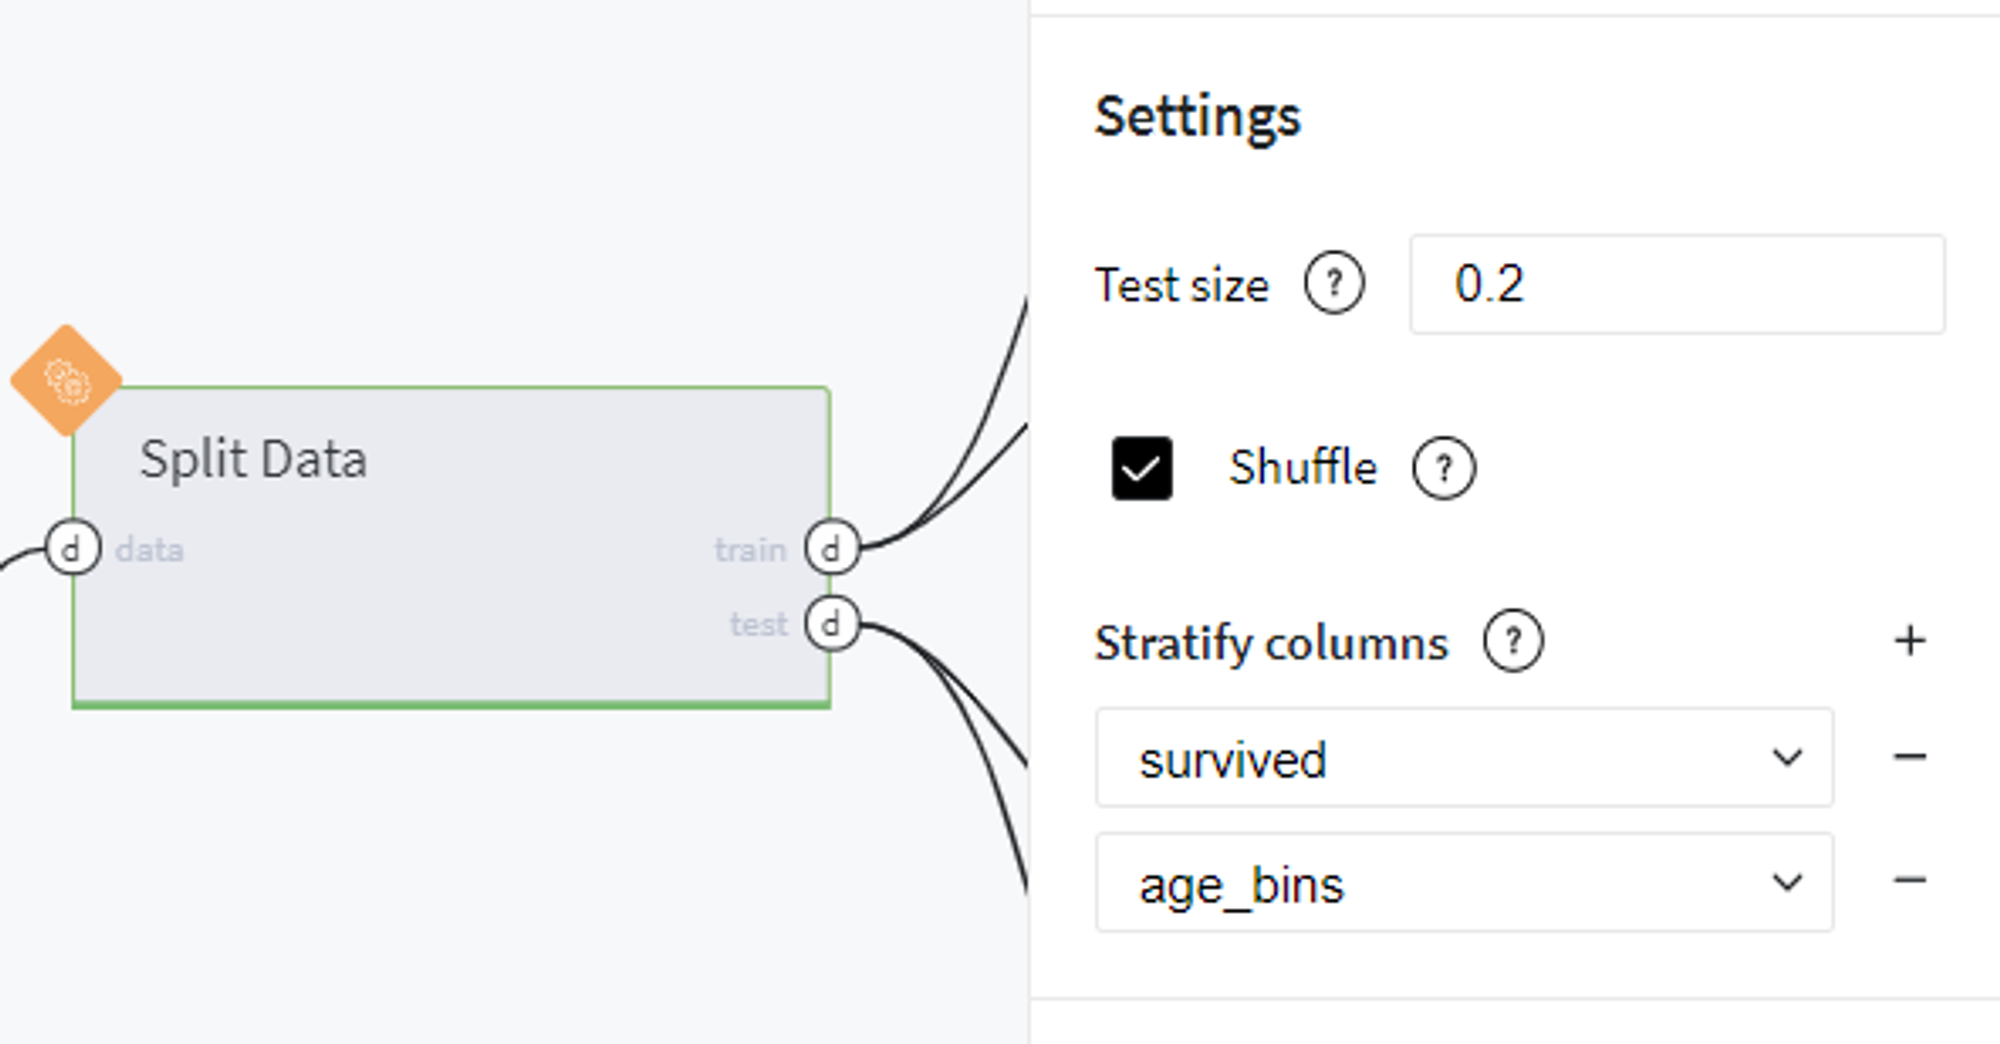
Split DataHere we prepare data sampling for model training and validation.
For the model testing, we take 20% of the input sample, and in order to satisfy subgroups homogeneity, apply additional stratification by survived and age_bins variables.
Model training
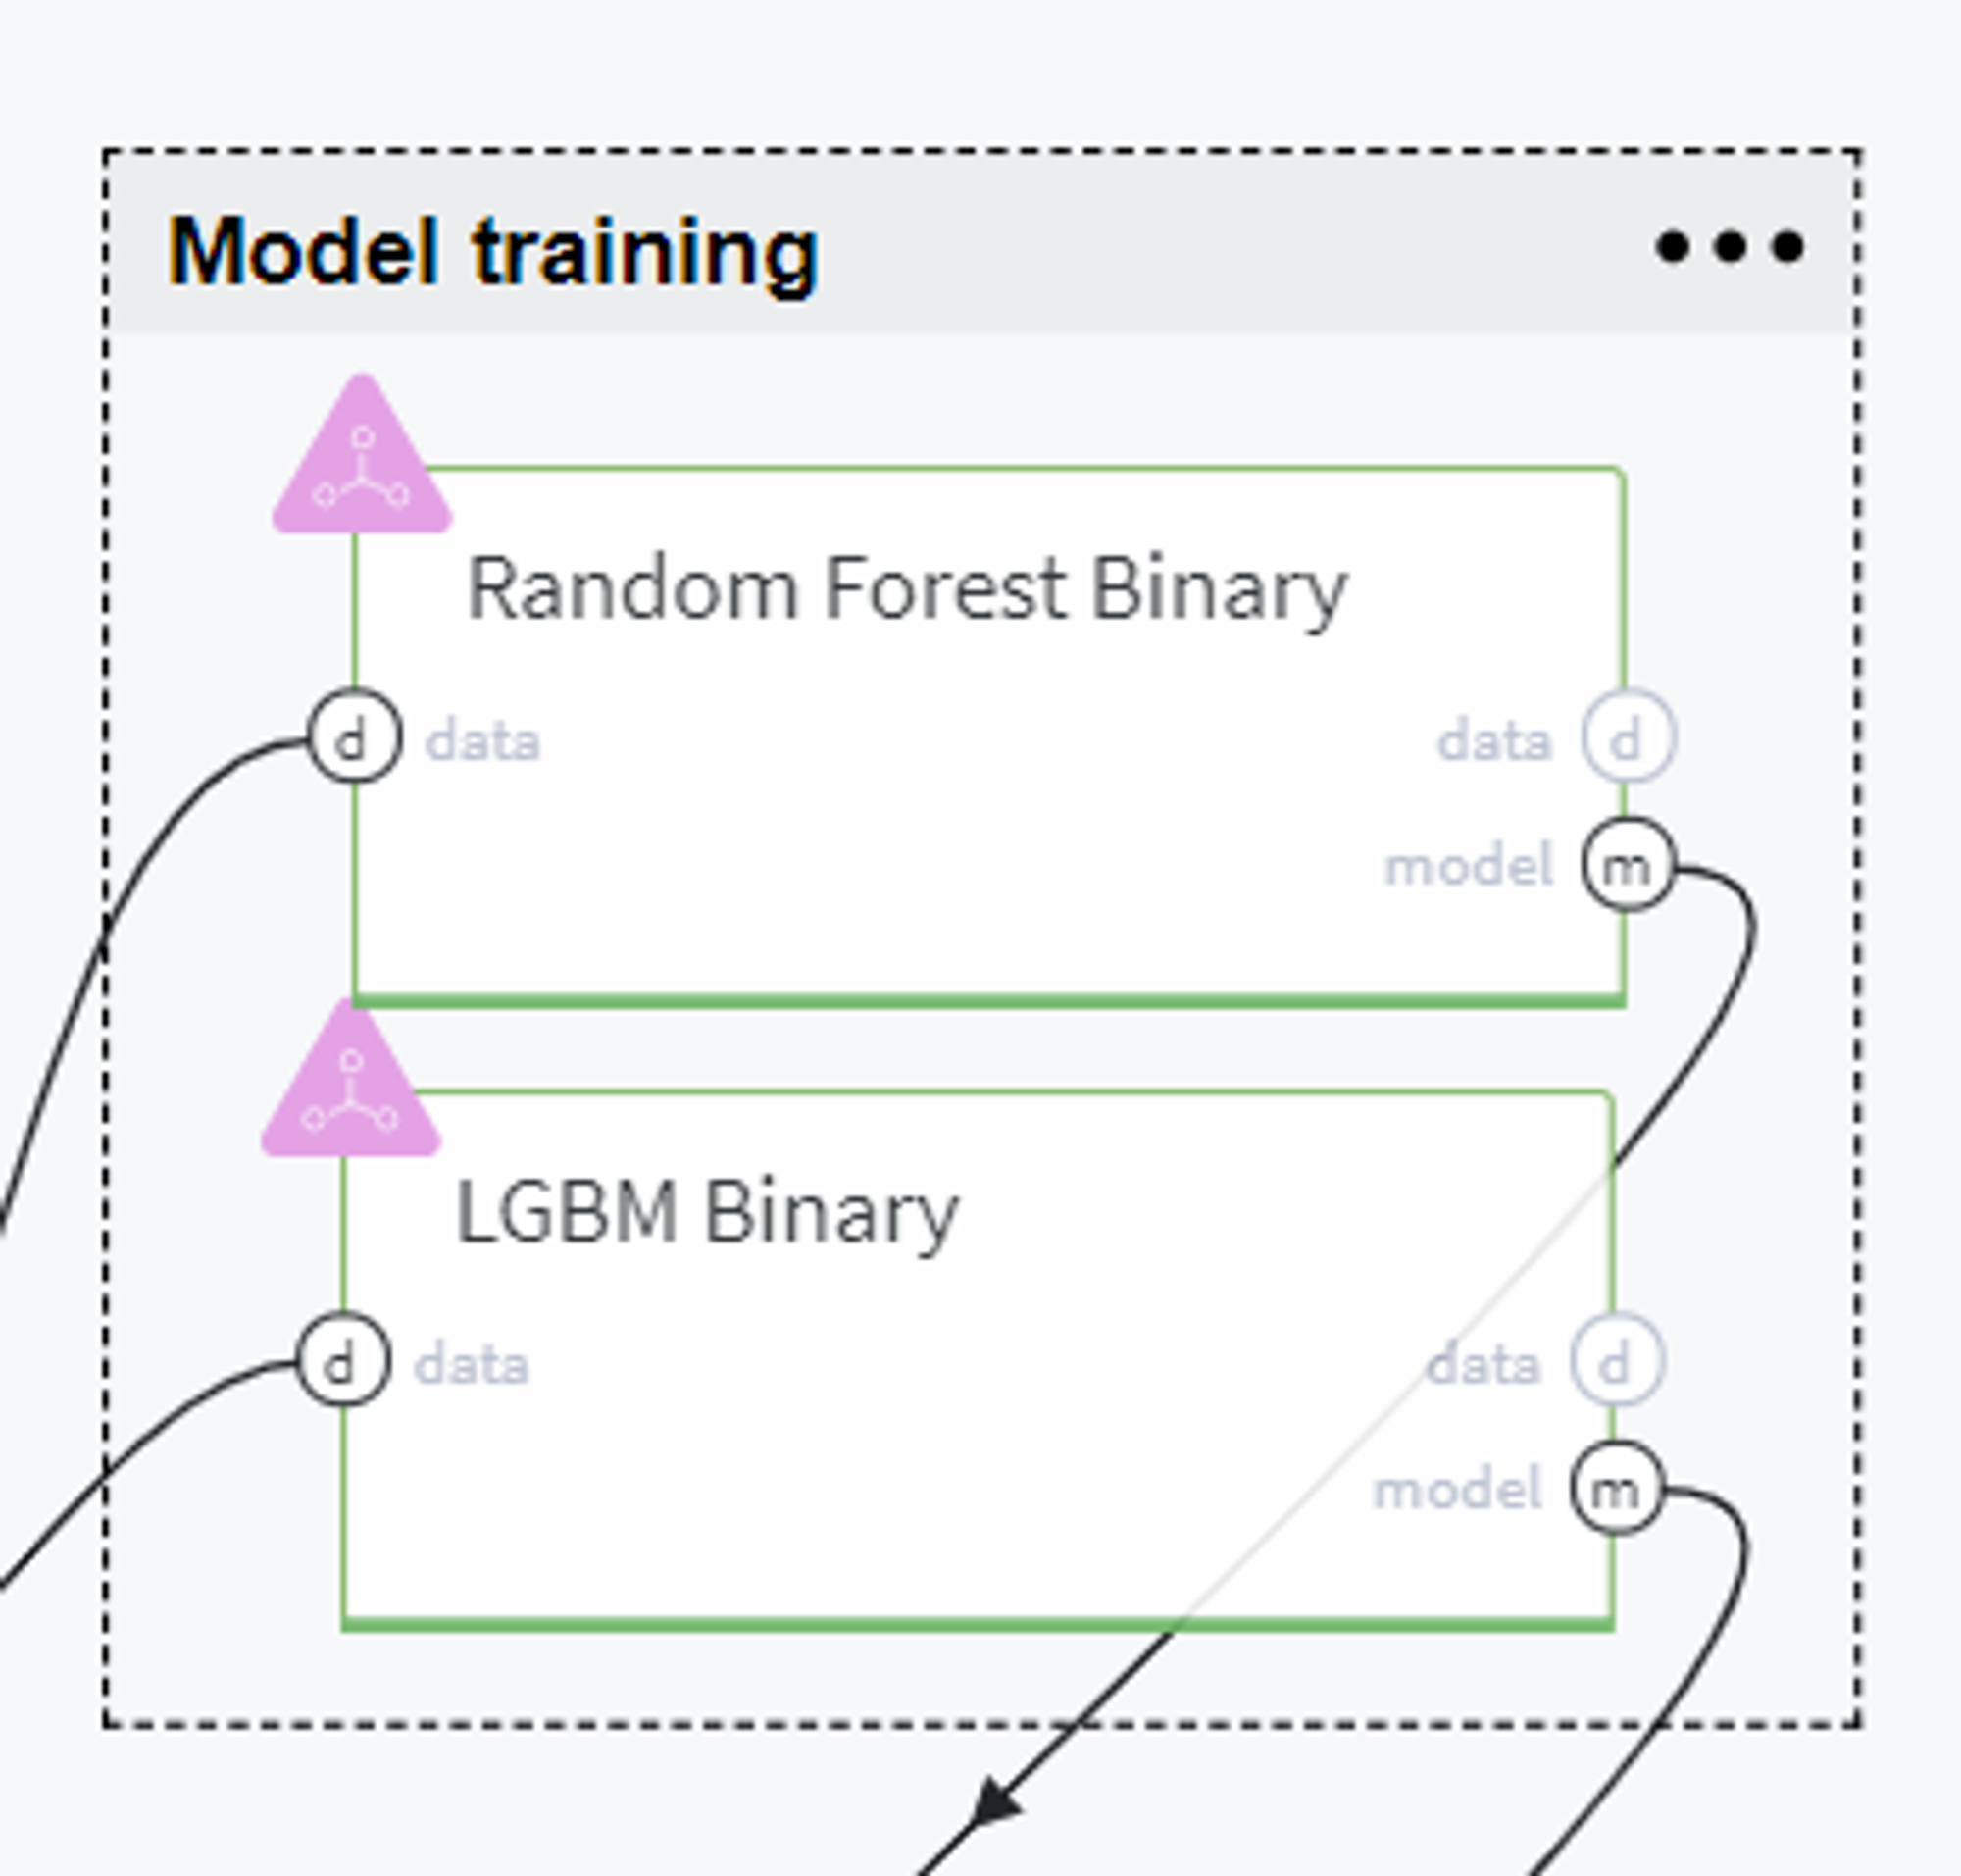
Now, using the train data we build several forecasting models to compare and select the best one for solving our case.
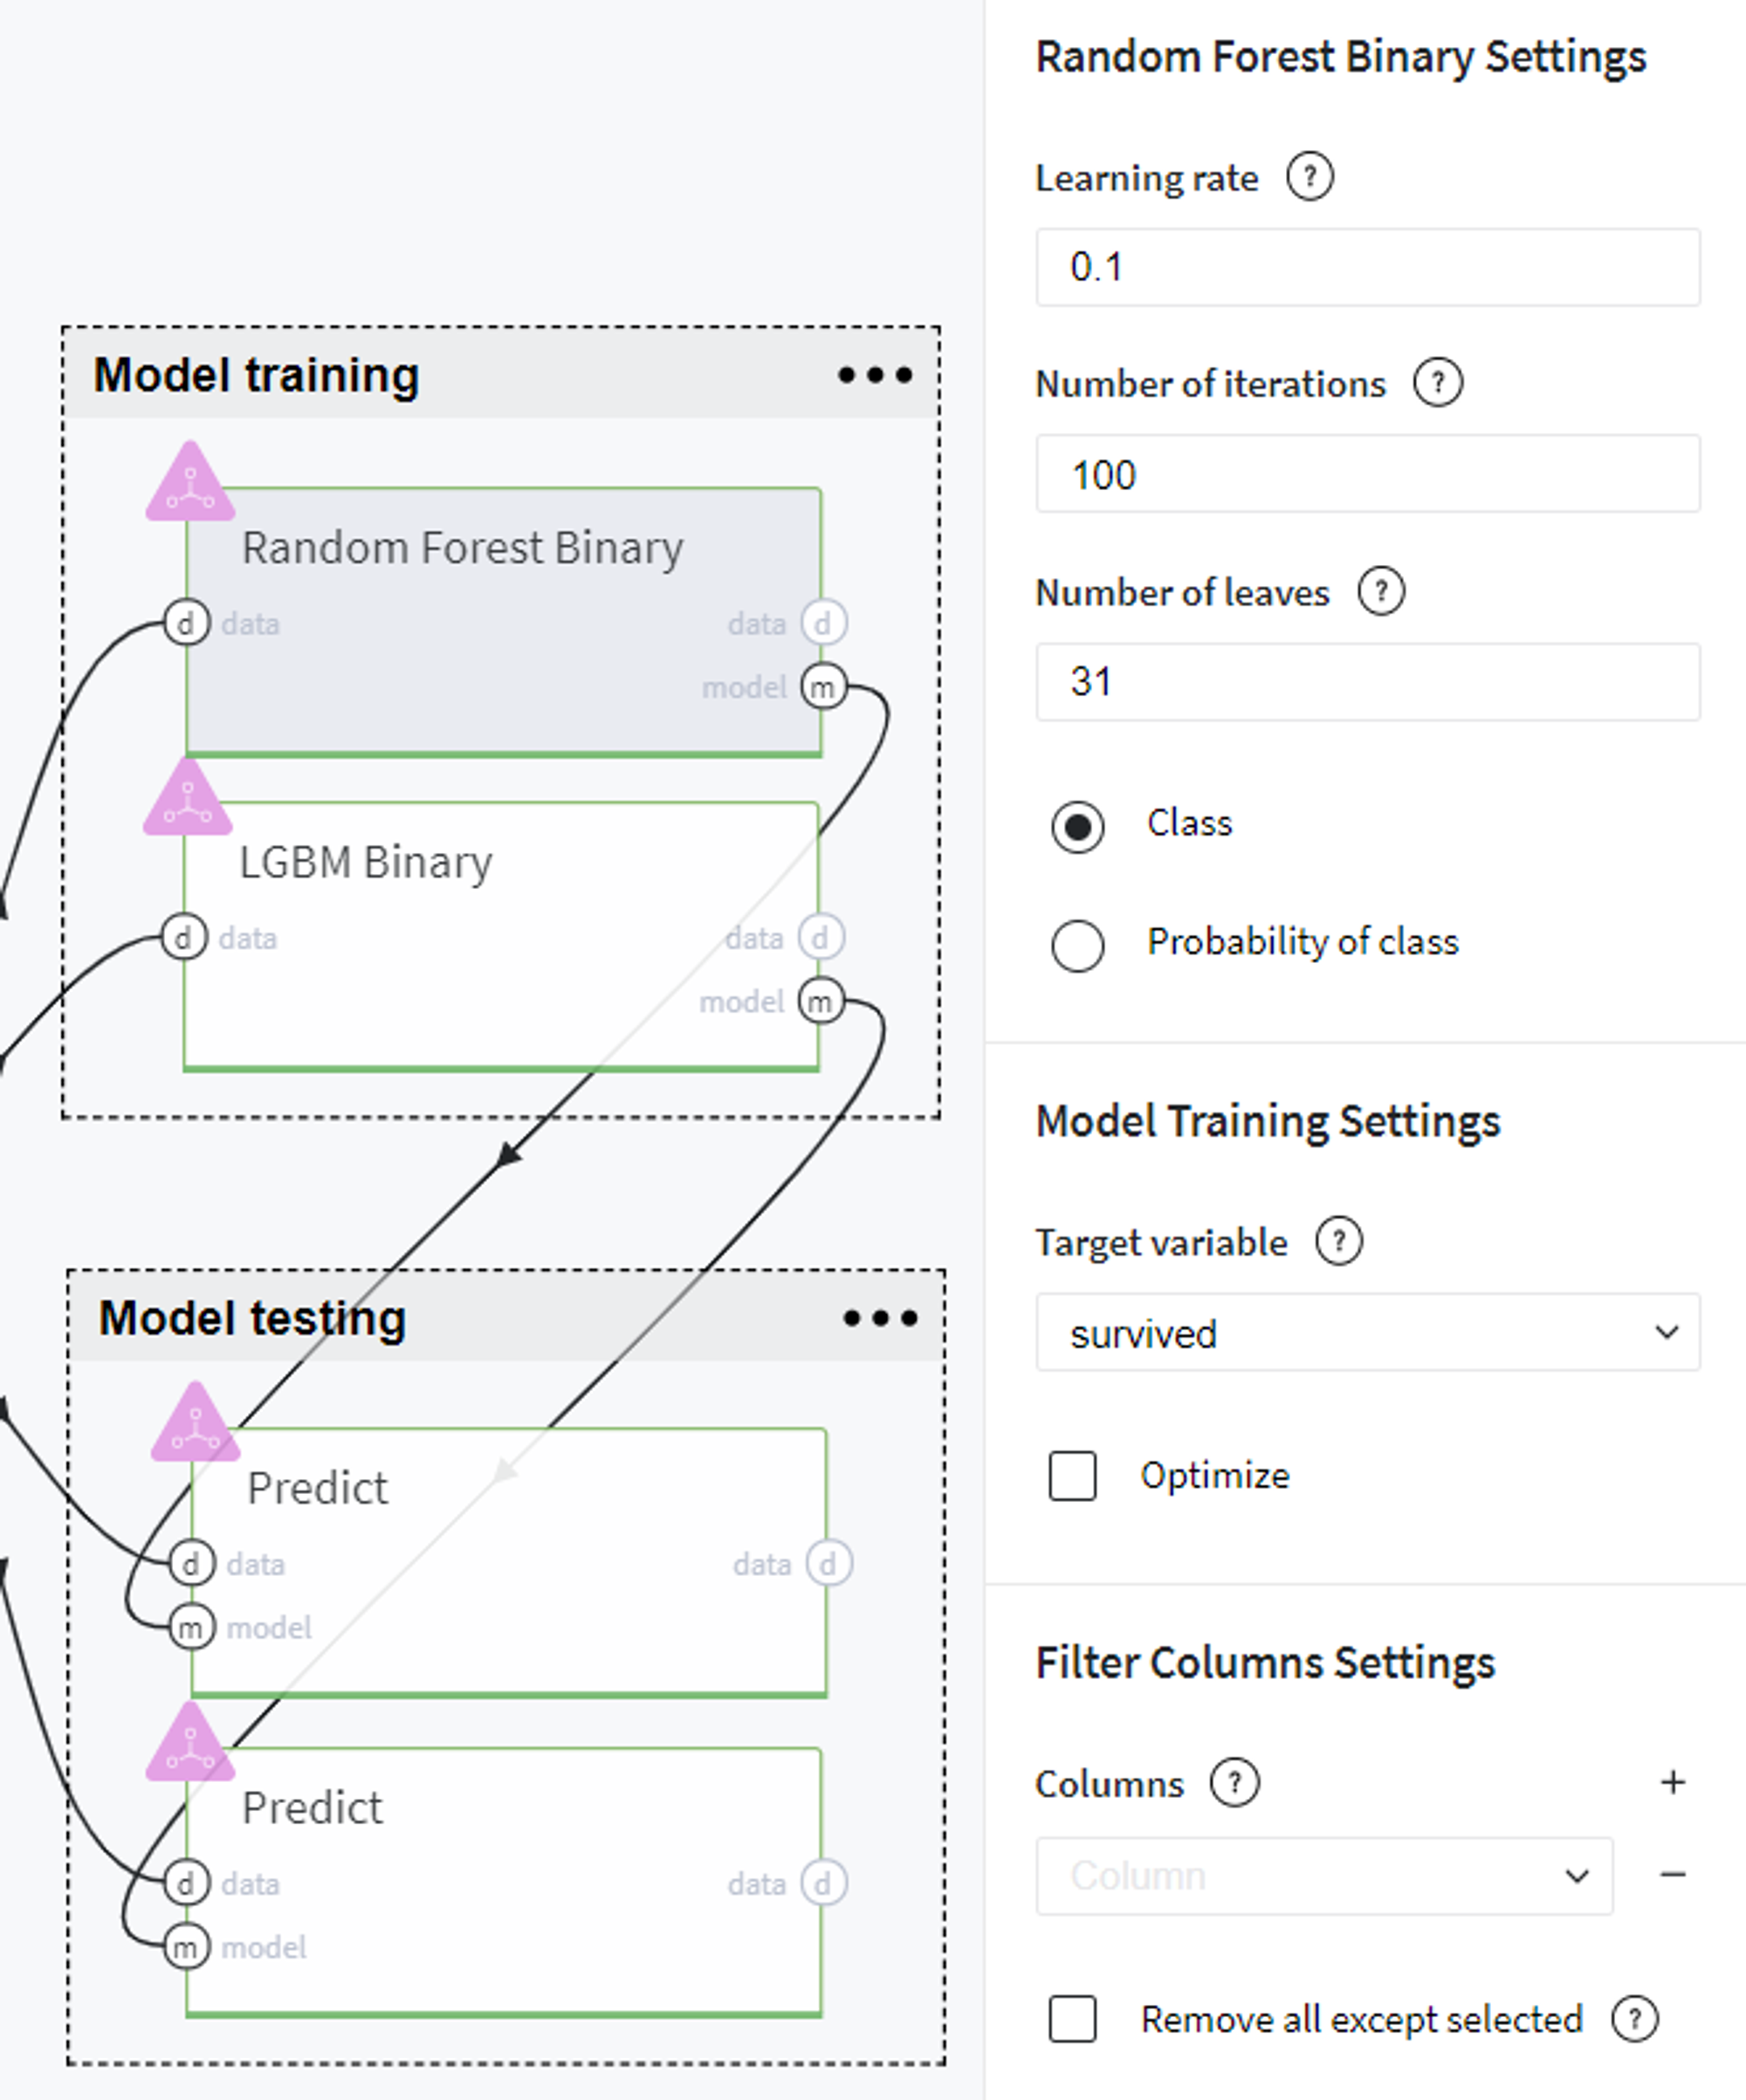
The first model we chose to experiment with is Random Forest Binary. Here we use all the features that are presented in our dataset, specify the target variable (survived) and define the model hyperparameters as follows:
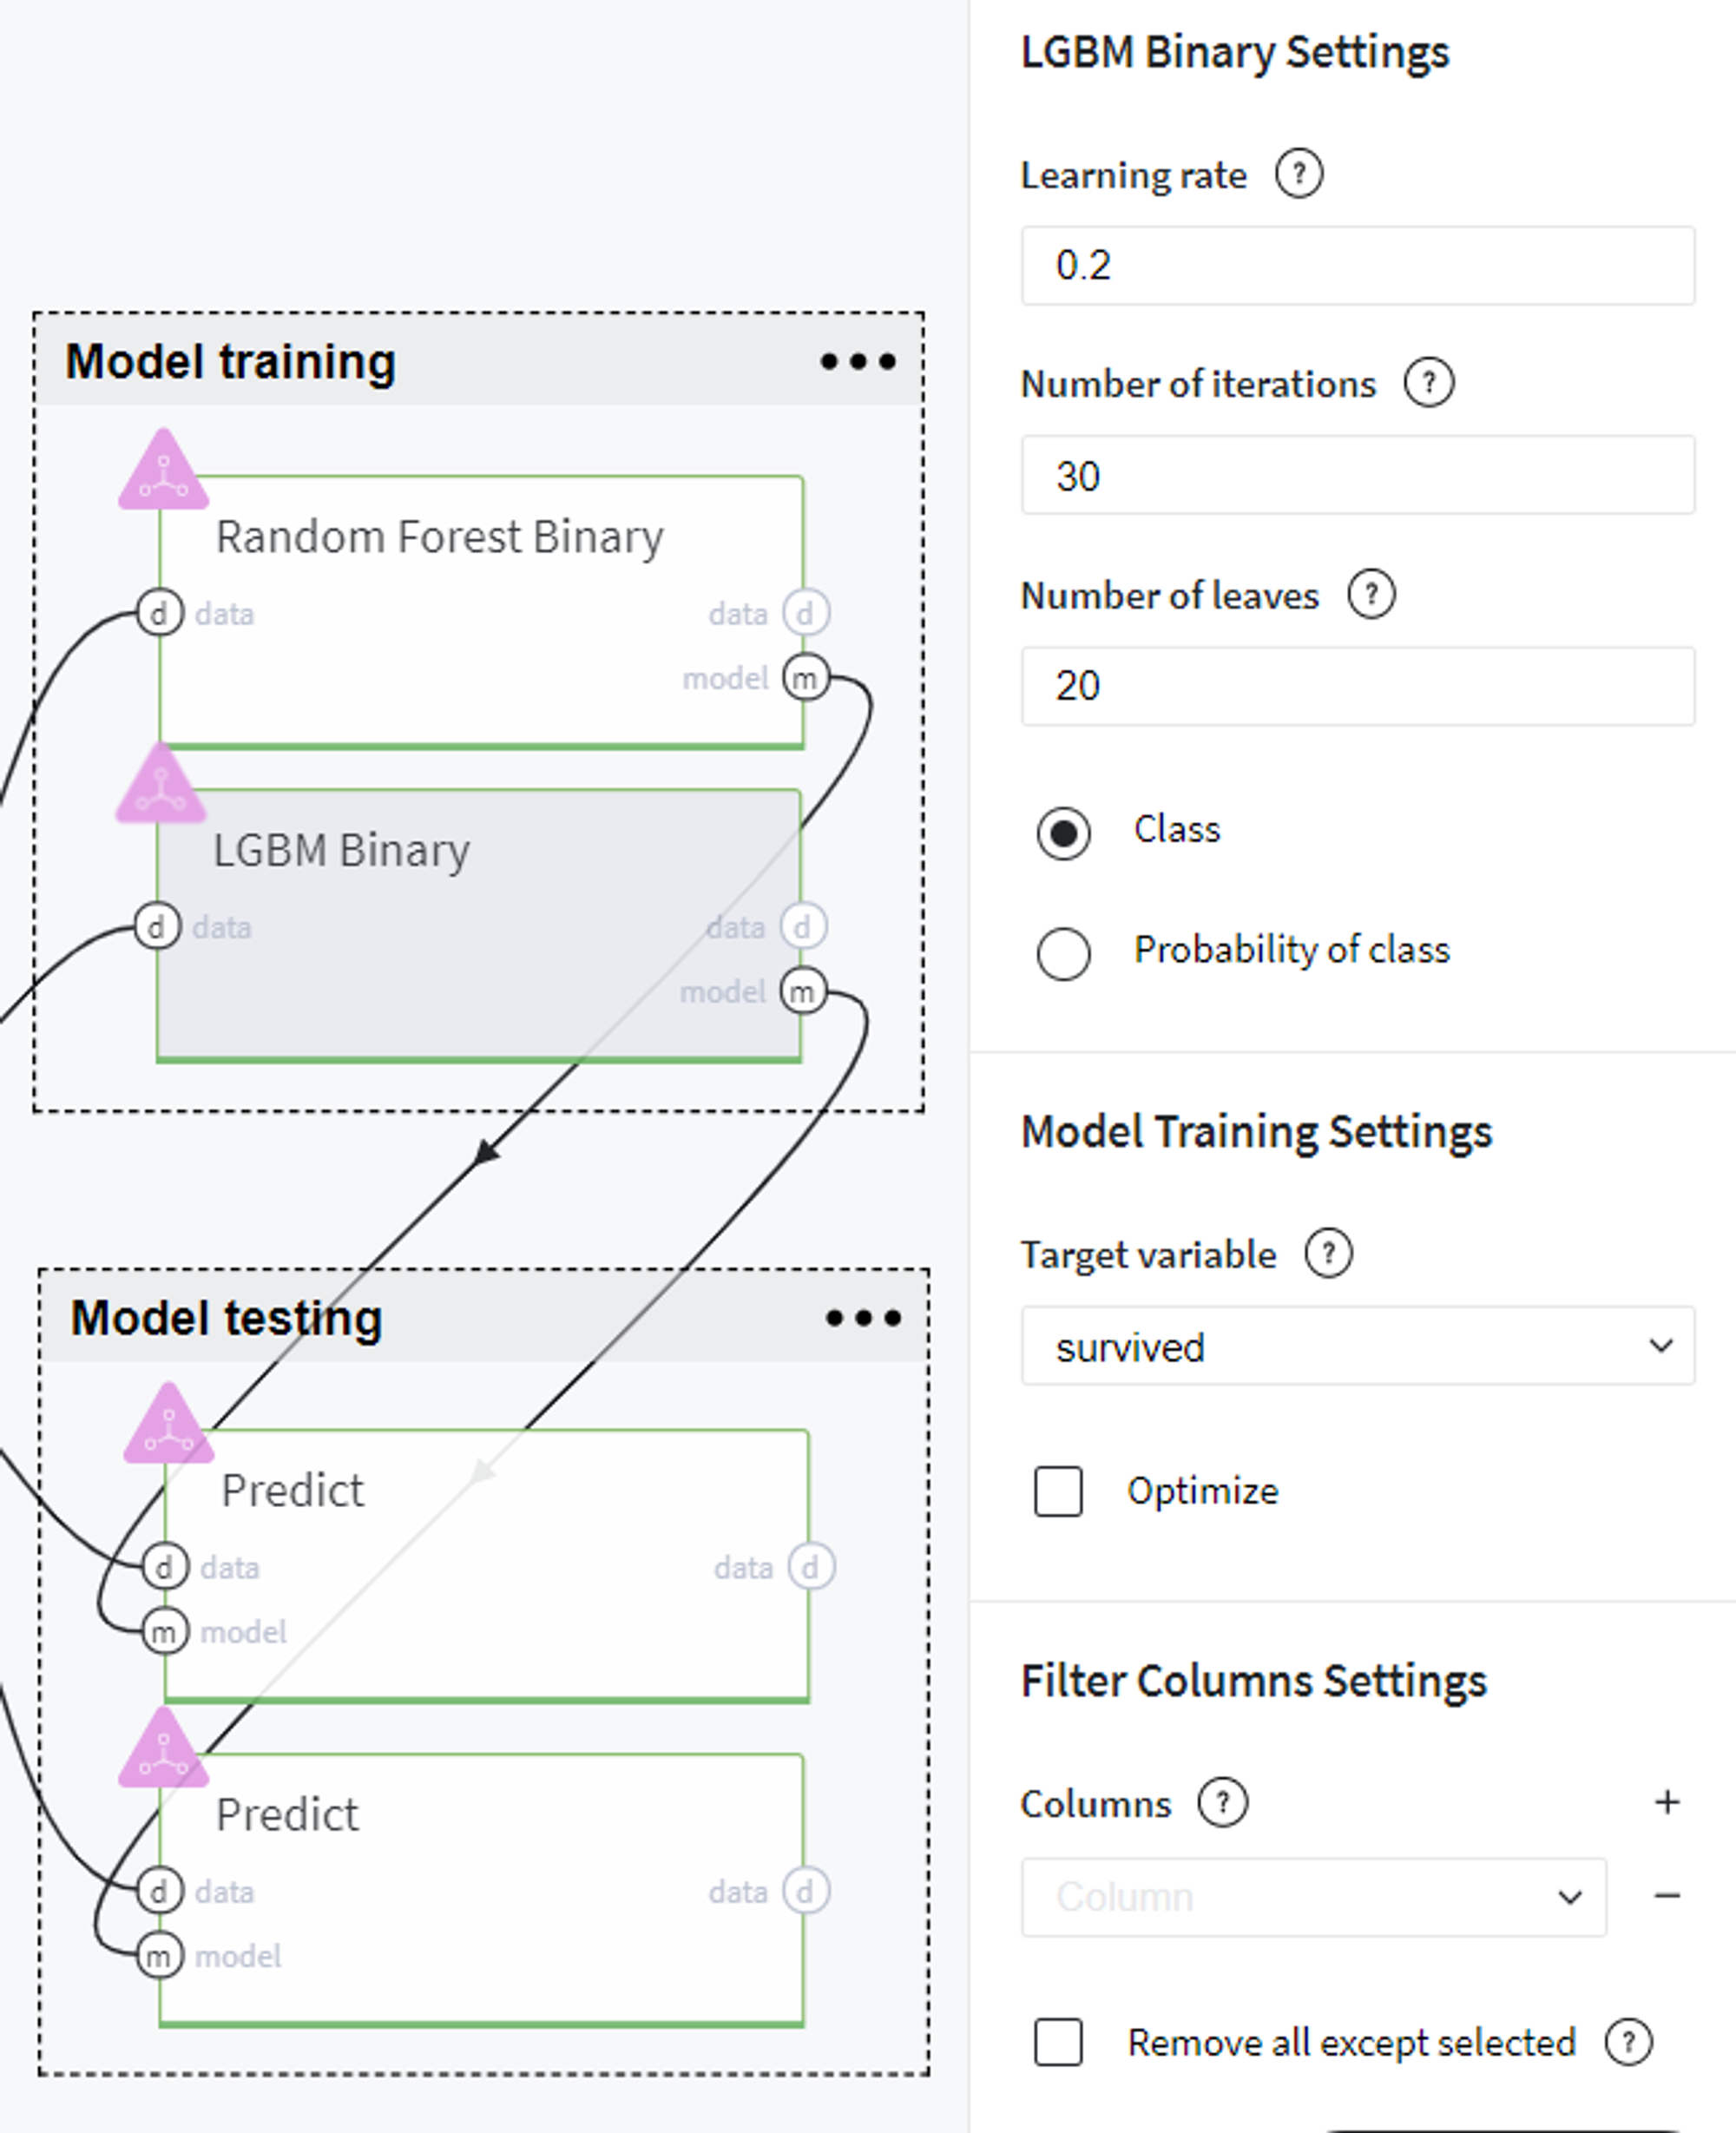
Alternatively, using the same train set we build another tree-based model - LGBM Binary with the following settings:
After performing these steps we can evaluate the models' performance on the train data using Model info → Open view on every brick menu and, for instance, compare the common prediction metrics of two models.
Random Forest Binary performance (train)
LGBM Binary performance (train)
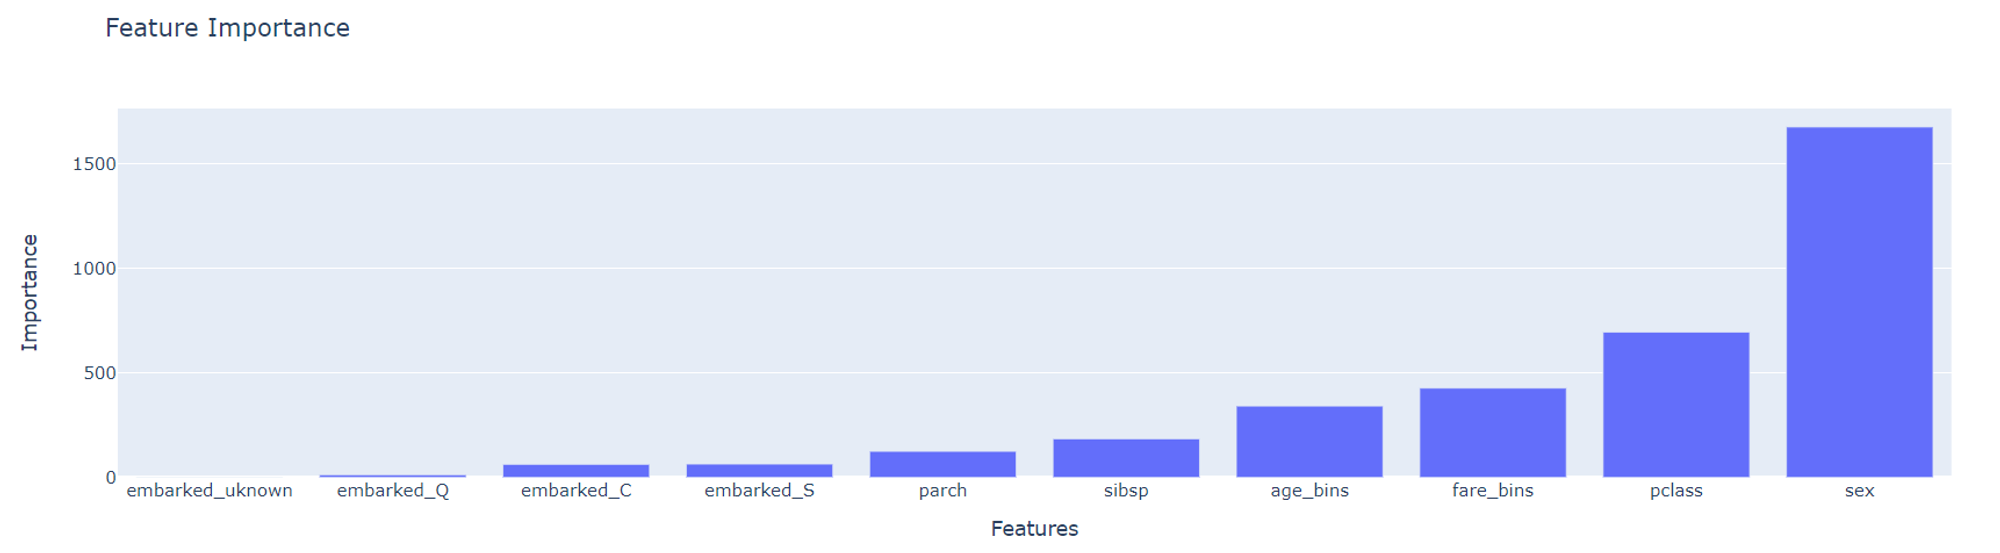
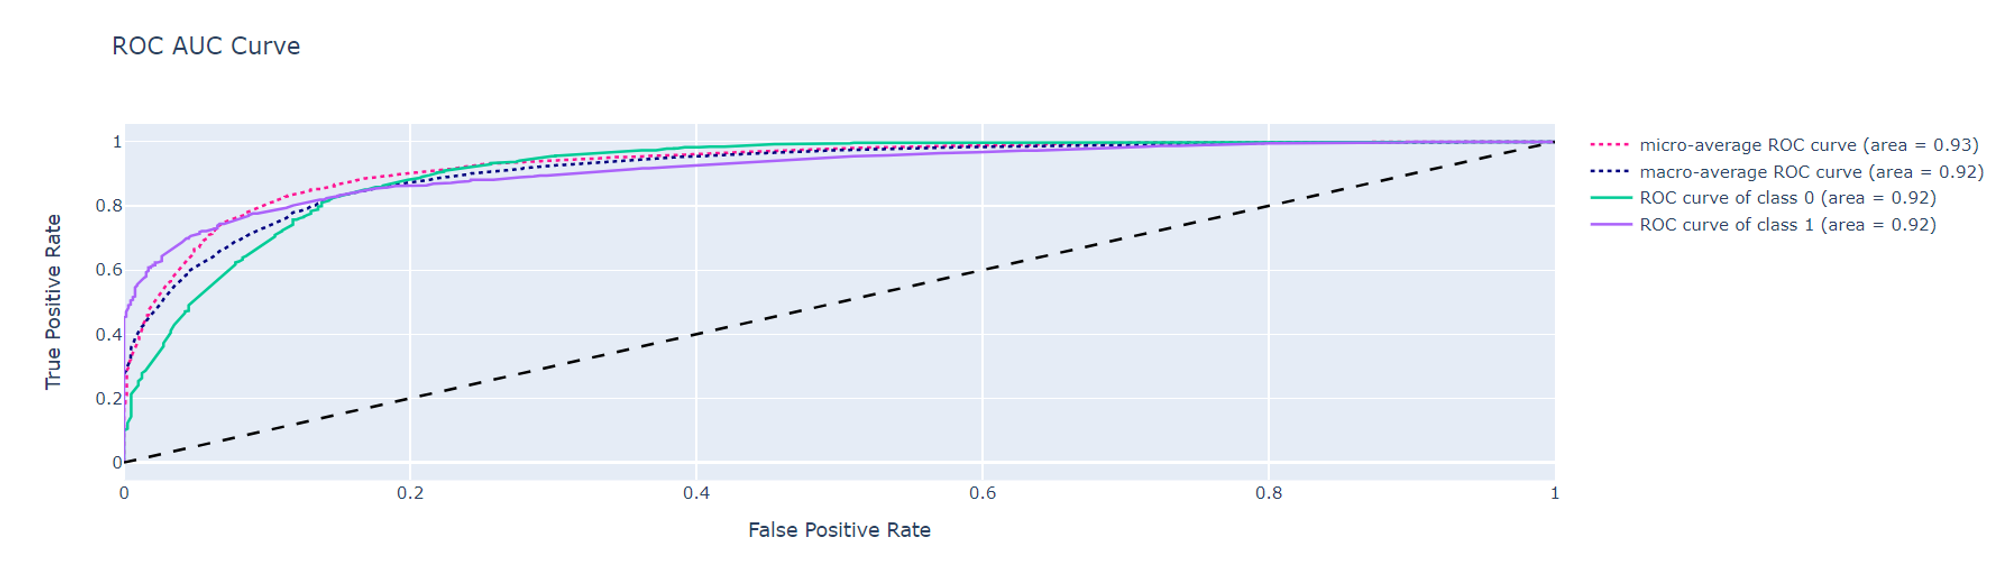
Additionally, on the same tab we can review other model characteristics such as feature importance, ROC AUC curve etc.
Model testing
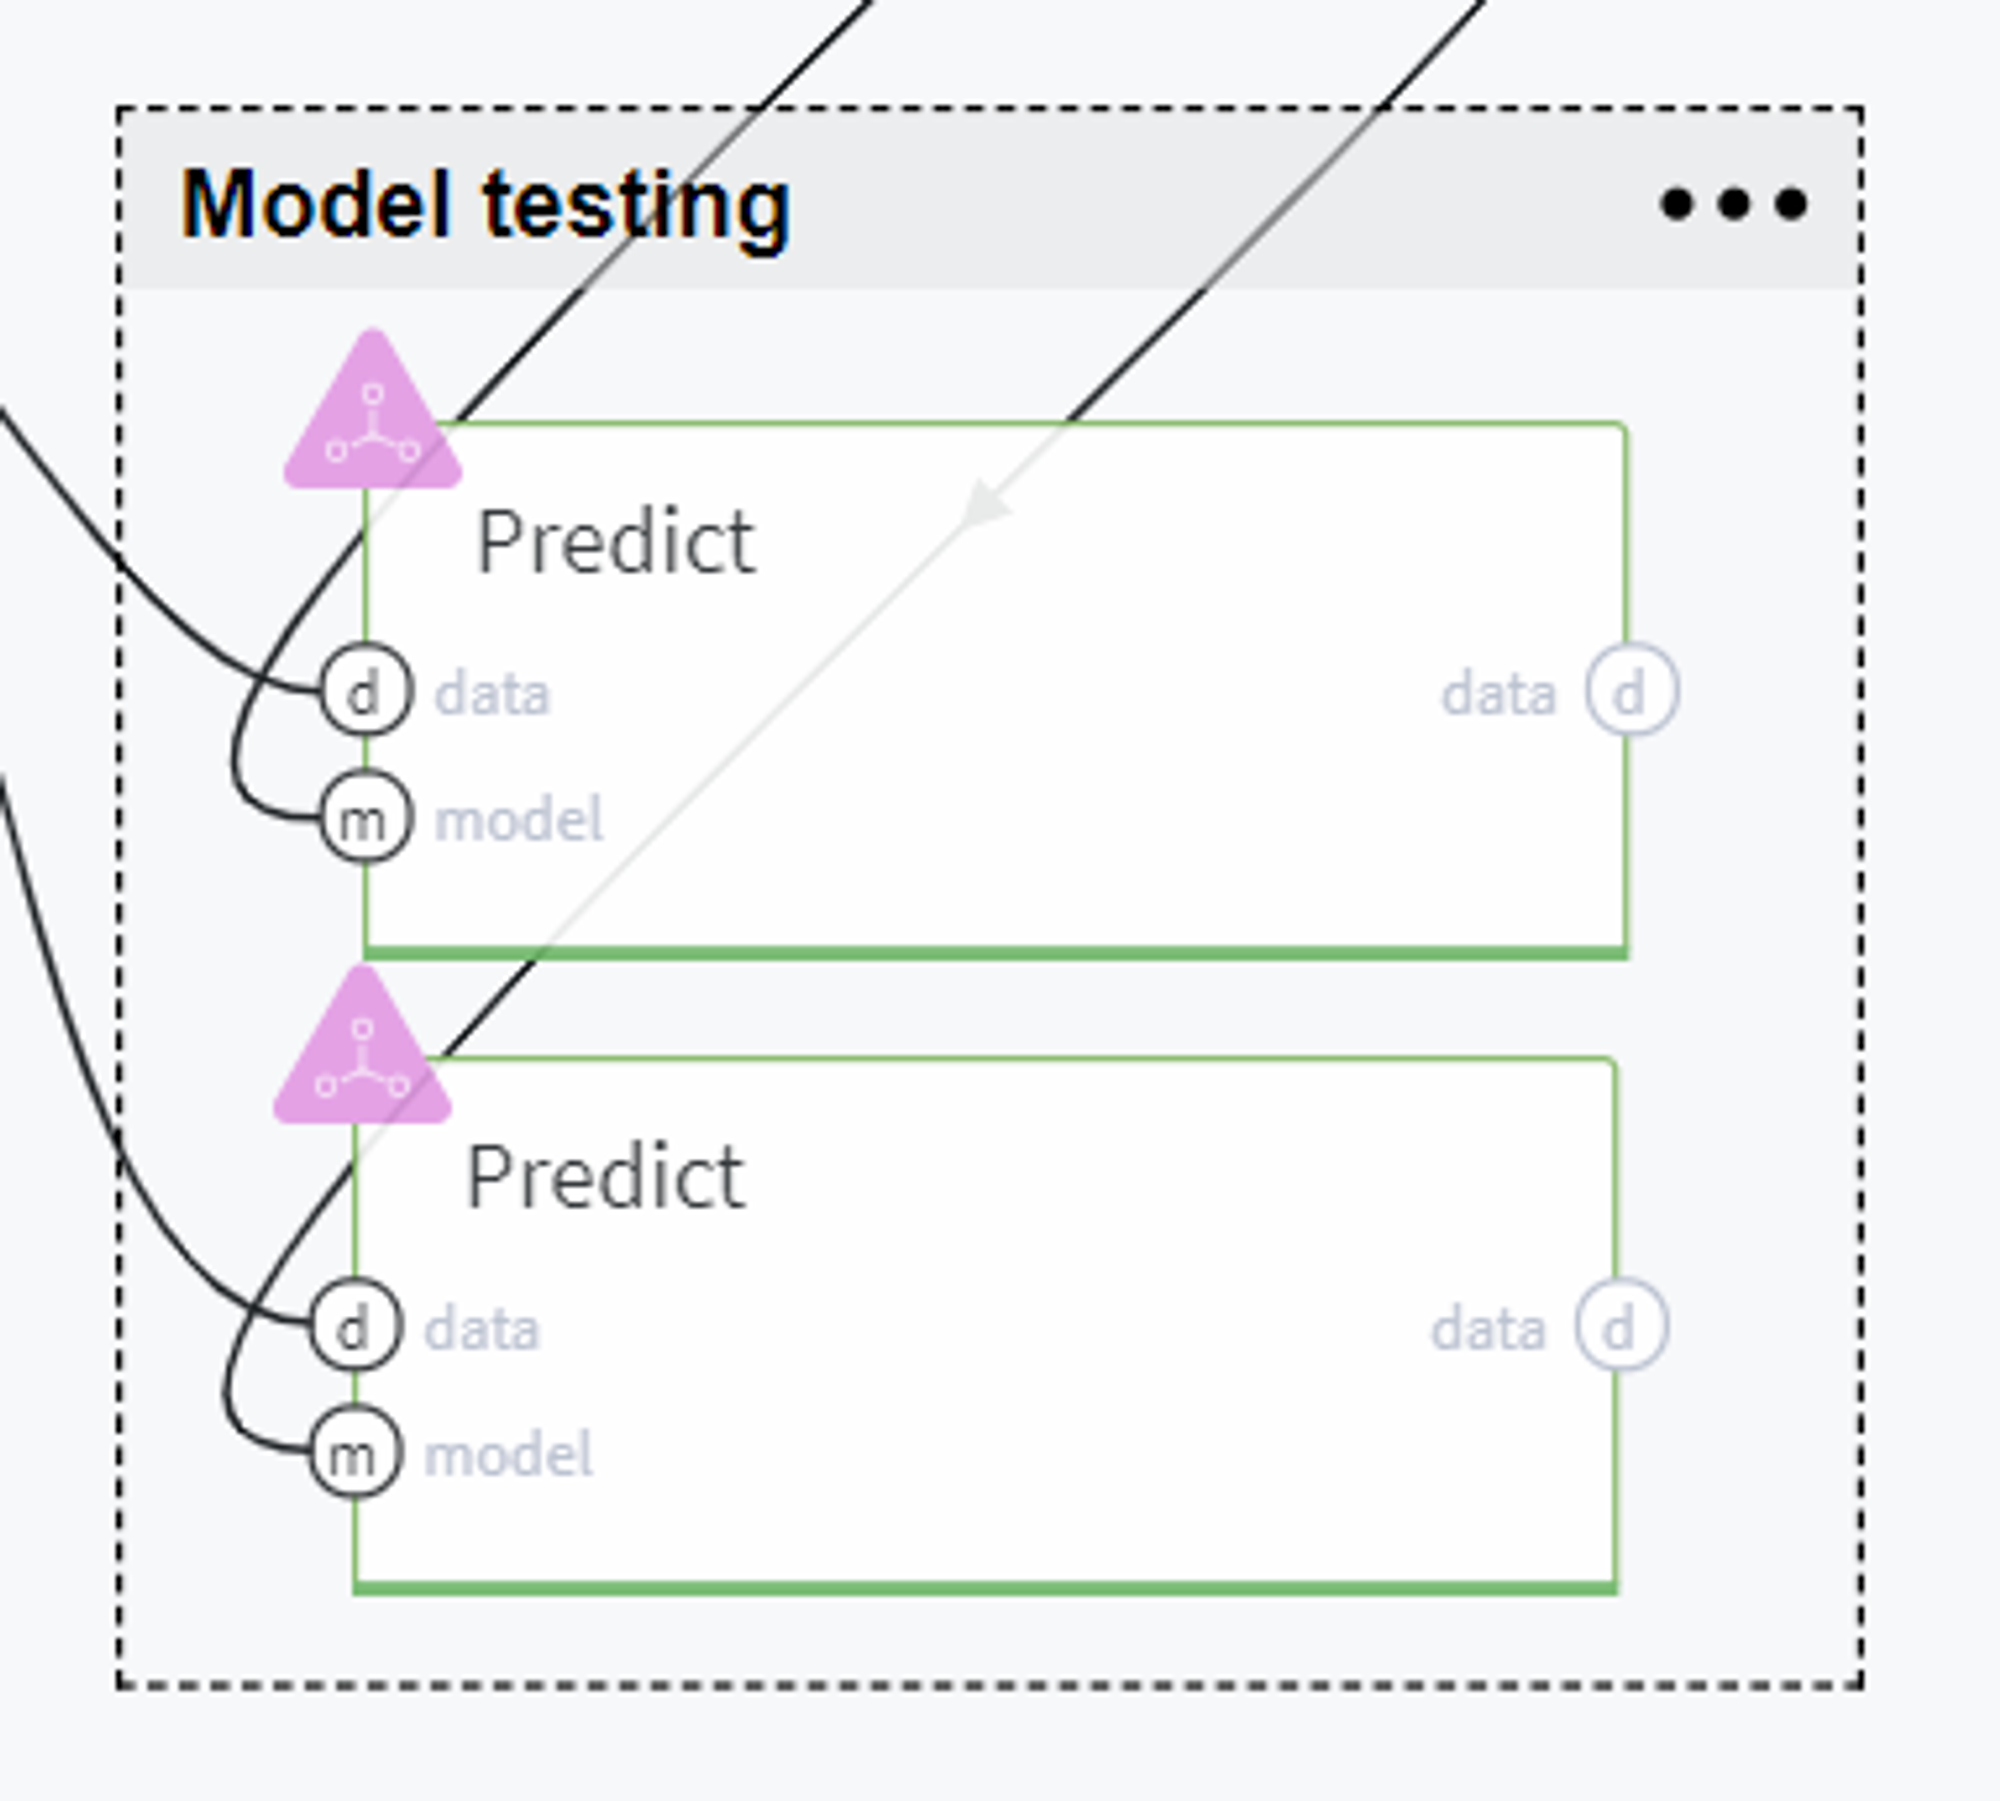
BRICKS:
PredictThereafter, we evaluate the trained models on the test set using Predict brick and compare the models' performance on the tab Predict stats → Model Performance on every brick:
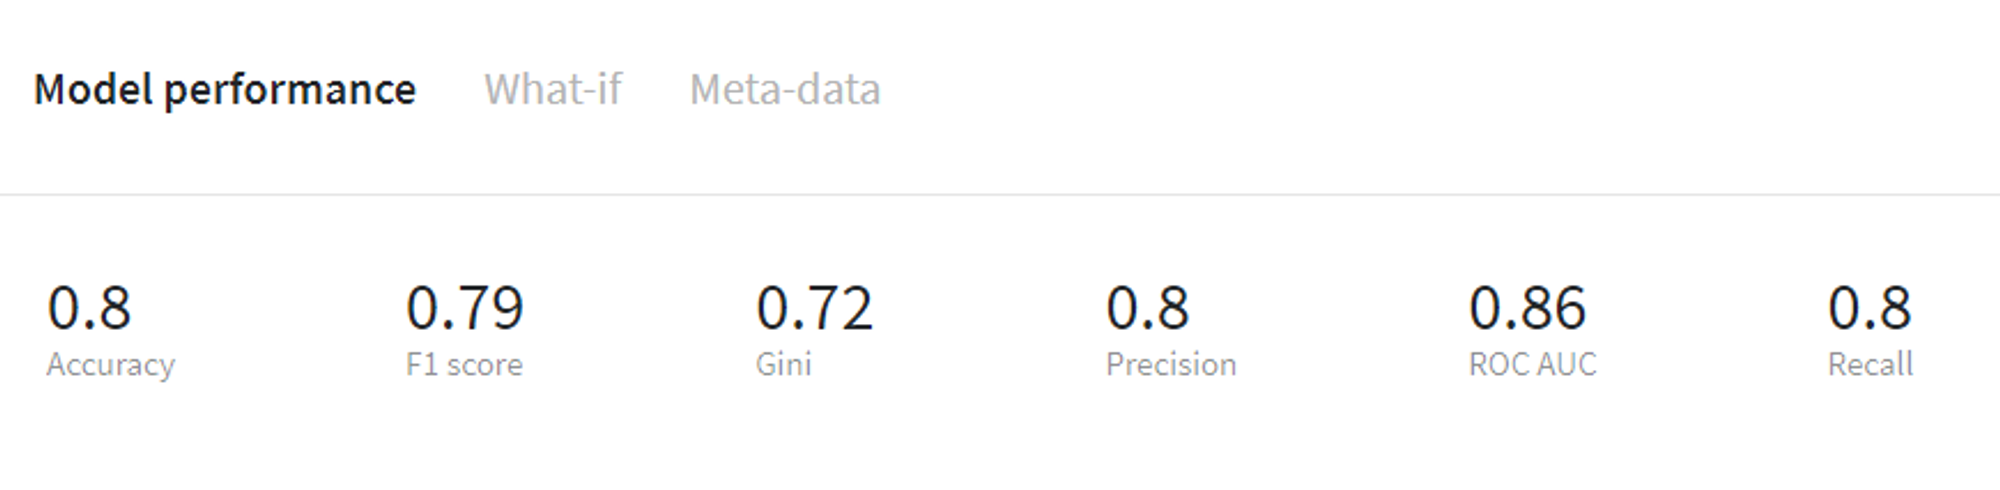
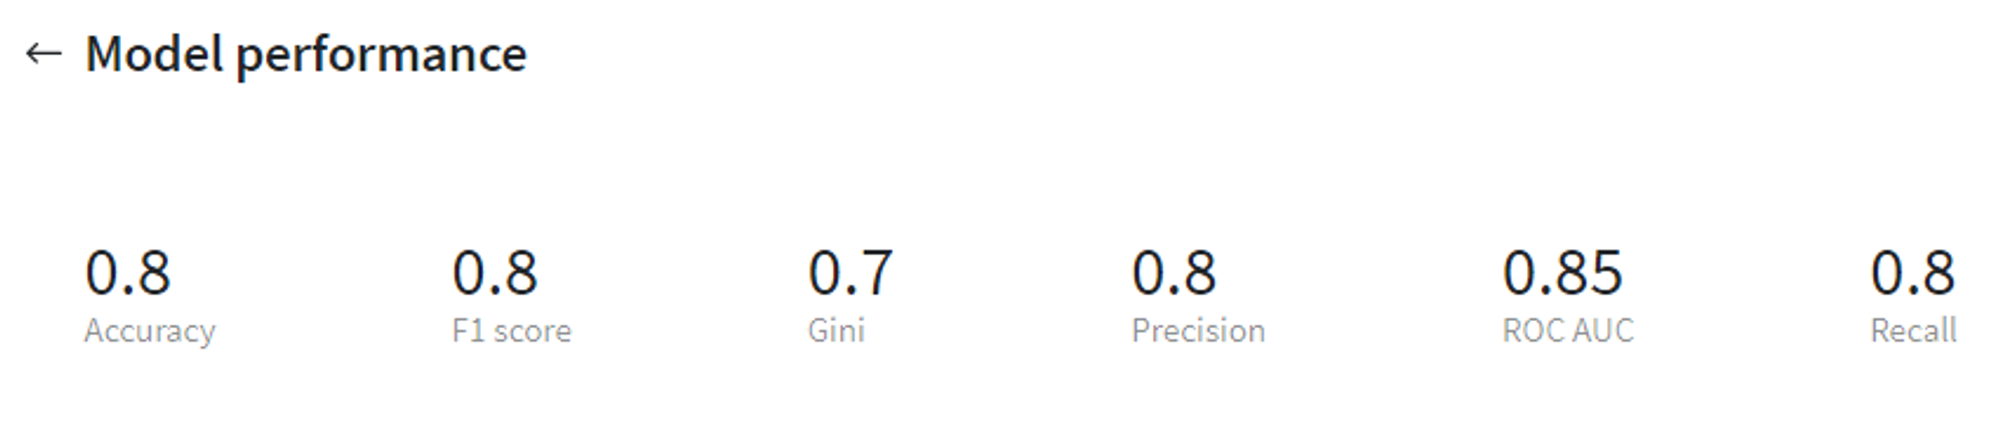
Random Forest Binary performance (test)
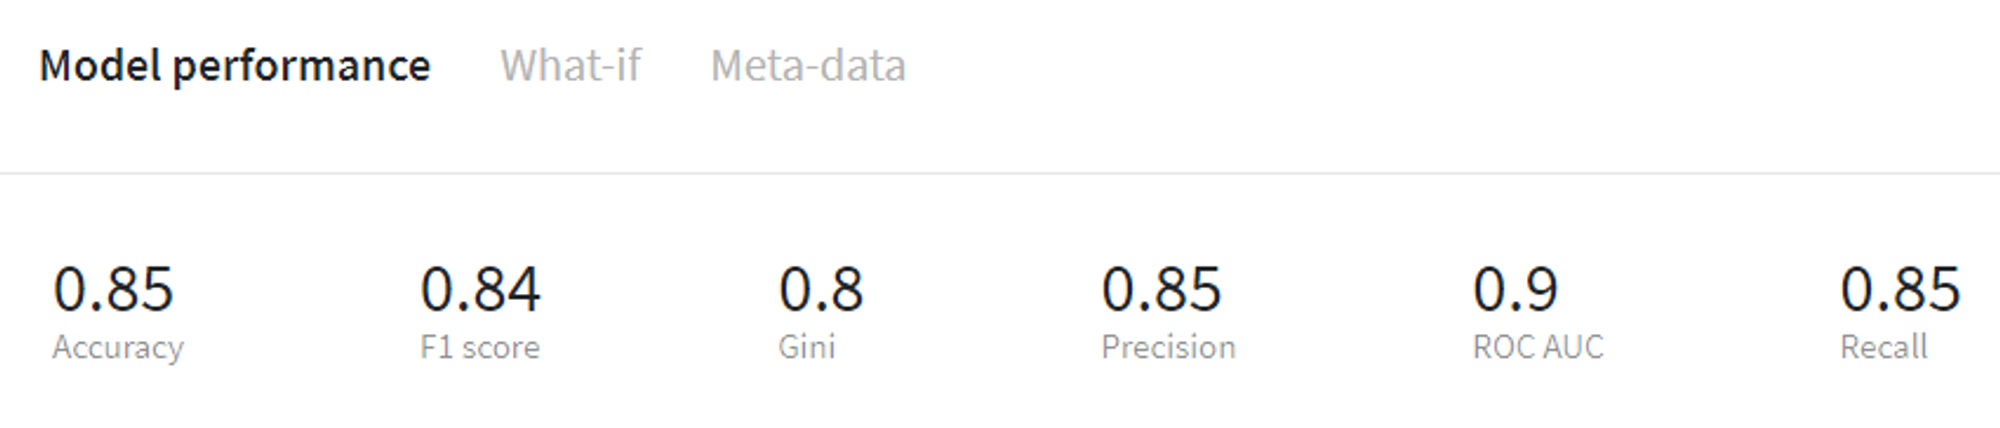
LGBM Binary performance (test)
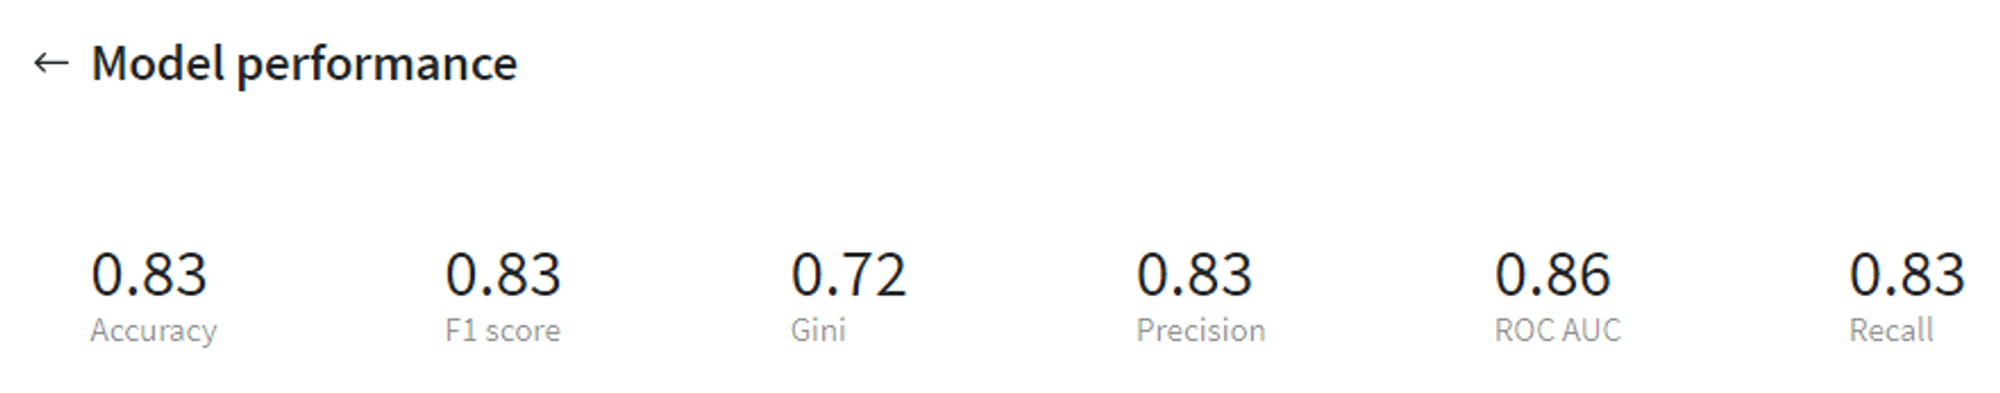
From that we can see that the LGBM Binary model gives us more accurate results both on the train and test sets, therefore it makes sense to use this model for further predictions.
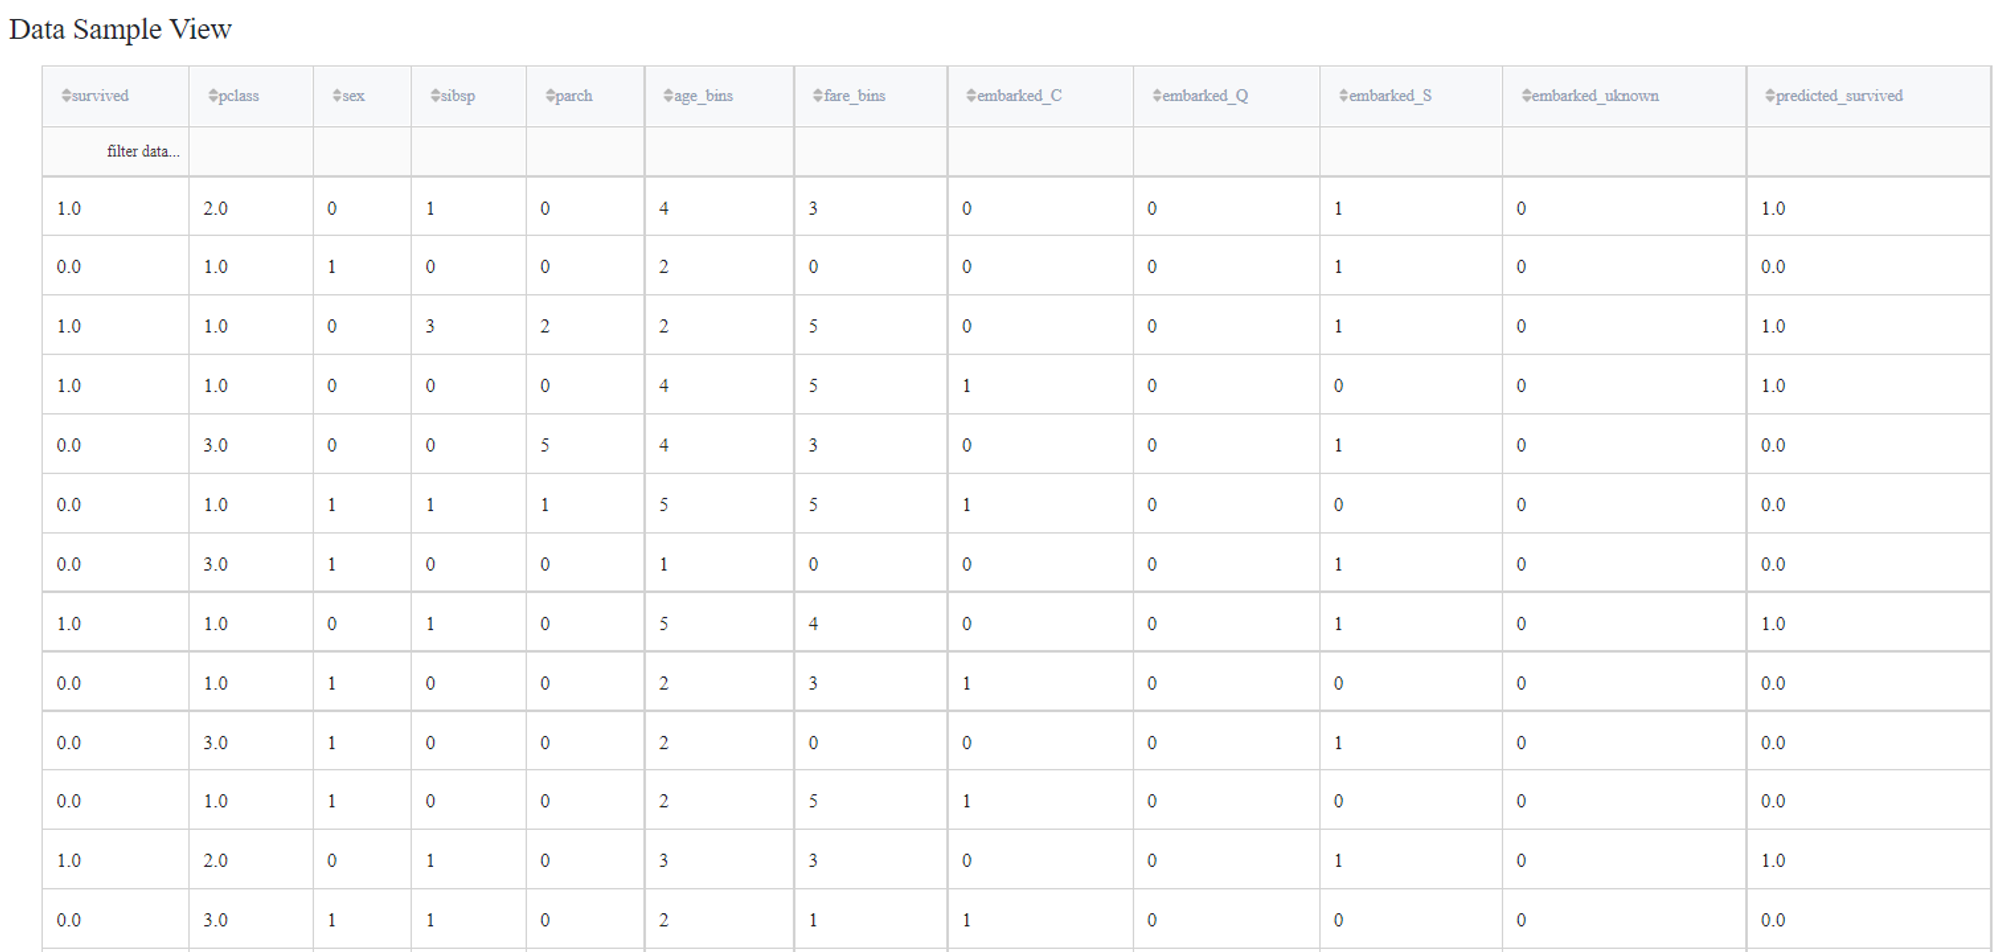
Note, that we can also extract the predictions from the output table of the brick Predict - all derived prediction values are stored in the new column predicted_survived: