General information
Brick provides a possibility to group rows that have the same values in conjunction with aggregate functions to produce a summary dataset.
Description
Brick Location
Bricks → Data Manipulation → Transform → Aggregate Data
Bricks → Analytics → Data Insights → Aggregate Data
Bricks → Use Cases → Demand Forecasting → Data Processing → Aggregate Data
Brick Parameters
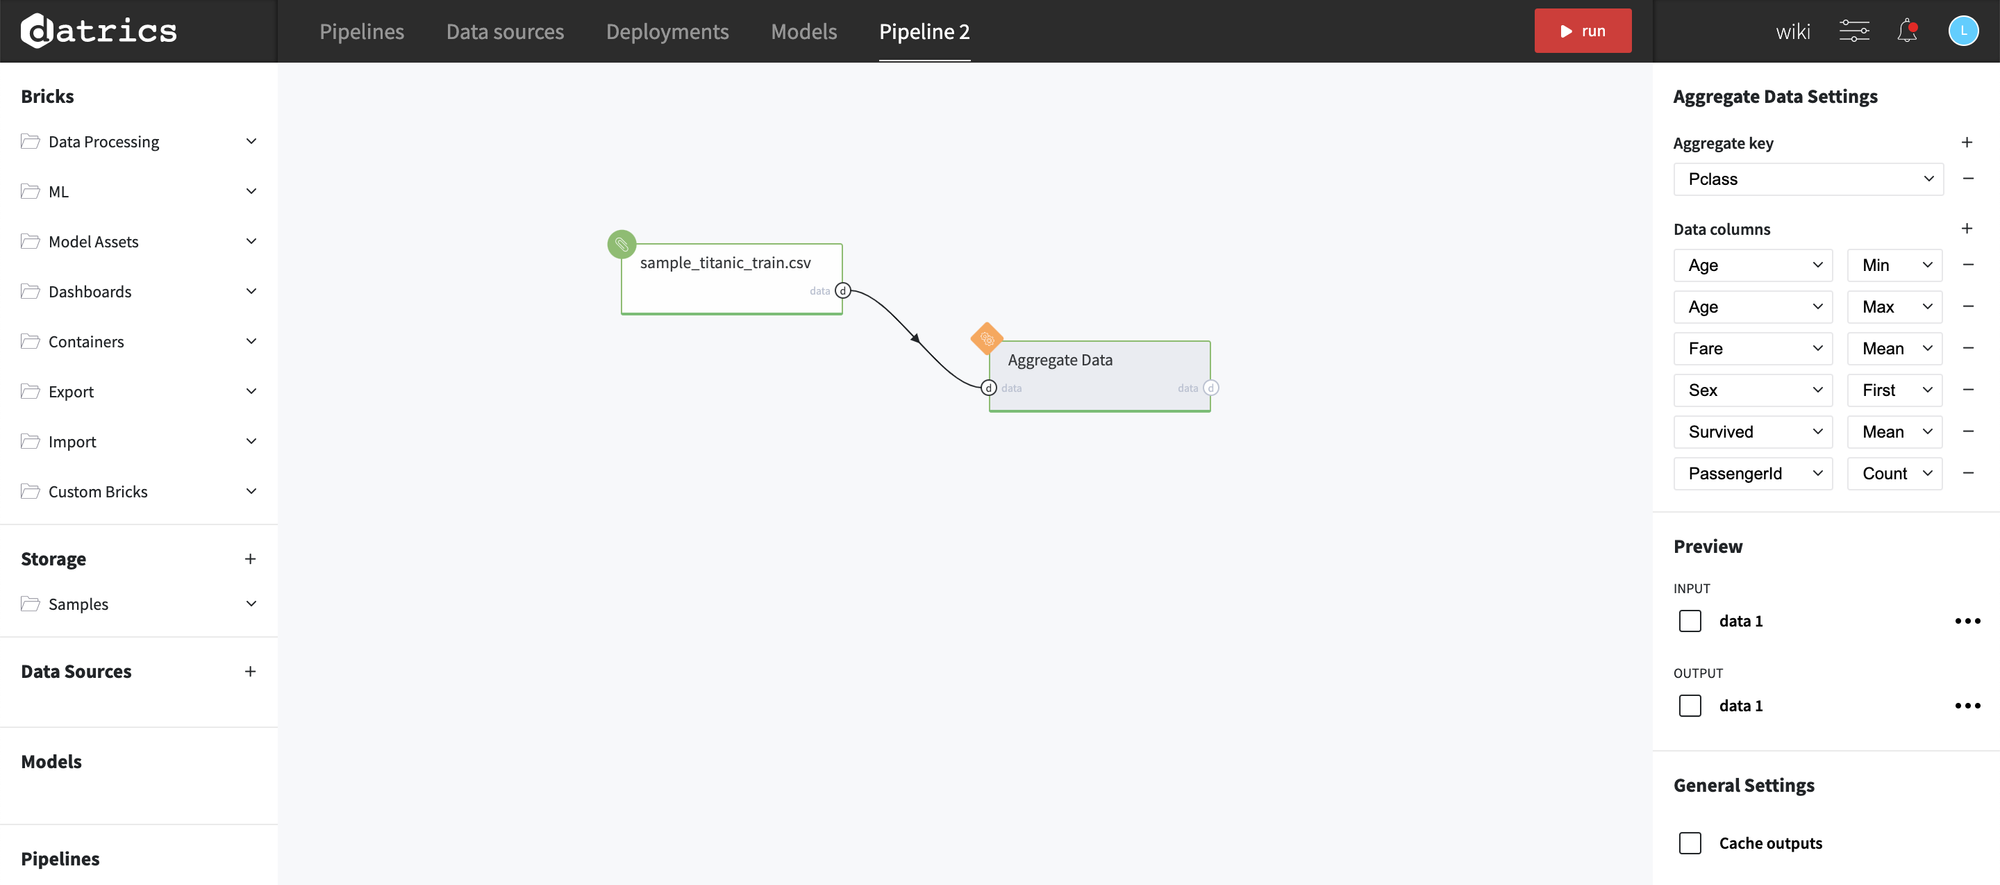
- Aggregate key
Column from the input data used to group rows that have the same values. It is possible to choose several columns for grouping by clicking on the '+' button in the brick settings.
- Data columns
- If the selected column is of string data type - a function that can be applied are count, first, and last
- If the selected column is of numeric data type - a function that can be applied are count, min, max, mean, sum, and std
- If the selected column is of DateTime data type - a function that can be applied are count, min, max, first, and last.
Column and function to apply to that column on an entire group of rows and then return one row of values for each group. It is possible to choose several columns-function pairs by clicking on the '+' button in the brick settings.
Main restrictions here:
Brick Inputs/Outputs
- Inputs
Brick takes the dataset.
- Outputs
Brick produces the result as a new dataset, with the column or columns that were selected for grouping and a column for each column-function aggregation pair.
Example of usage
Let's consider the dataset from the binary classification problem . The general information about the dataset is represented below:
- passengerid (category) - ID of passenger
- name (category) - Passenger's name
- pclass (category) - Ticket class
- sex (category) - Gender
- age (numeric) - Age in years
- sibsp (numeric) - Number of siblings / spouses aboard the Titanic
- parch (category) - Number of parents / children aboard the Titanic
- ticket (category) - Ticket number
- fare (numeric) - Passenger fare
- cabin (category) - Cabin number
- embarked (category) - Port of Embarkation
- survived (boolean) - True/False
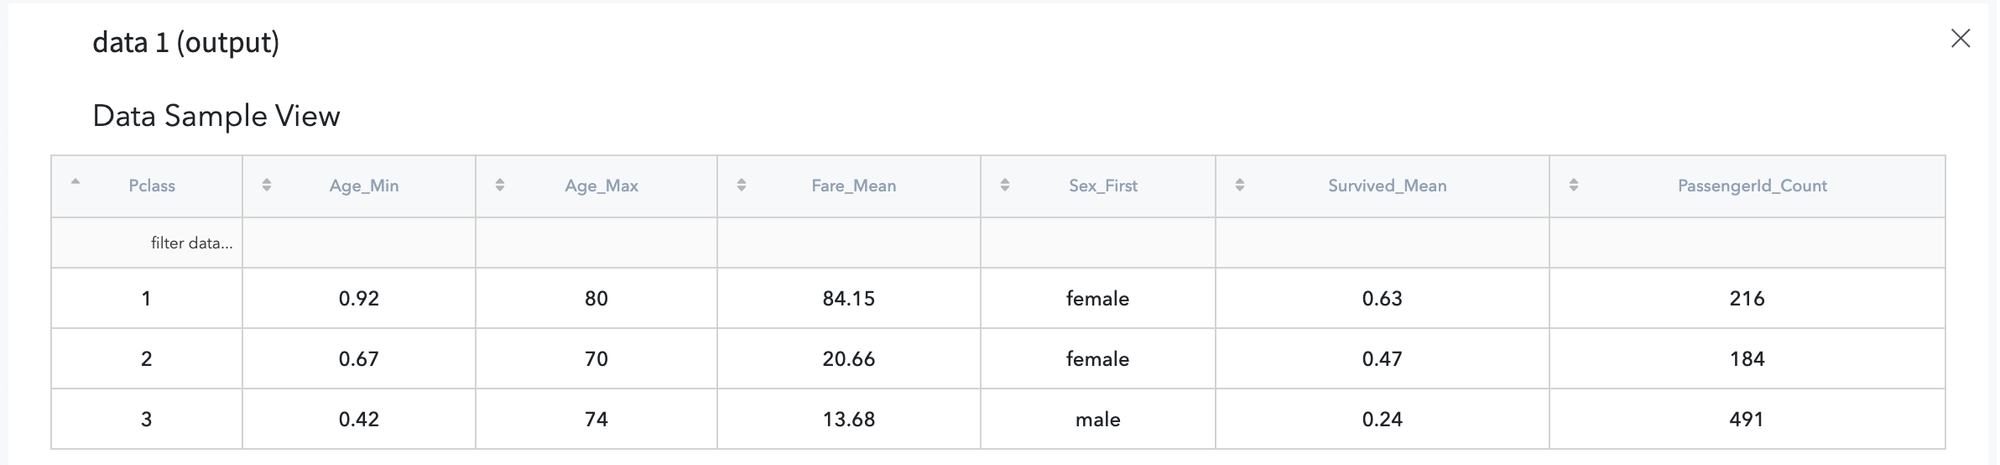
Lets aggregate by Ticket Class ("Pclass") to check how differs data within this groups:
The resulted dataset with new columns Age_Min, Age_Max, Fare_Mean, Sex_First, Survived_Mean, and PassengerId_Count is shown below: