General information
Brick provides a powerful interactive interface for the numerical variable's quantization with respect to the binary target variable. The quality of the binning is assessed considering the predictive power of the resulted categorical variable (please, see for the details) so that guarantees that the categorization is performed the best way.
Binning dashboard supports four binning strategies:
- Quantile-based auto-binning. The resulted categories are the results of the dividing of the processed data into n equal-sized bins
- Range-based auto-binning. The resulted categories are the results of the dividing of the processed data into n equal-sized ranges.
- IV optimal auto binning. The obtained bins provide the best Information Value of the resulted categorical variable. Optimal bins are gotten via tree-based binning with the optimization of the model parameters with respect to the Information Value of the resulted categories. The basic idea of the tree-based approach is to quantize the analyzed variable via tuning the decision tree that inference the binary target variable from numerical predictors. The final decision rules are interpreted as a binning procedure.
- Manual binning. User can adjust the auto-binning results via manual manipulation with the obtained bins - their union, splitting, renaming, etc. The quality of bins also can be analysed via Information Value assessment.
Description
Brick Location
Bricks → Data Manipulation → Transform → Binning
Bricks → Analytics → Feature Engineering → Binning
Bricks → Use Cases → Credit Scoring → Feature Engineering → Binning
Brick Parameters
- Target
A binary variable is used as a target variable in a binary classification problem. The information value of the separate predictors is calculated with respect to the specified target. The target variable should be present in the input dataset and take two values - (0, 1).
Target variable is optional and is used for the binning quality assessment.
- Default number of bins
The default number of bins that is used for the auto-binning at the first run.
- Columns to binning (configured via dashboard)
User may configure the list of numerical variables that have to be categorized via selecting/unselecting the available columns on the Binning Dashboard
- Binning Rules (configured via dashboard)
Binning rules are created after the binning configuration and can be adjusted via Binning dashboard
Default Parameters
At the first run binning is performed with the initial settings - for all numerical variables quantile-based auto-binning with n=5 is applied.
Brick Inputs/Outputs
- Inputs
Brick takes the dataset, which contains the binary target variable and independent predictors
- Outputs
Brick produces the dataset with extra columns - the results go the numerical variables binning
Dashboard Description
.jpg?table=block&id=5f92bd97-f8fd-41b9-aec6-9aec7fc00cb4&cache=v2)
- Target variable selection. This parameter is optional, but it should be used if the user wants to assess the quality of the categorized variables and the separate bins considering the binary target variable.
- The default number of bins that is used for the binning initializing.
- "Variable for the binning" checkbox. If selected - the corresponded variable will be processed, categorized, and the extra column named <variable>_bins will be produced to the output dataset.
- Numerical variable info-box. This box contains the information about a variable, including bins quality assessment:
- Variable name
- "Variable for the binning" checkbox
- Bins list
- Categorical variable predictive power
- Numerical variable histogram with the bins boundaries visualization
- Auto-binning parameters. There are three auto-binning methods are available, Quantile and Rage-based methods are configuring with the number of the expected categories. In order to get the result of the auto-categorization, the button "Generate Bins" should be pressed. Note, the auto-binning is available for the selected variables only
The "Remove outliers" checkbox defines the histogram view (either histogram includes the outliers or not). Also, if "Remove outliers" is turned off, auto-bins will be generated for all data, including outliers.
- Manual binning form. The table contains the result of both auto and manual binning:
- Bin Name - the name of the category that will be used in the categorised variable
- X0 - the low boundary of the bin
- X1 - the high boundary of the bin
- WoE - Weight of Evidence of the category
- IV - Information Value of the category
- Brackets (square and parentheses) - define if the margins will be included in the corresponded bin or not. For instance, if the bing "child" of the variable "Age" is described via range [0, 12), it means that to the category "child" could be referred the person younger than 12 years old only.
In manual mode, the user has the possibility to unite and/or split the bins and rename the resulting categories. For applying these settings, the "Apply" button should be pressed. Note, the manual binning is available for the selected variables only.
The button "Save" allows saving the manual rules so that they will be applied after configuring all columns
"Reset" button allows to reset the variable binning to the default settings.
Example of usage
Let's consider the binary classification problem . The inverse target variable takes two values - survived (0) - good or non-event case / not-survived (1) - bad or event case. The general information about predictors is represented below:
- passengerid (category) - ID of passenger
- name (category) - Passenger's name
- pclass (category) - Ticket class
- sex (category) - Gender
- age (numeric) - Age in years
- sibsp (numeric) - Number of siblings / spouses aboard the Titanic
- parch (category) - Number of parents / children aboard the Titanic
- ticket (category) - Ticket number
- fare (numeric) - Passenger fare
- cabin (category) - Cabin number
- embarked (category) - Port of Embarkation
Most of the predictors are categorical or take a few unique values, but age and fare - are numerical variables that might be useful to categorize, especially if we are going to create a scoring model that returns Survival Score. In this case, we may put the Binning brick in the pipeline and get the categorical feature-vector for further modeling.
Let's create the simple pipeline and configure the Binning brick:
- Create the pipeline with Data Import (titanic.csv), connect the Binning brick, and define the Target Variable (survived)
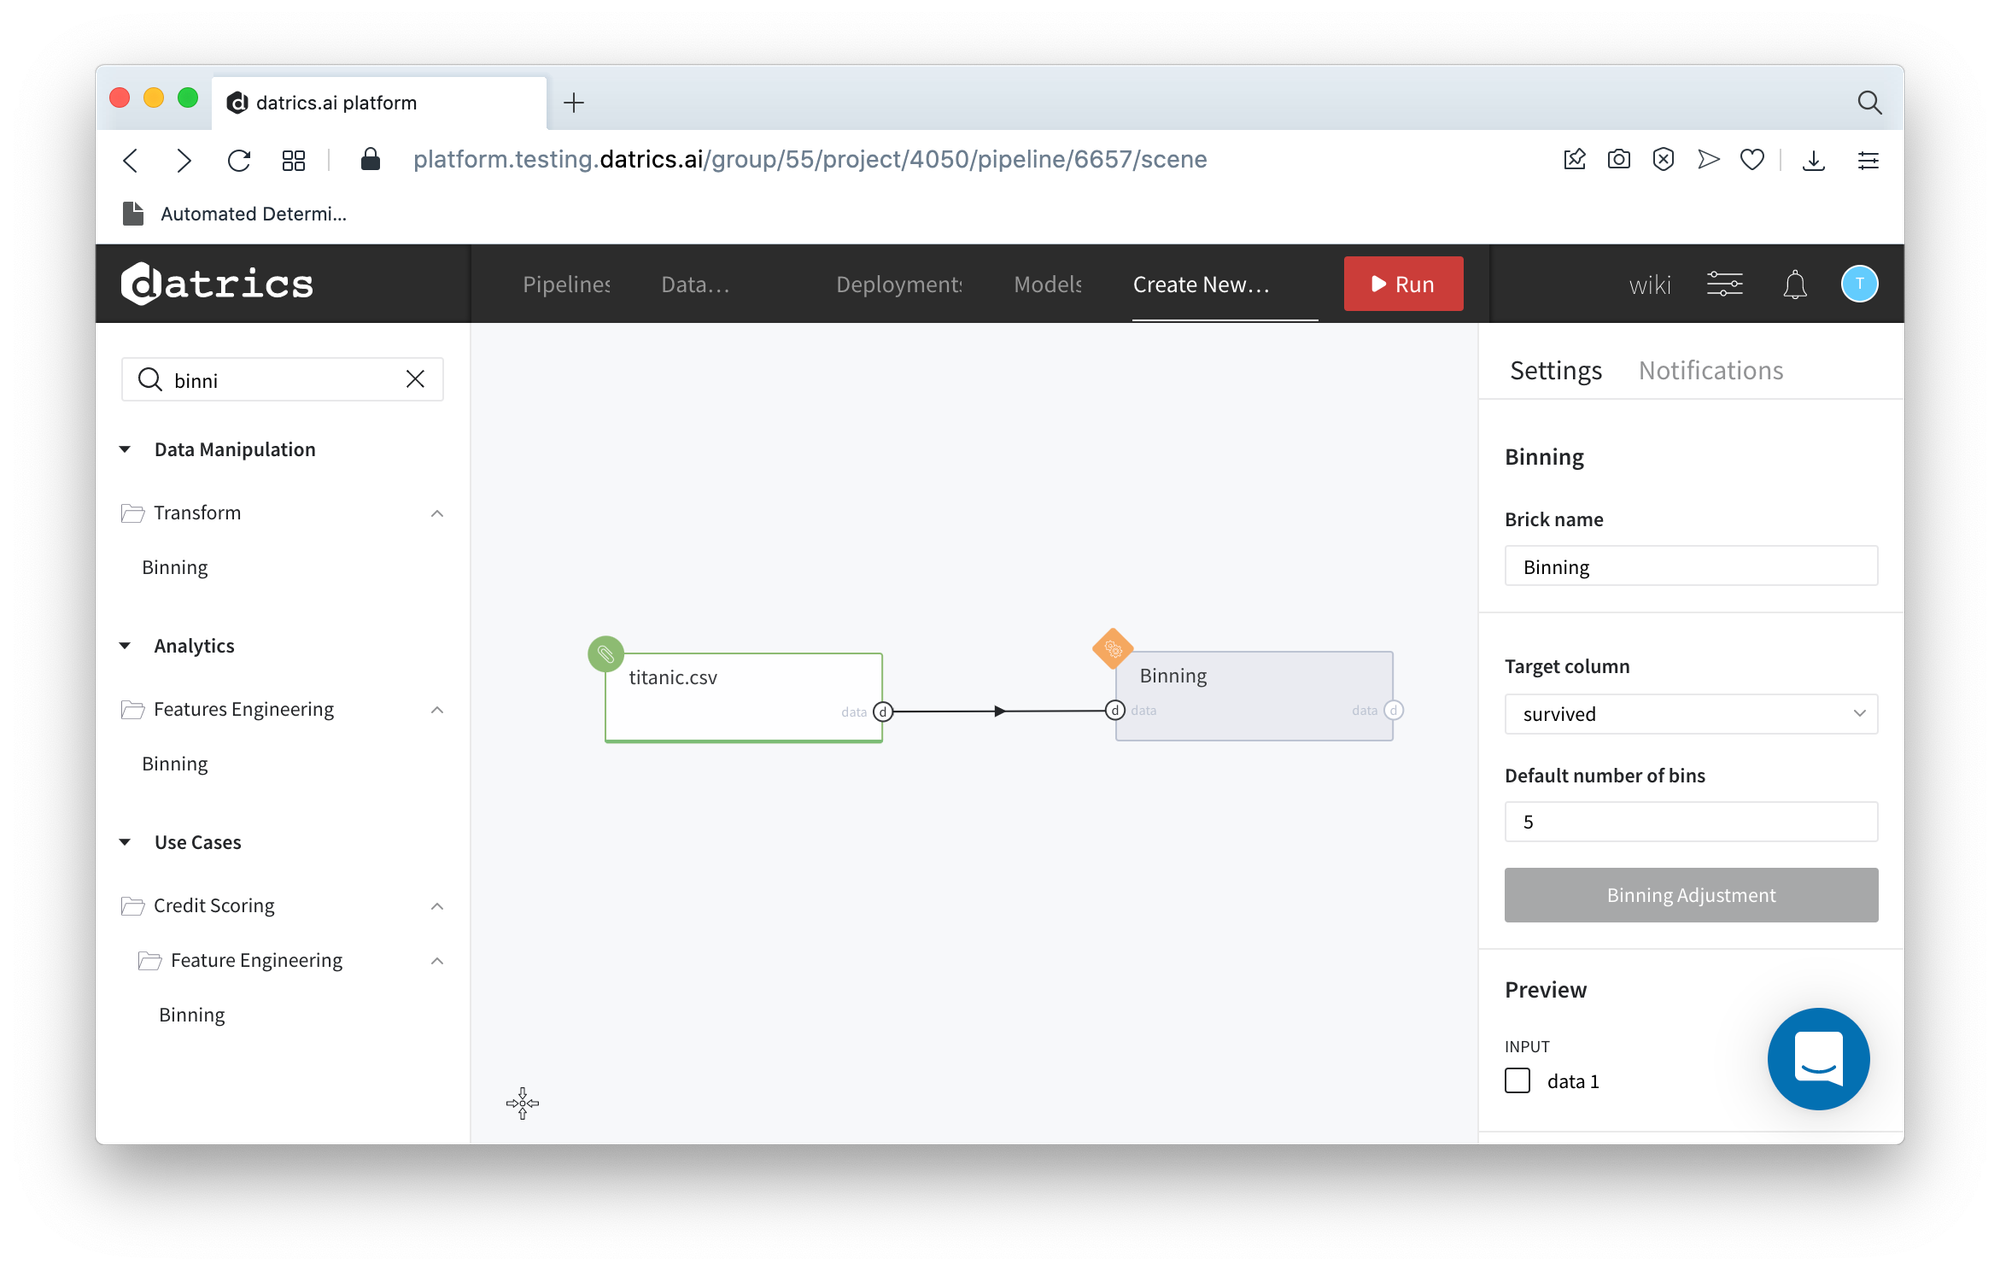
- Run pipeline and open Binning dashboard (press Binning Adjustment)
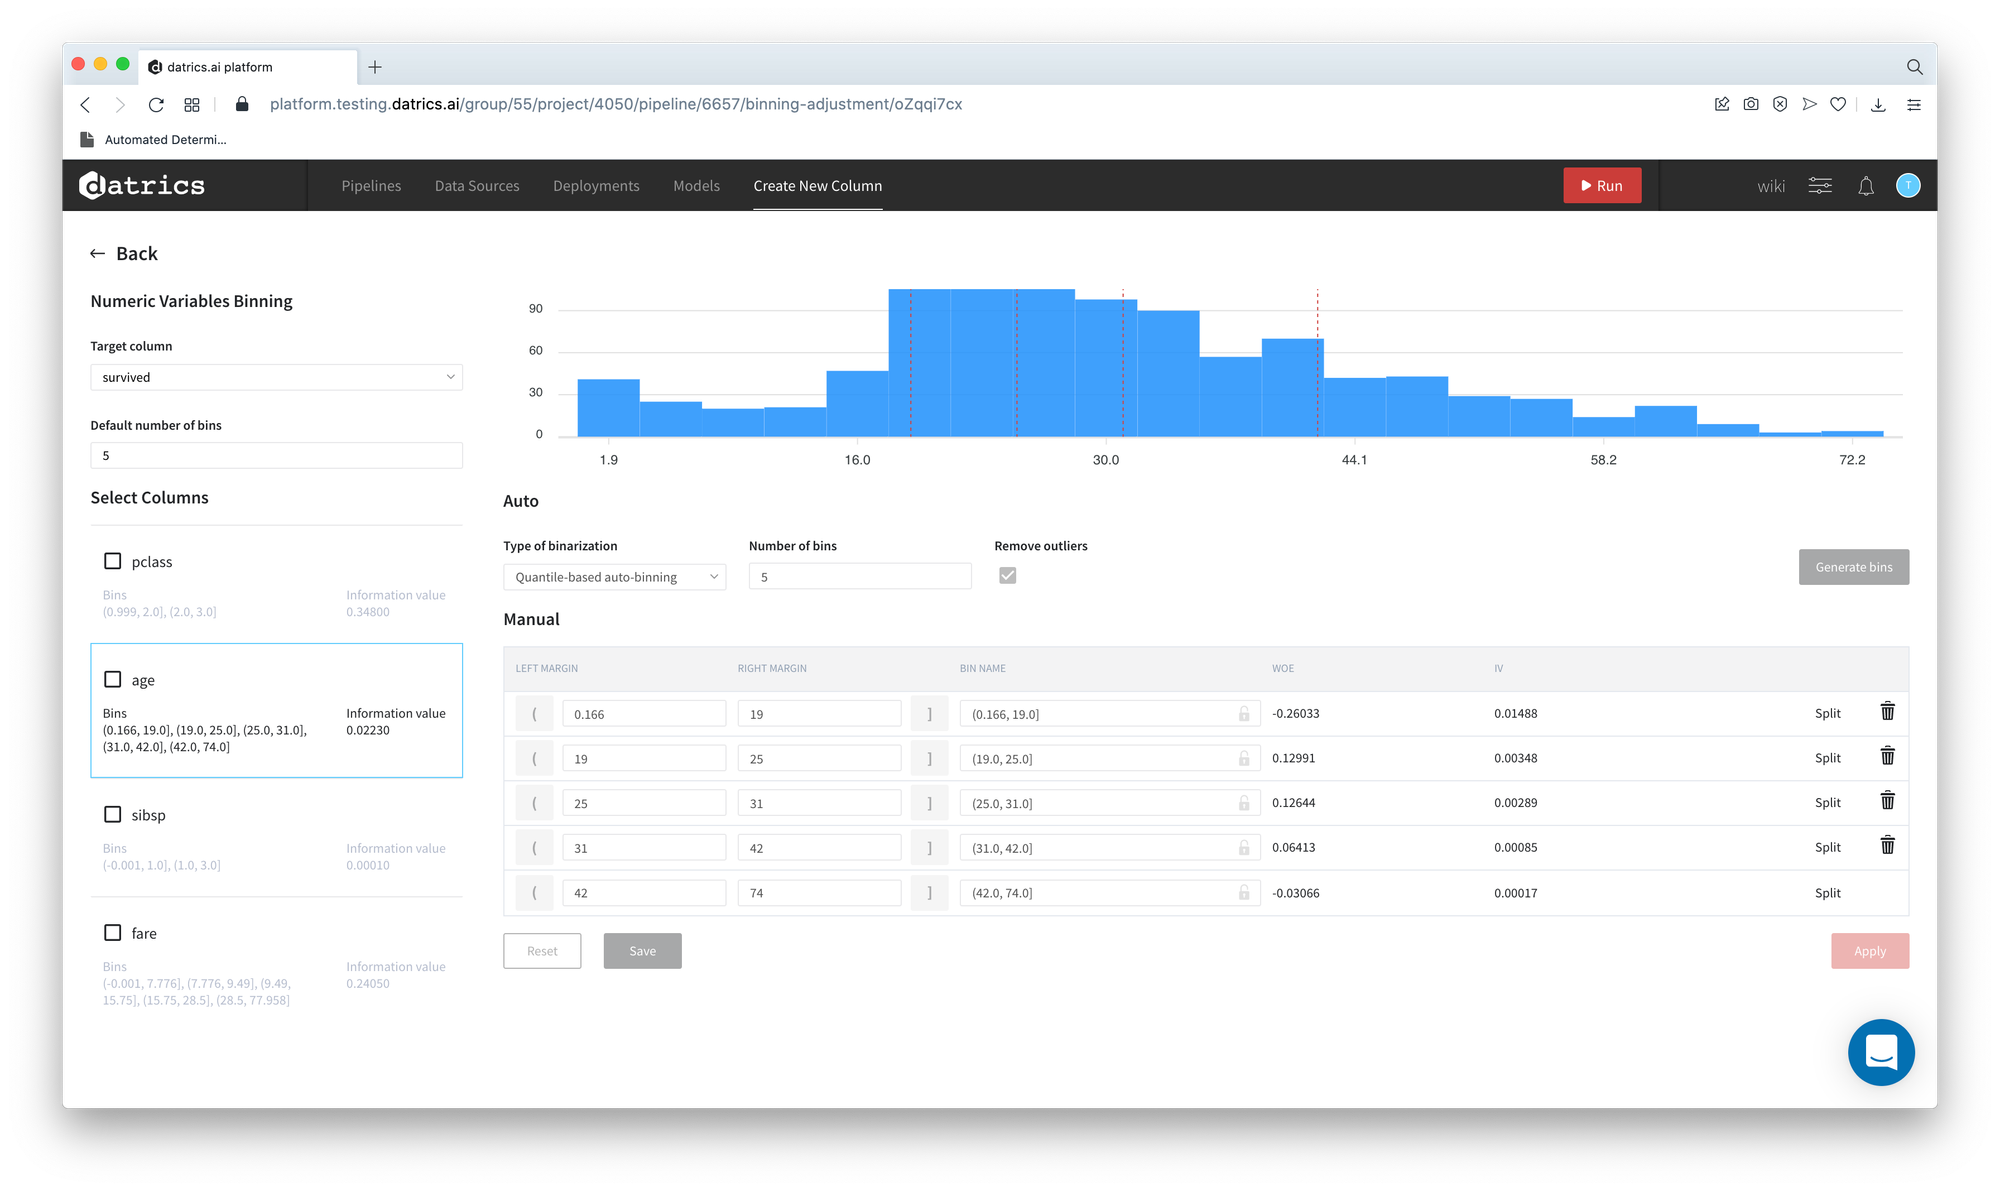
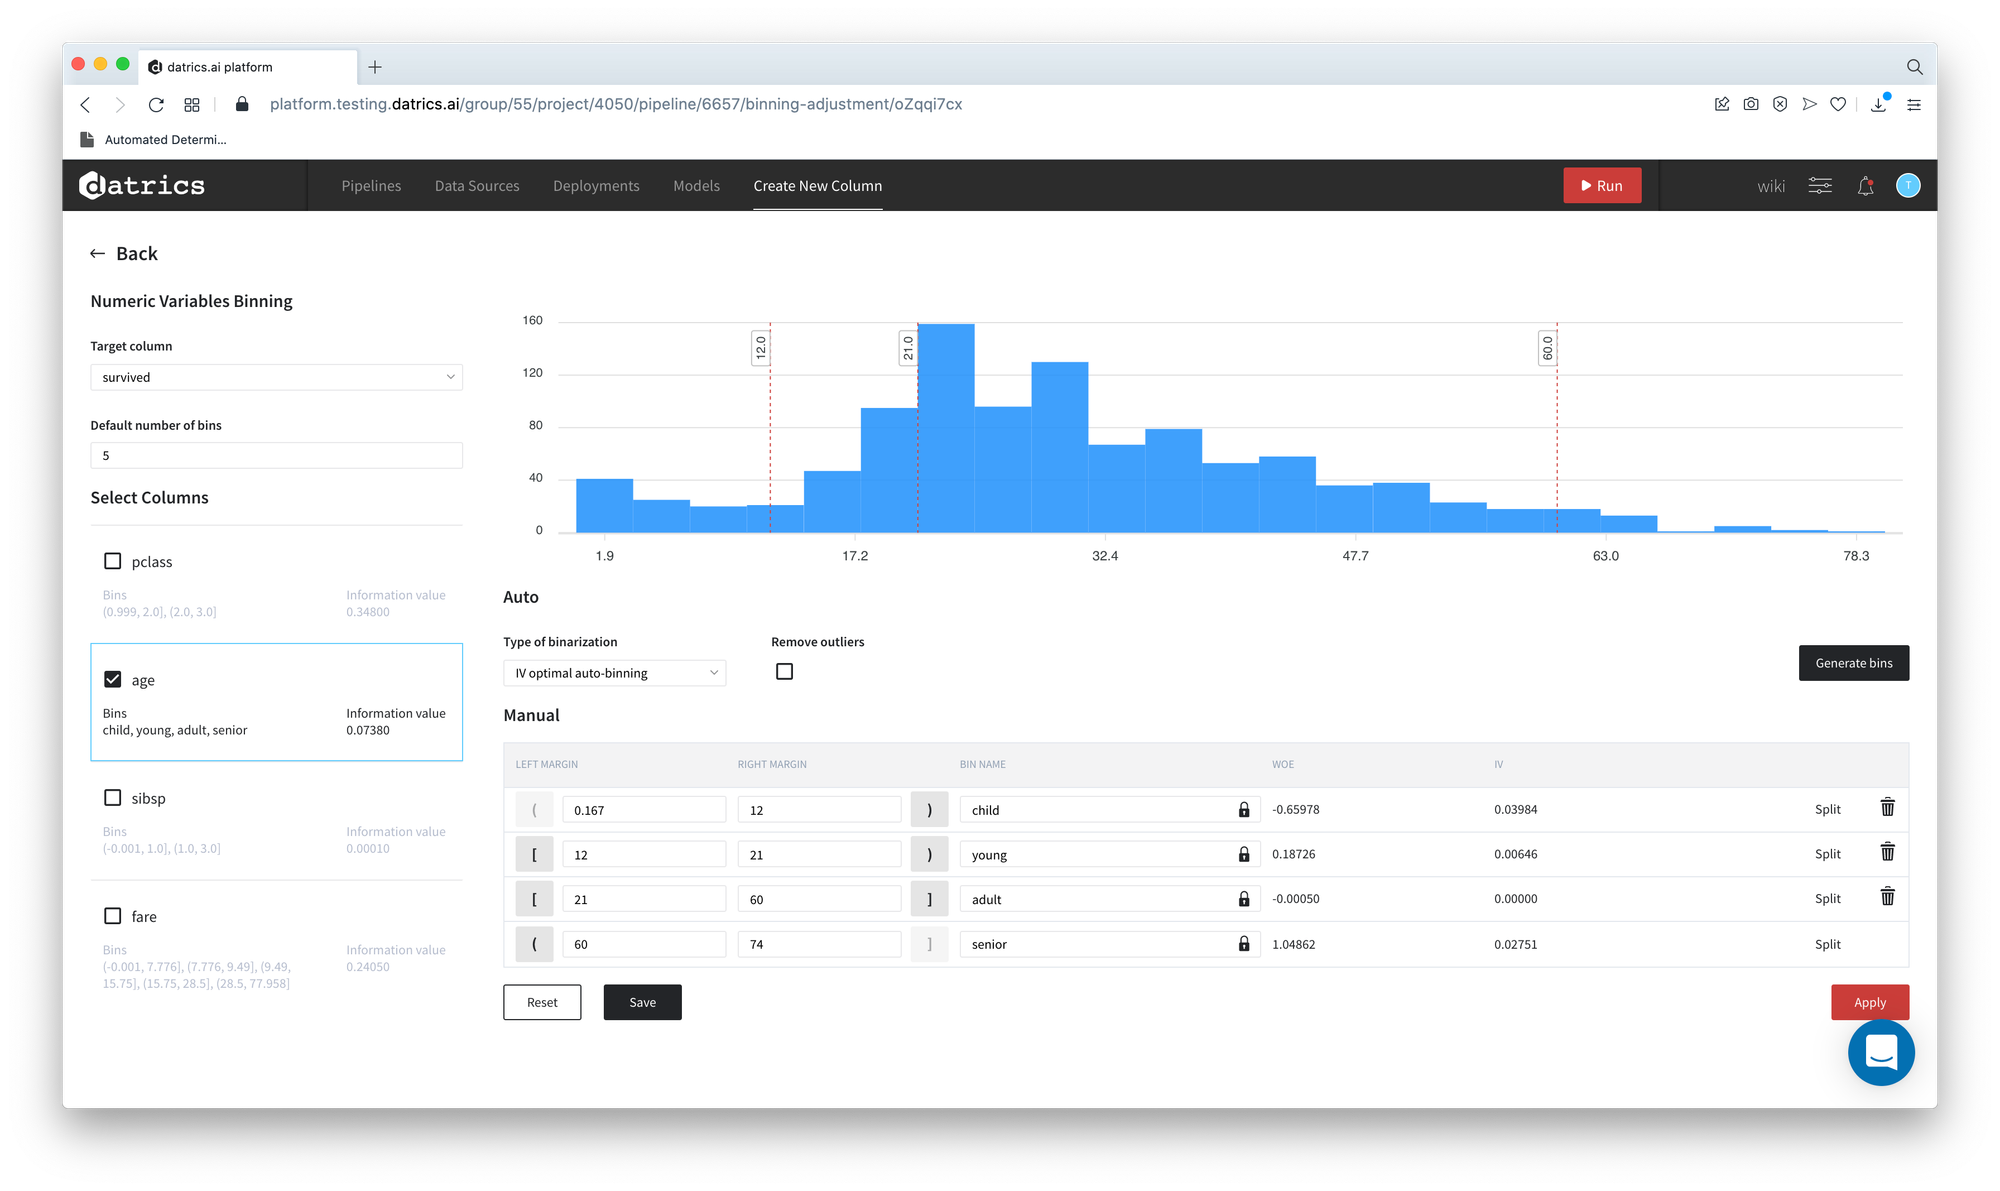
- Now we can adjust the binning and rename the categories. For instance, we would like to get the most optimal categorization from IV prospective for age variable:
- Select and check age column - Button "Generate Bins" becomes available
- Select IV optimal auto binning mode
- Press "Generate Bins"
- You receive the warning "All manual changes for the current column will be replaced with auto-generated bins. Would you like to proceed?". Press "Yes"
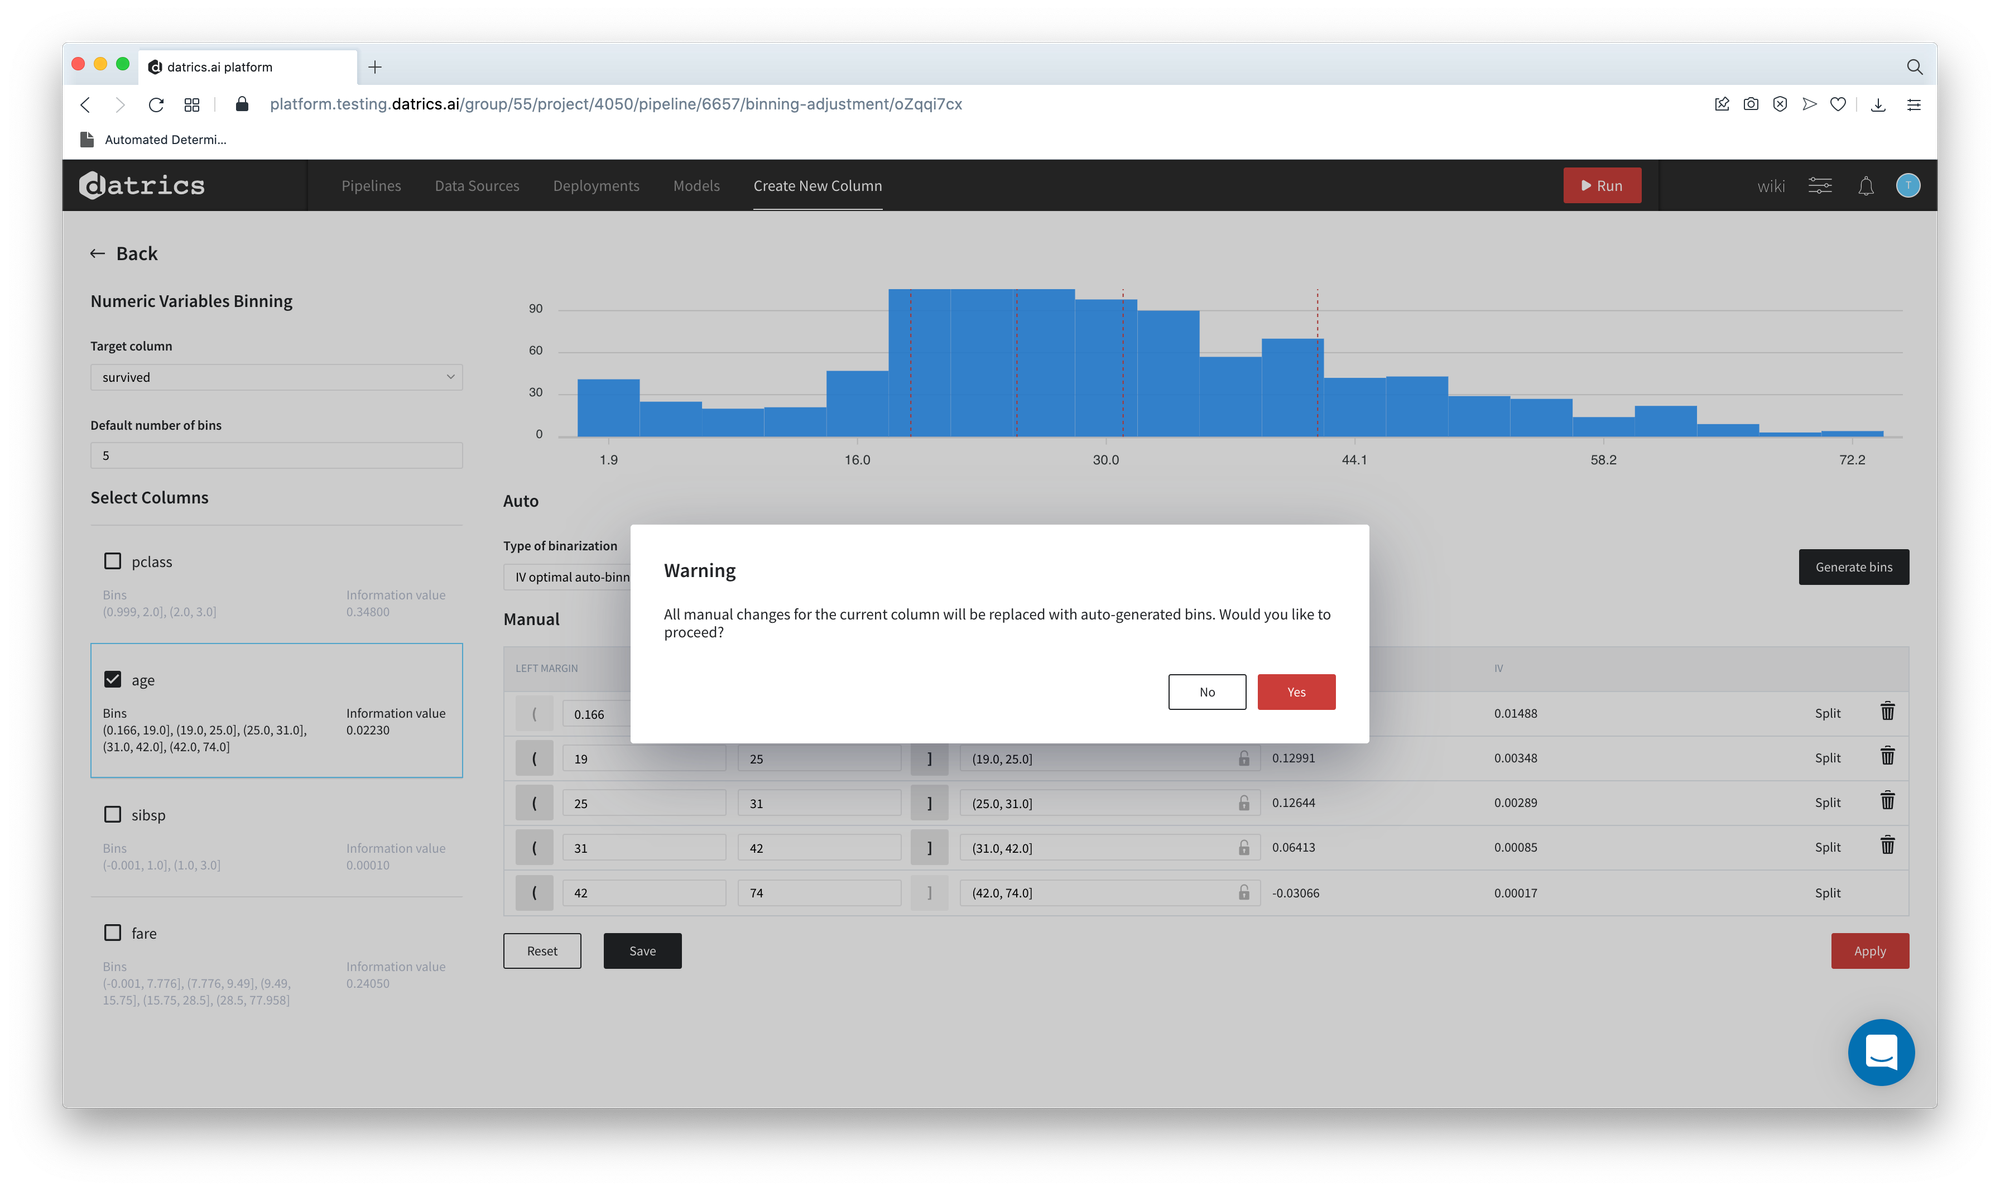
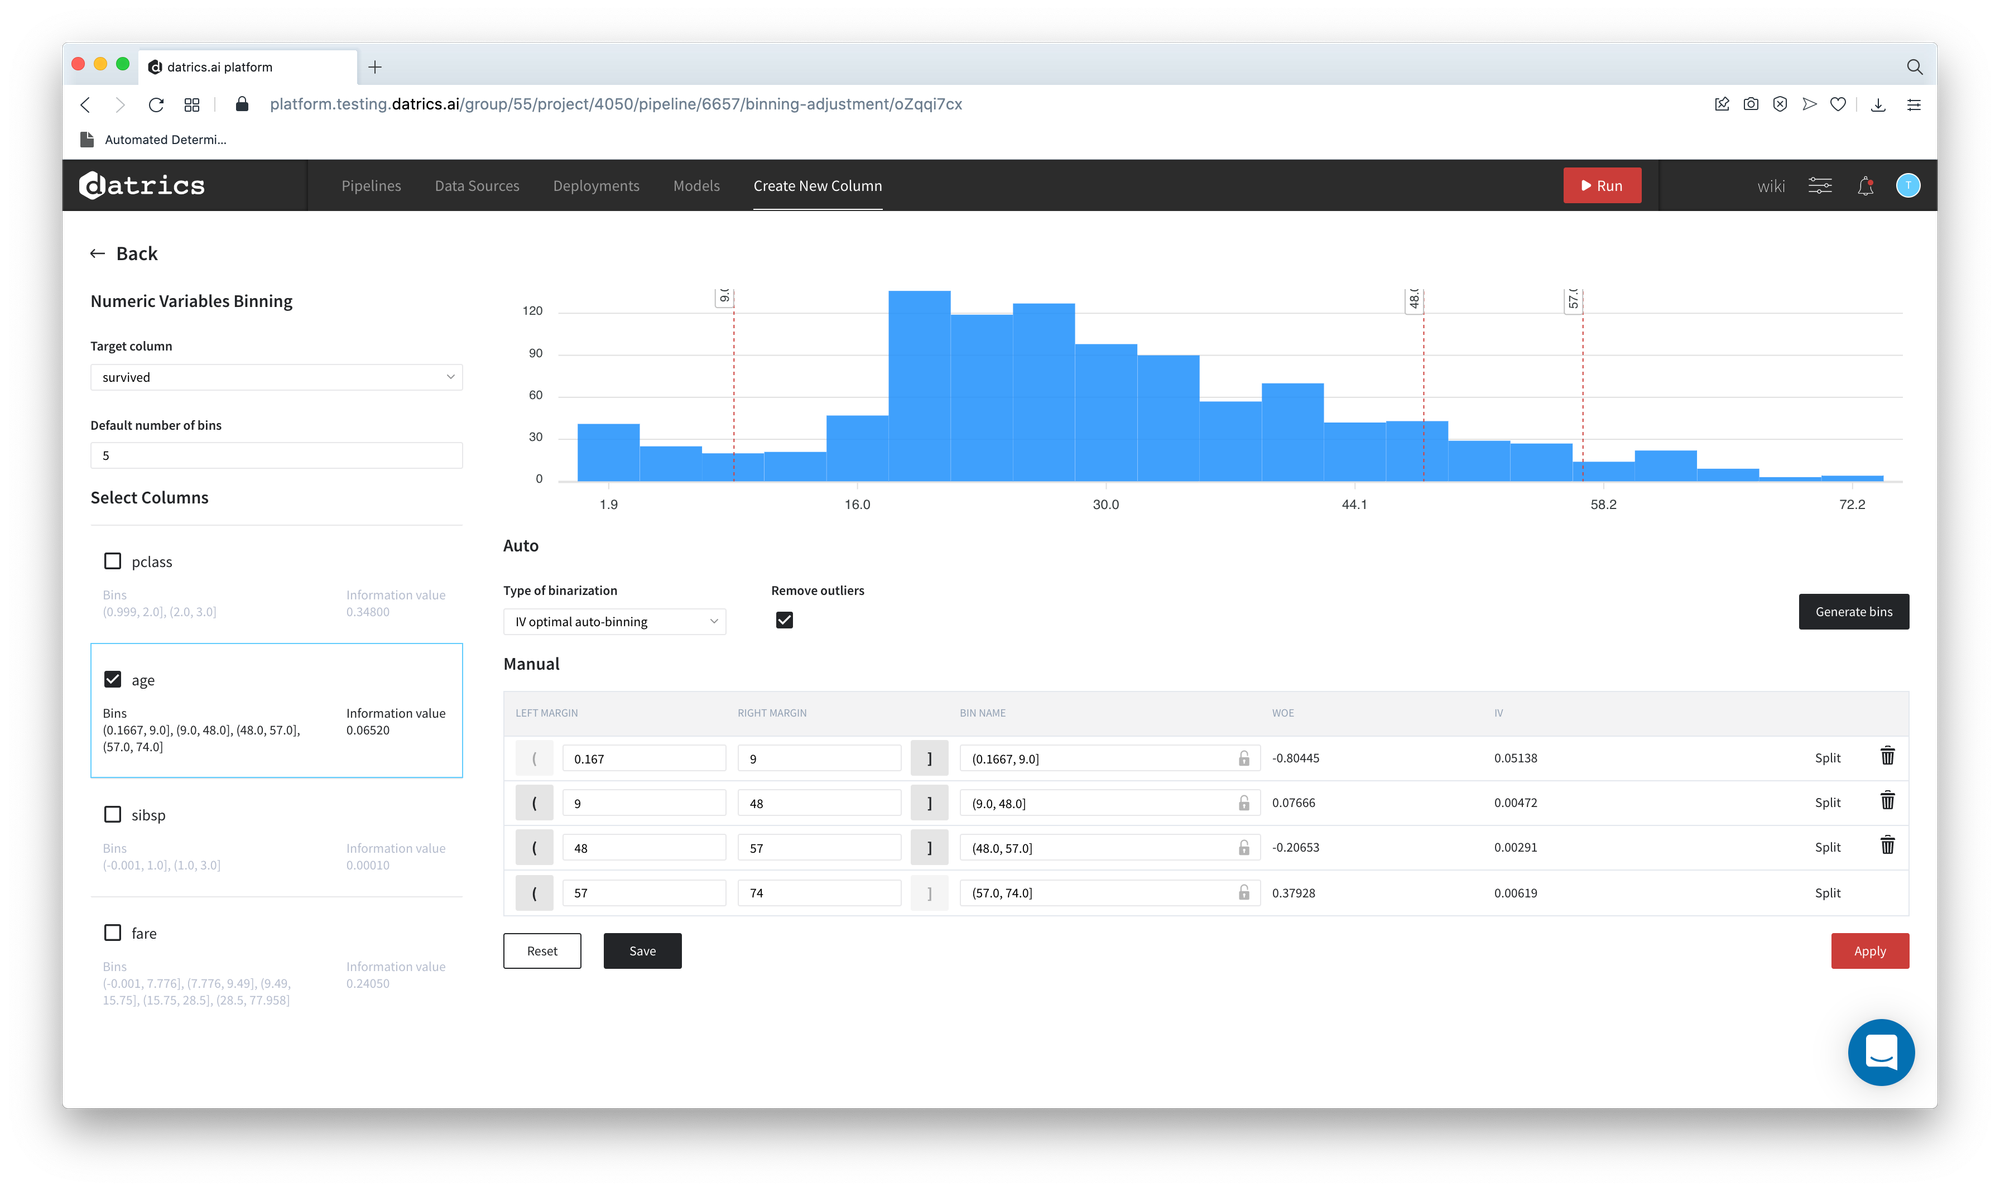
As we can see, the total number of bins is changed - from the default 5 to 4 and the Information Value of the variable Age increases from 0.02 to 0.065.
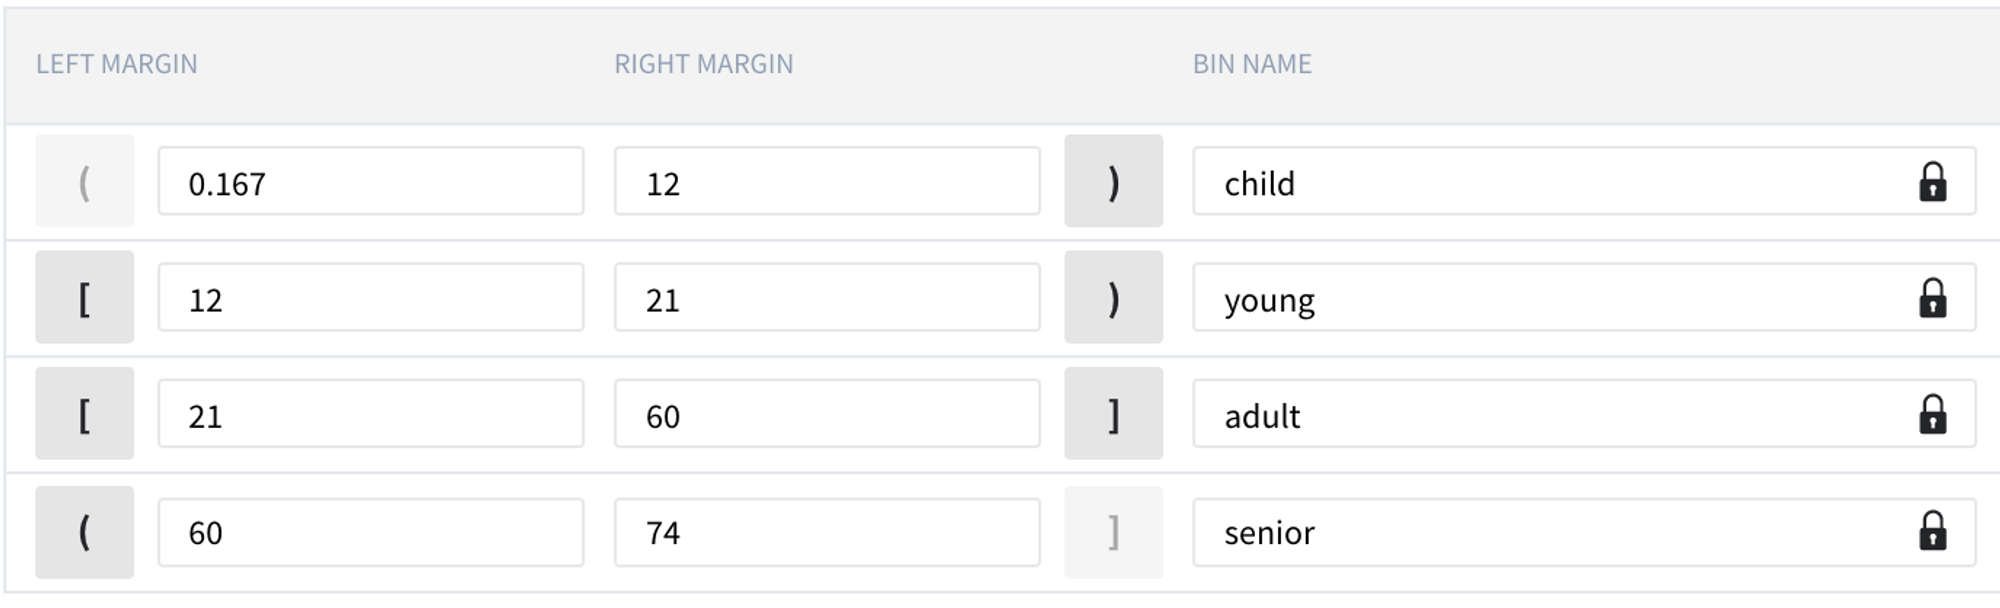
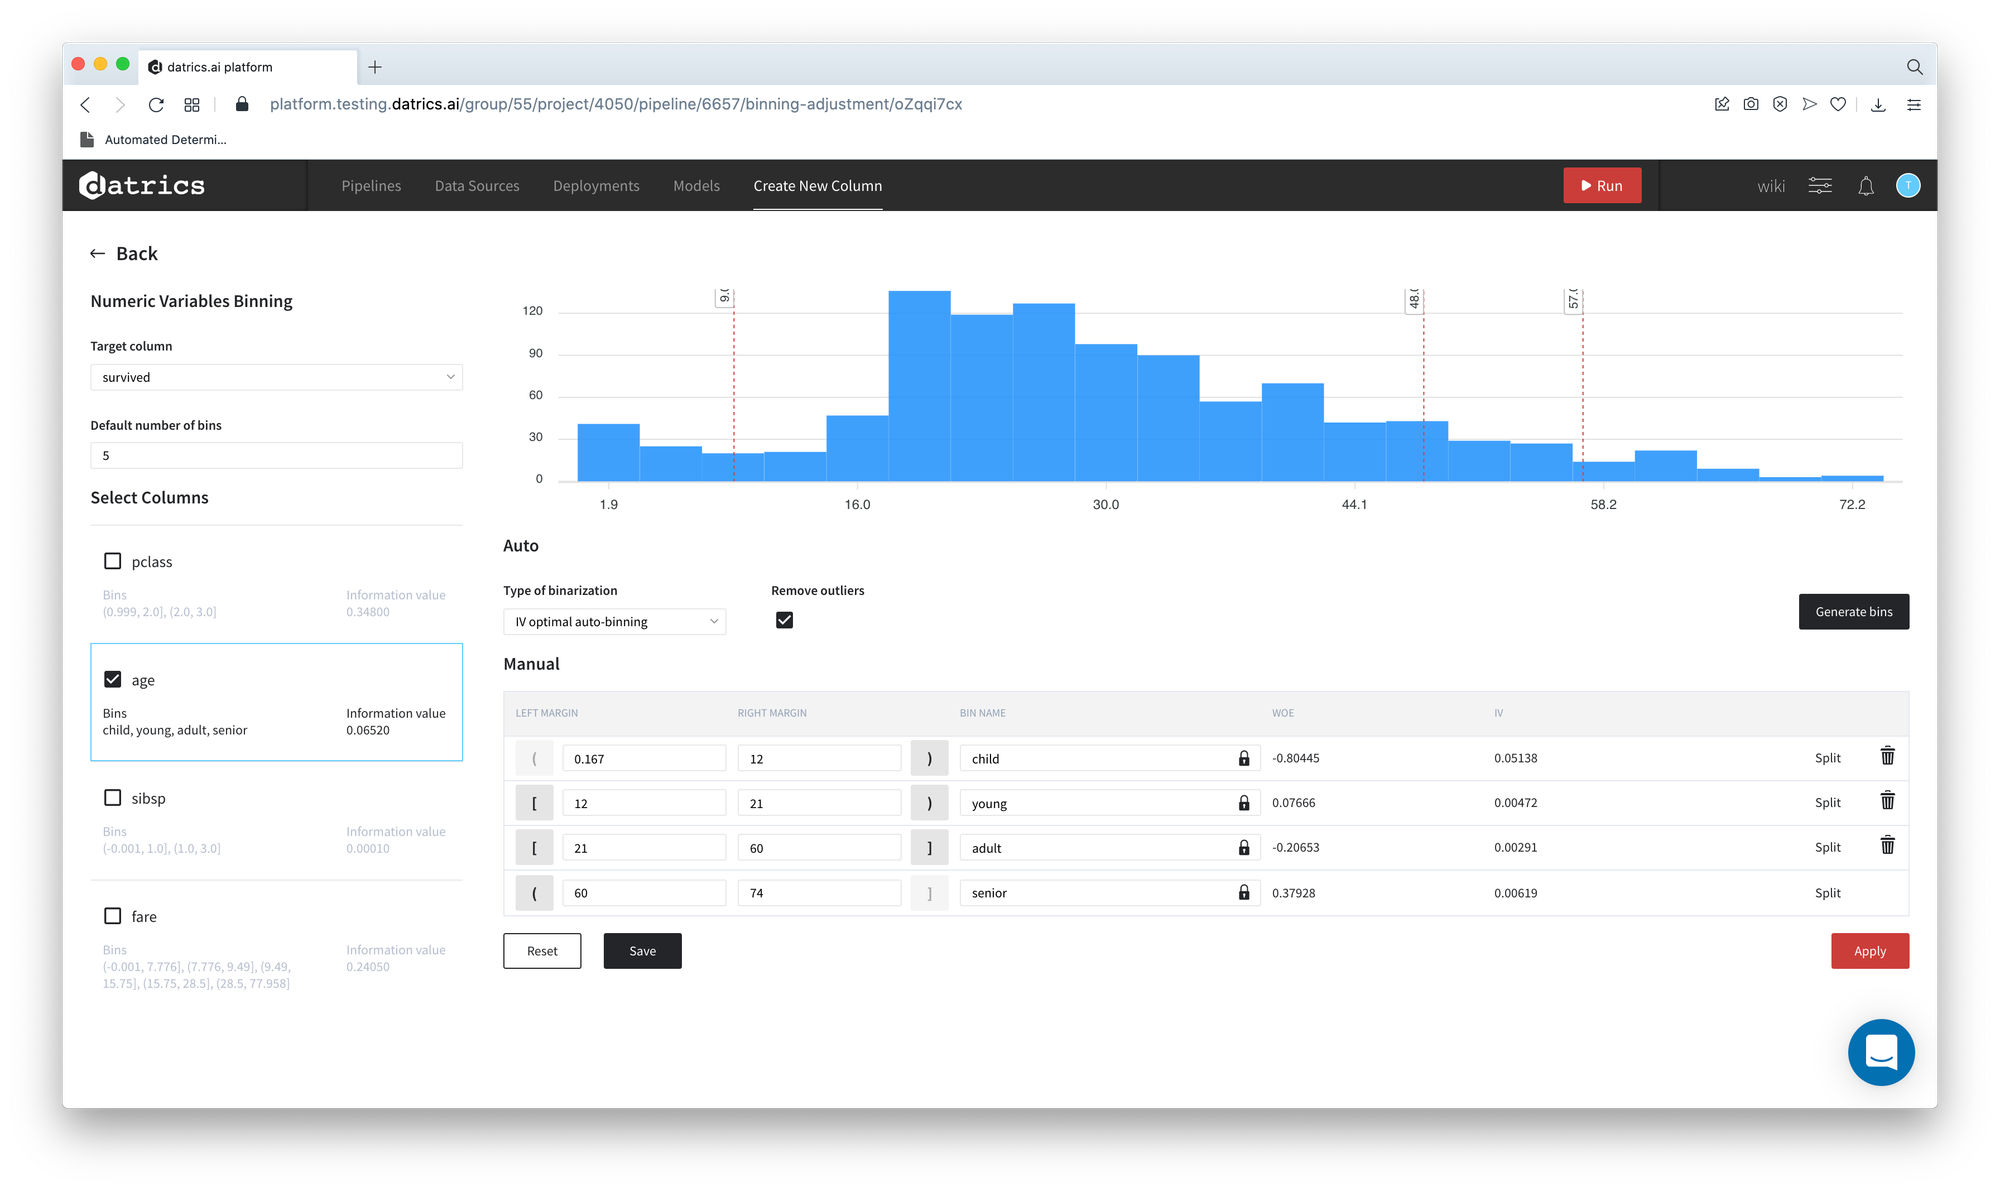
- We may edit the resulting bins with respect to the accepted categories and give the more explicit names to the categories - child, young, adult, senior:
- Edit and rename bins
- Press "Apply"
- Return to the pipeline and open the output dataset previewer
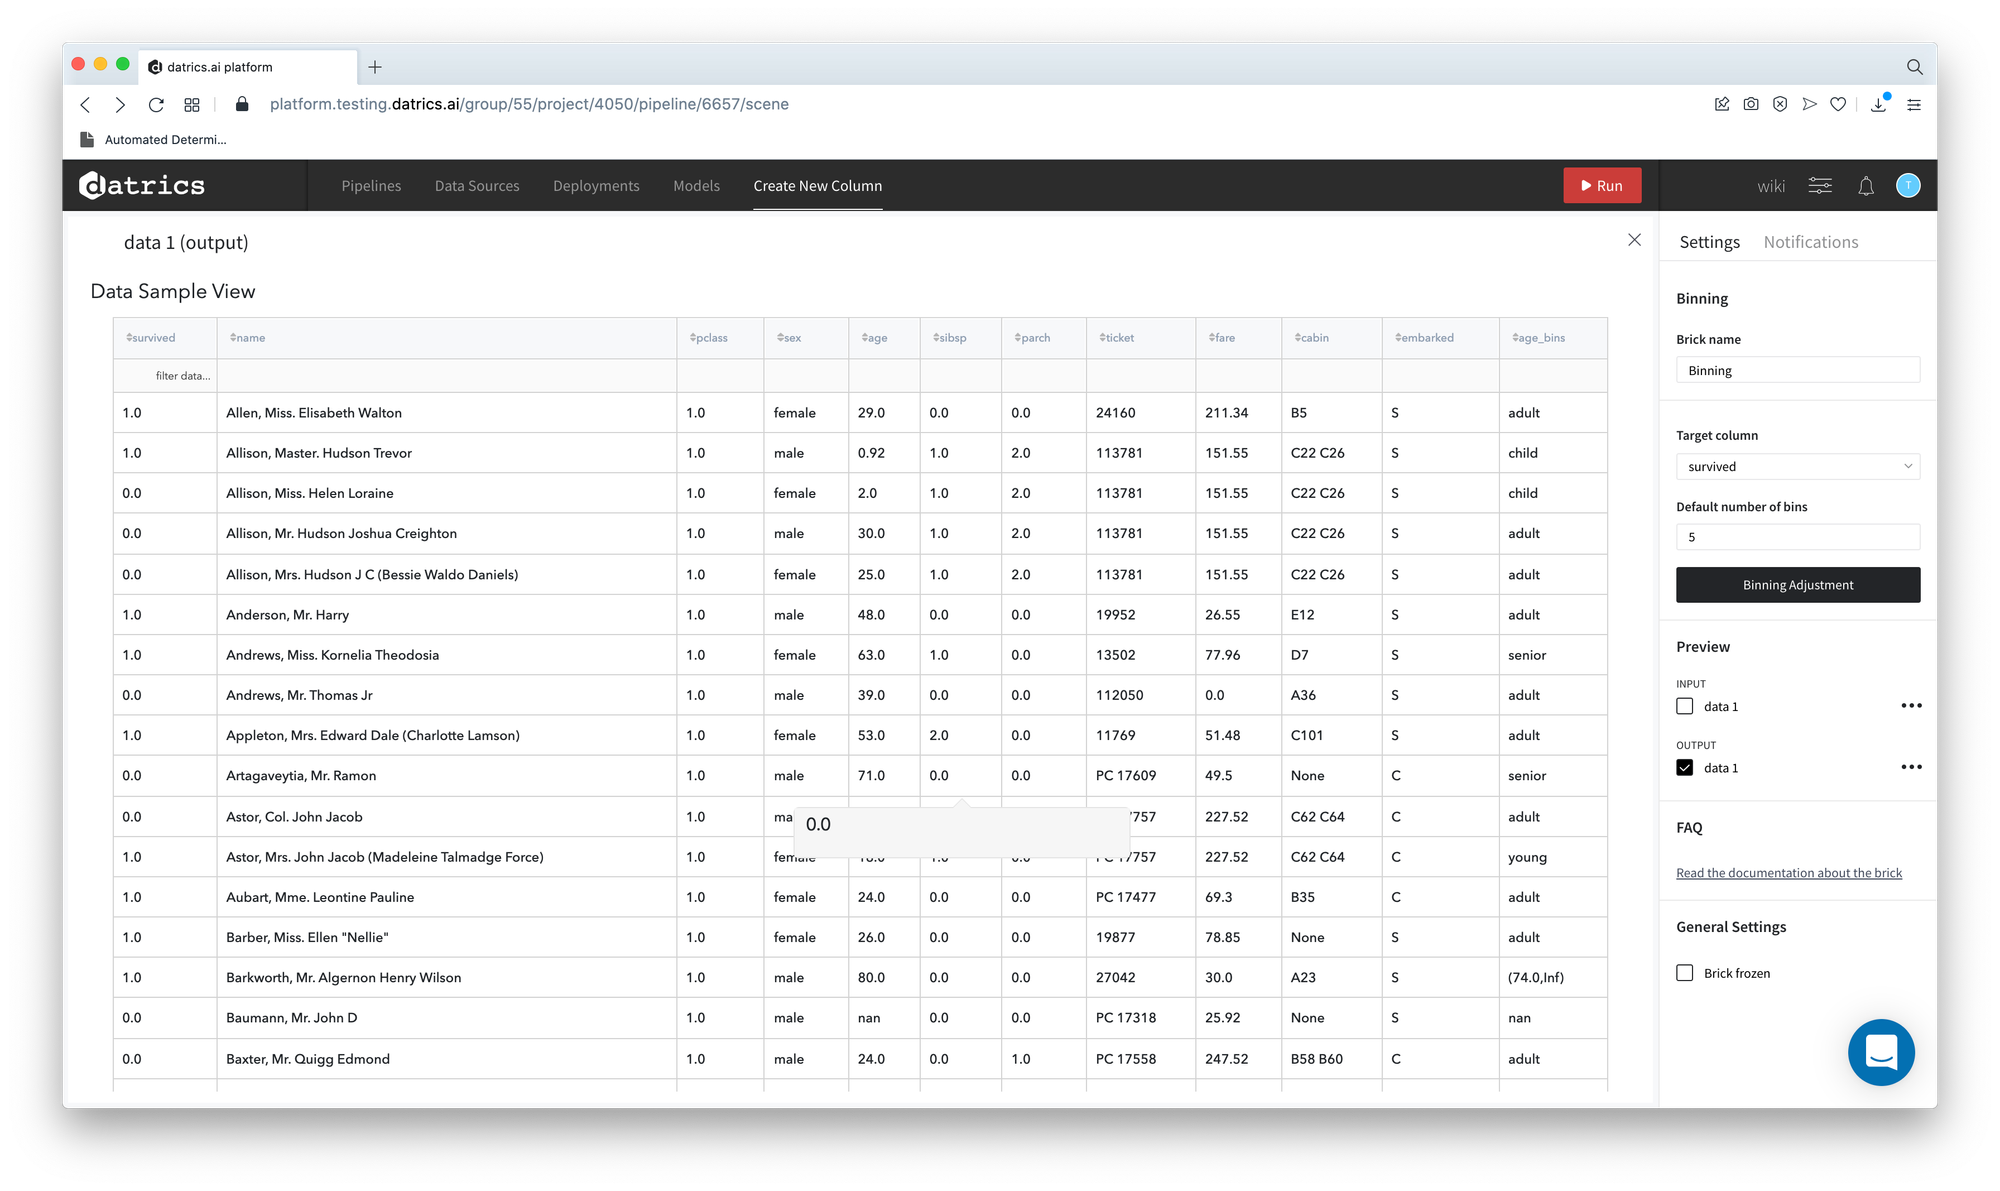
As we can see, the dataset was extended with age_bins column with categories, that are described by the rules above.
Note, that dataset contains the observations with values that were considered as outliers, like, for instance 80 years old. These values are described as new category (max margin, Inf) or (-Inf, min margin) if the value is the low outlier.
- Include the outliers to the manually-defined binsFirst
- Open the Binning dashboard
- First of all, lets add the outliers to the histogram:
- Uncheck the "Remove outliers" flag
- Press "Apply"
- Edit the minimal and maximal margins - set 0 and 150 correspondingly
- Press "Apply"
- Open Data Previewer - now you see, that the 80 years old person is considered a senior
We can see that the histogram has additional bins on the right


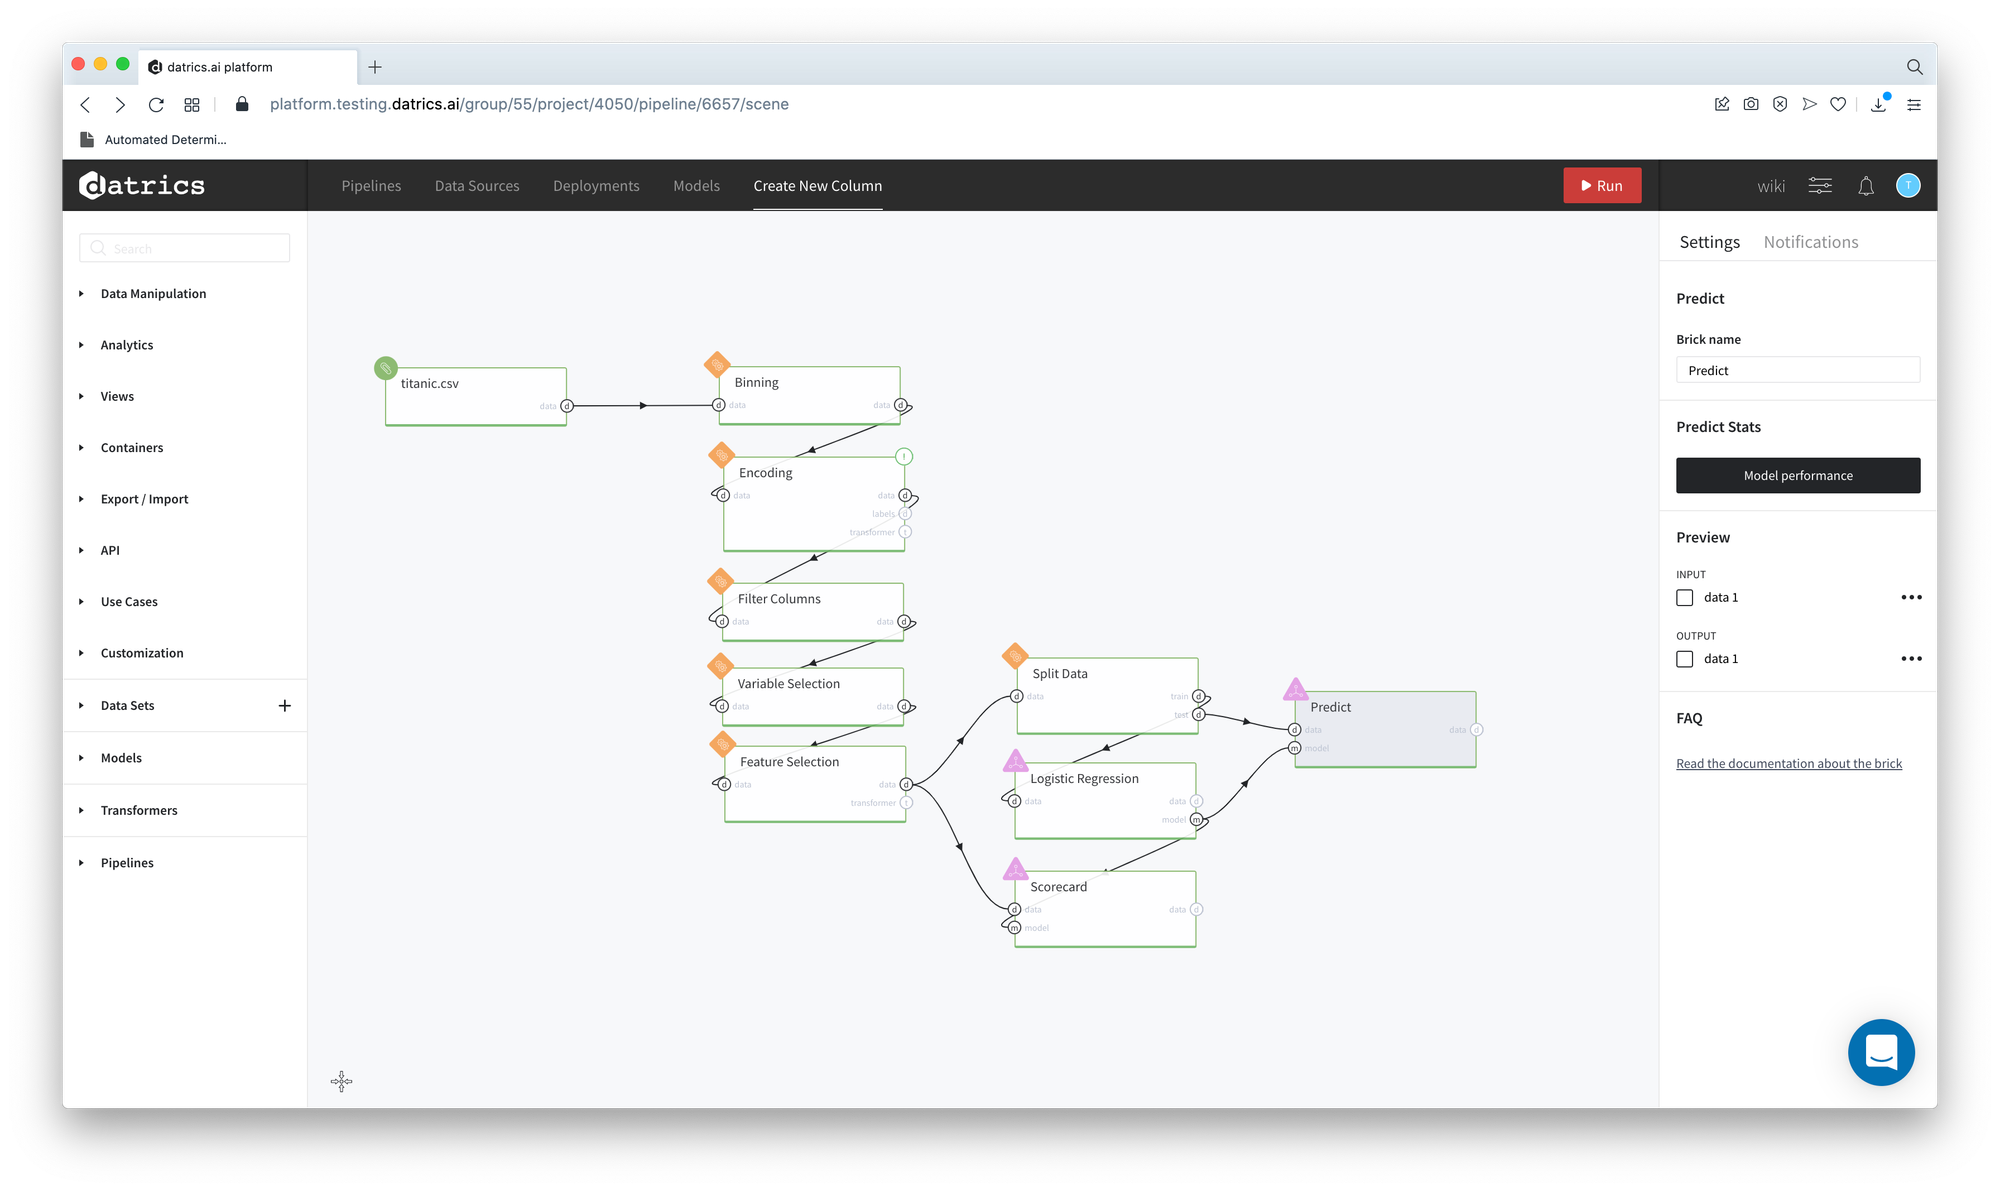
Final Pipeline
The final pipeline contains Encoding brick for the binarization of the categorical variables and Modelling-Scoring components
Pipeline Configuration
Import Minio
"Import Minio": {
      "brick": "Import Minio",
      "brick_description": "Imports a file from Minio to the platform",
      "brick_arguments": {
        "path": "samples/titanic.csv",
        "bucket": "storage.testing.datrics.ai",
        "pathOriginal": "samples/titanic.csv",
        "frozen_configuration": {}
      }}
Binning
"Binning": {
      "brick": "Binning",
      "brick_arguments": {
        "action": "calculate",
        "binning_rules": {
          "age": {
            "column": "age",
            "bins": [
              {
                "include_margin": [
                  false,
                  false
                ],
                "is_locked": true,
                "iv": 0.03983716989903174,
                "name": "child",
                "range": [
                  0,
                  12
                ],
                "woe": -0.65977814494985
              },
              {
                "include_margin": [
                  true,
                  false
                ],
                "is_locked": true,
                "iv": 0.0064576678726842255,
                "name": "young",
                "range": [
                  12,
                  21
                ],
                "woe": 0.1872559583684909
              },
              {
                "include_margin": [
                  true,
                  true
                ],
                "is_locked": true,
                "iv": 1.699951979011563E-7,
                "name": "adult",
                "range": [
                  21,
                  60
                ],
                "woe": -0.0004957362184482255
              },
              {
                "include_margin": [
                  false,
                  true
                ],
                "is_locked": true,
                "iv": 0.027512355417335172,
                "name": "senior",
                "range": [
                  60,
                  150
                ],
                "woe": 1.048617884608208
              }
            ],
            "iv": 0.0738,
            "checked": true,
            "autoConfig": {
              "algorithm": "ivbin"
            },
            "remove_outliers": false,
            "algorithm": "manual"
          }
        },
        "n_bins_default": 5,
        "columns_for_calculate": null,
        "configuration": {},
        "target": "survived",
        "time_stamp": 1635775703504991500
      }}
Encoding
"Encoding": {
      "brick": "Encoding",
      "brick_description": "Performs one-hot encoding or converts variable to the category data type",
      "brick_arguments": {
        "columns": [
          {
            "column": "pclass",
            "encoding": "one-hot",
            "additional_categories": null
          },
          {
            "column": "parch",
            "encoding": "one-hot",
            "additional_categories": null
          },
          {
            "column": "embarked",
            "encoding": "one-hot",
            "additional_categories": null
          },
          {
            "column": "age_bins",
            "encoding": "one-hot",
            "additional_categories": null
          },
          {
            "column": "sex",
            "encoding": "one-hot",
            "additional_categories": null
          }
        ]
      }}
Filter Columns
"Filter Columns": {
      "brick": "Filter Columns",
      "brick_description": "Filters out the columns from a dataset",
      "brick_arguments": {
        "columns_list": [
          "name",
          "age",
          "ticket",
          "cabin",
          "fare",
					"sibsp"
        ],
        "leave_flag": false
      }},
Variable Selection
"Variable Selection": {
      "brick": "Variable Selection",
      "brick_description": "Performs the selection of the independent variables that are characterized by sufficient predictive power with respect to the binary target variable. The predictive power of the variable is reflected via Information Value (IV).",
      "brick_arguments": {
        "target": "survived",
        "exclude_columns": null,
        "threshold": 0.02
      }},
    "Feature Selection": {
      "brick": "Feature Selection",
      "brick_description": "Feature Selection is the process of reducing the number of input variables",
      "brick_arguments": {
        "columns_to_exclude": [
          "survived"
        ],
        "method": "Variance Inflation Factor",
        "threshold": 5,
        "target": "",
        "n_features": 0
      }}
Split Data
"Split Data": {
      "brick": "Split Data",
      "brick_description": "Splits a dataset into two, allows for stratification",
      "brick_arguments": {
        "test_size": 0.1,
        "shuffle": false
      }}
Logistic Regression
"Logistic Regression": {
      "brick": "Logistic Regression",
      "brick_description": "Binary classification model, in its basic form uses a logistic function.",
      "brick_arguments": {
        "regularization": null,
        "probability": "class",
        "weight_column": "",
        "class_balancing": "none",
        "optimize": false,
        "optimize_mode": null,
        "is_train_explainer": false,
        "target_variable": "survived",
        "is_show_advanced_mode": true
      }}
ScoreCard
"ScoreCard": {
      "brick": "ScoreCard",
      "brick_description": "Performs the transformation of Logistic Regression Model coefficients to the scorecard.Transformation can be performed with/without taking into account features Weight of Evidence",
      "brick_arguments": {
        "scaling_type": "odds_scaling",
        "scaling_params": {
          "pdo": 20,
          "target_odds": 50,
          "target_score": 600
        },
        "woe_correction": true,
        "columns_list": [],
        "leave_flag": false,
        "target": "survived"
      }}
Predict
"Predict": {
      "brick": "Predict",
      "brick_description": "Generates predictions for the trained model using given dataset",
      "brick_arguments": {}}
Results
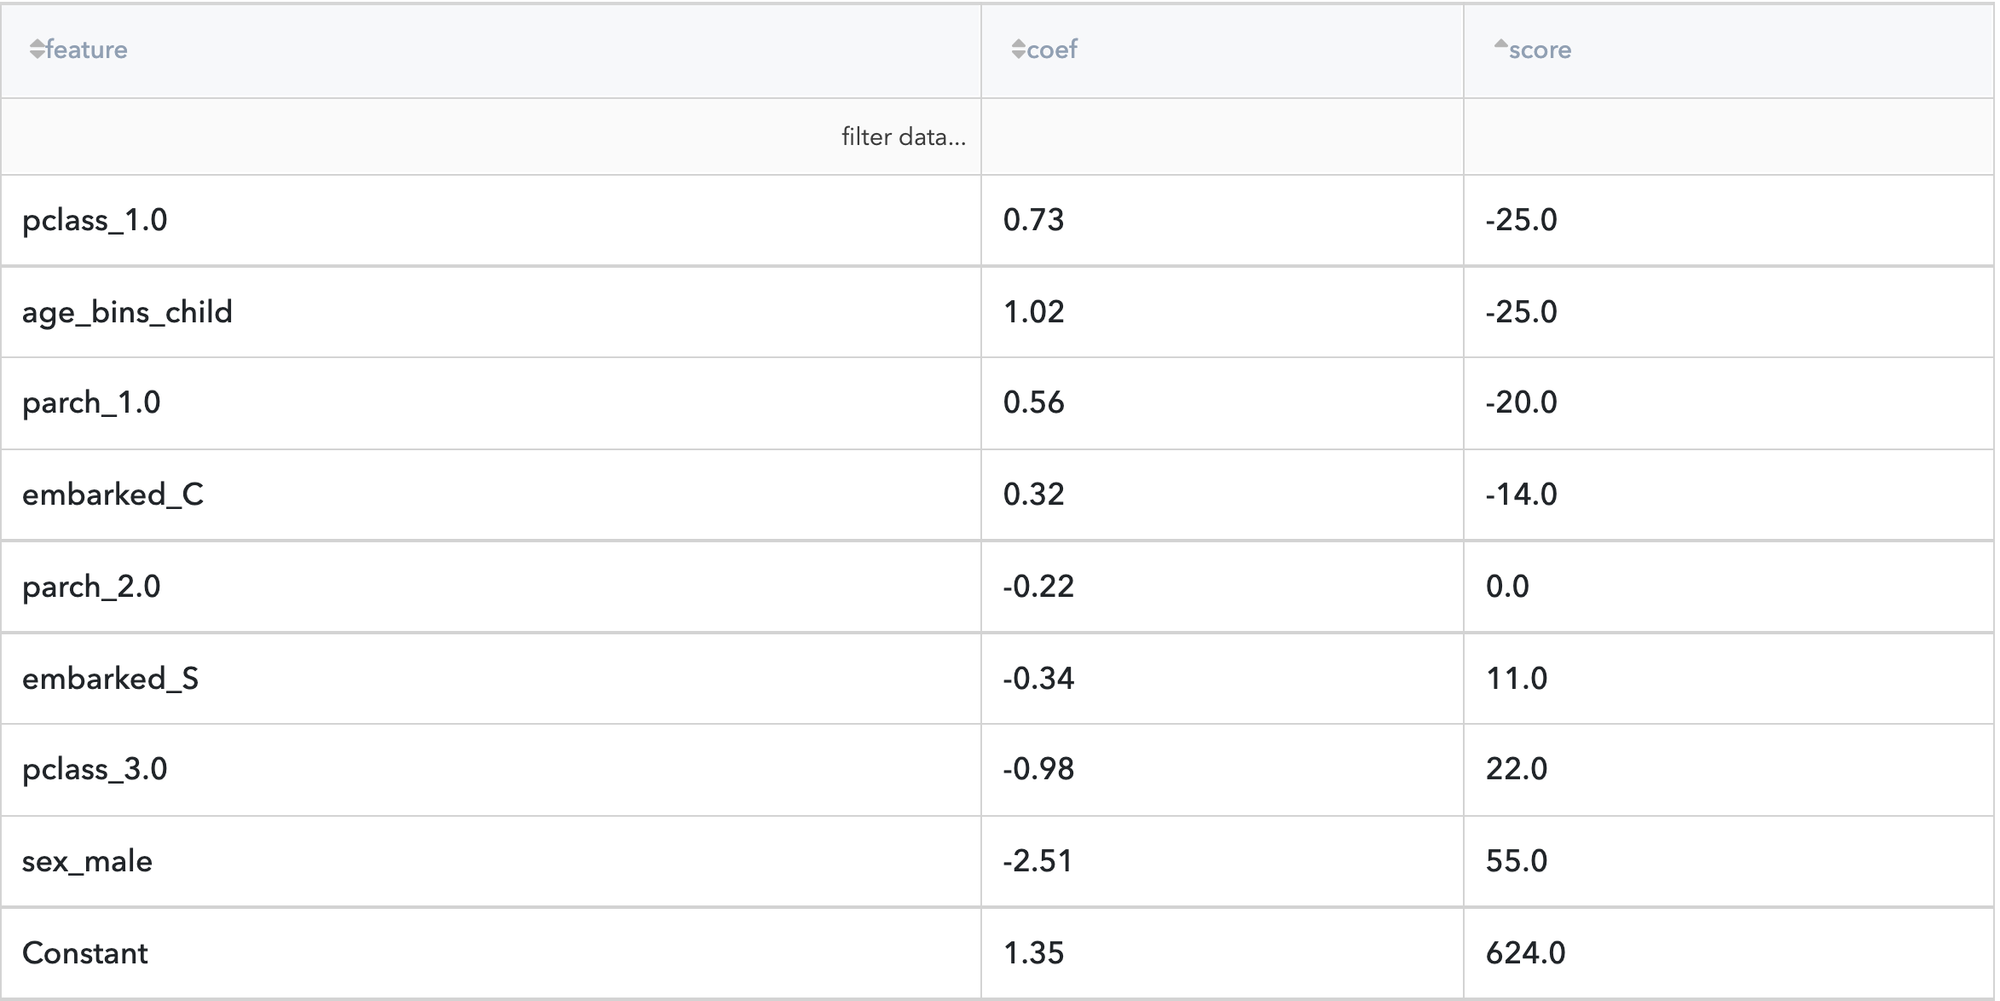
Let's consider the pipeline results. The "Model Performance" dashboard of the Logistics Regression model showed that the most influenced features are "sex_male", "age_bins_child", "pclass_3.0" and "pclass_1.0"
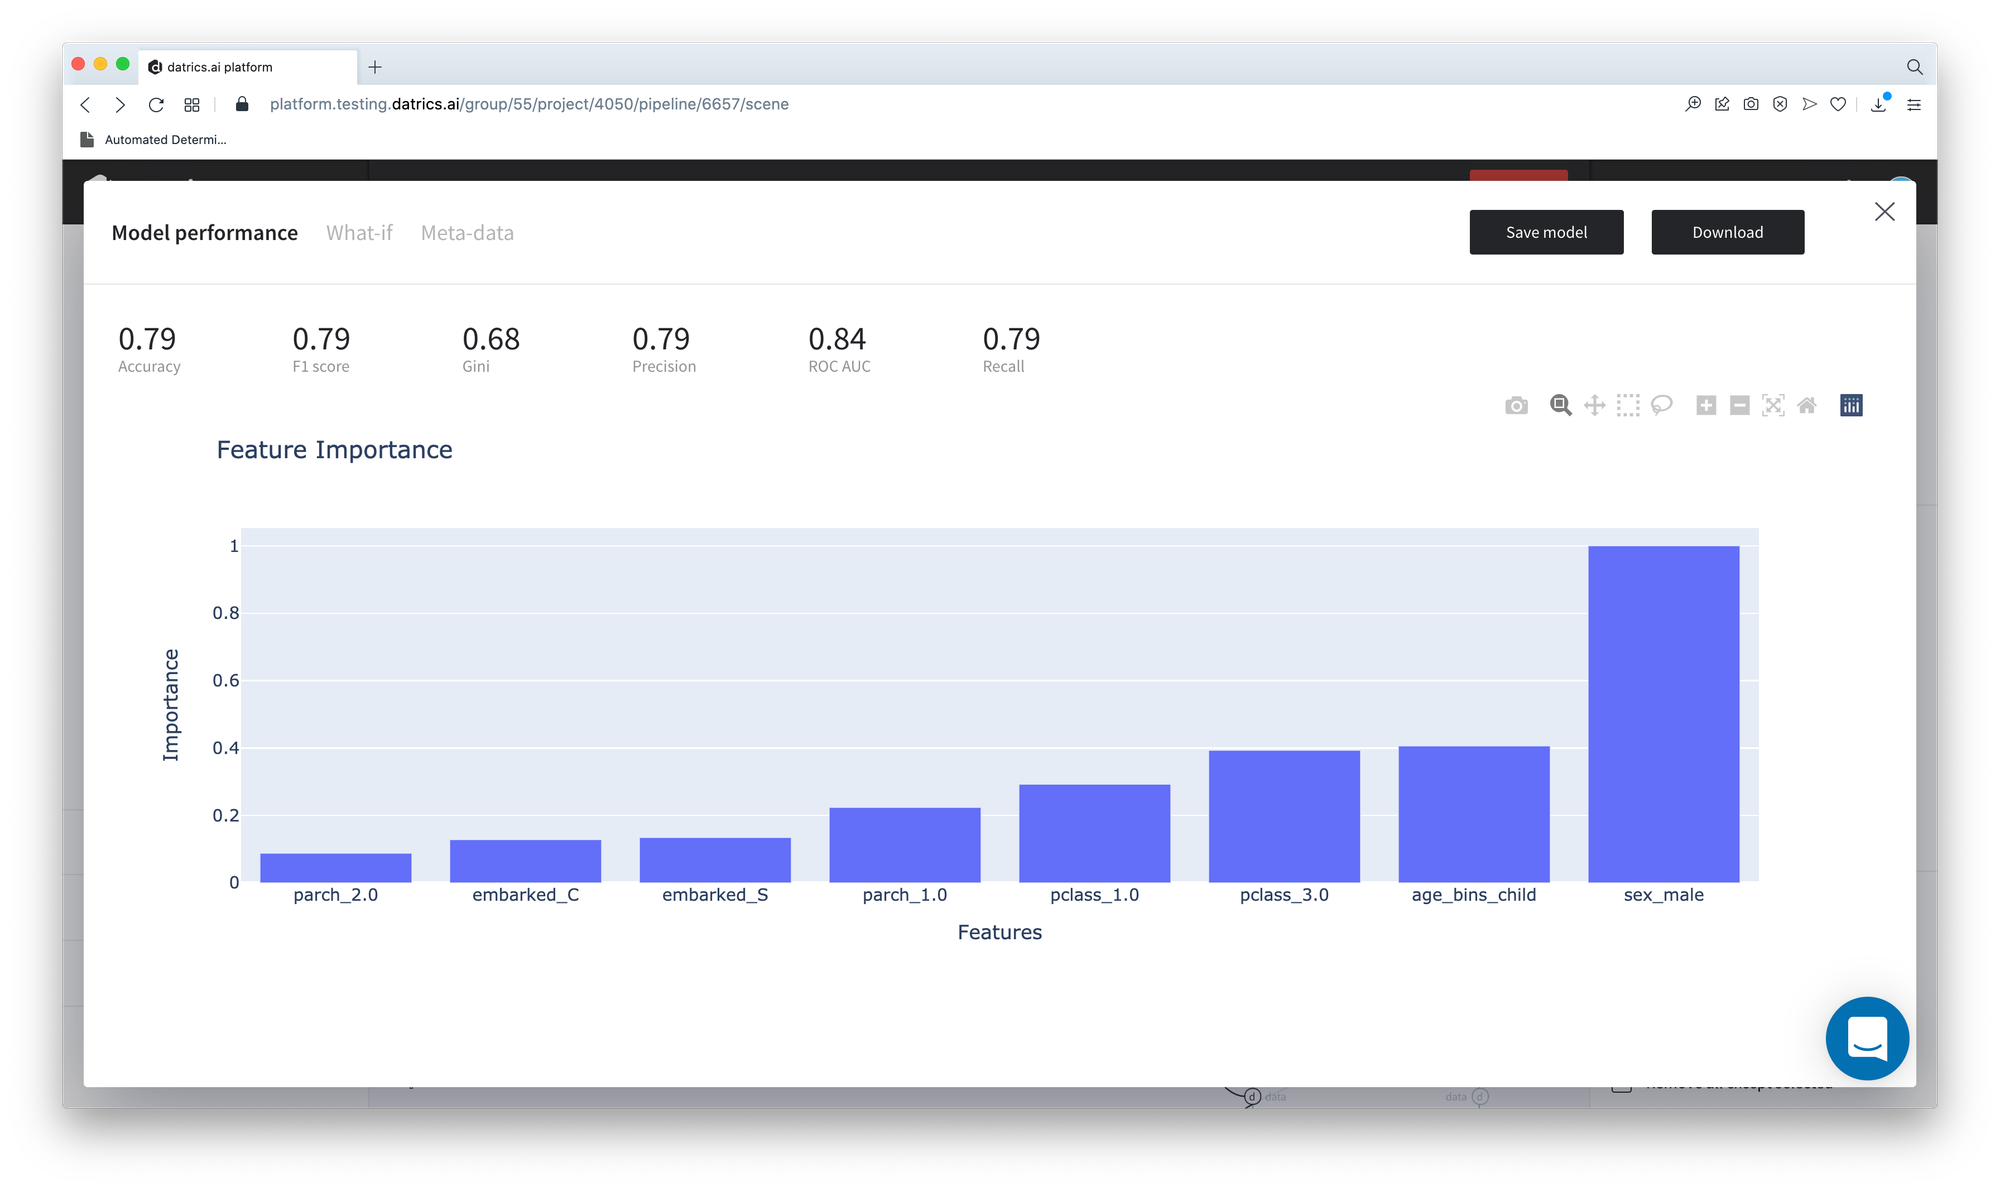
If we look at the scorecard, we can see, that the conditions "pclass_1.0" = True and "age_bins_child" = True significantly decrease the risk to "not-survived", while "sex_male" increases this risk.