General information
Many businesses, technical and academic problems investigate how different phenomena are linked together, e. g., "Do snows drive the sales of de-icers?", "Do older people earn more money?", "Are wages linked to inflation?", "Do higher oil prices increase the cost of shipping?" and so on.
Correlation is a widely used statistical tool to measure the strength of such an association between two variables and the direction of that relationship. The strength of linkage or co-occurrence between to variables varies between -1 and +1.
A value of ± 1 indicates a perfect degree of association between the two variables. The closer the correlation coefficient to 0 the weaker relationship between variables. The direction of the relationship is indicated by the sign of the coefficient; a + sign indicates a positive relationship and a – sign indicates a negative relationship.
This value that measures the strength of linkage is called the correlation coefficient. There are many measurement types, but the most commonly used are Pearson correlation, Kendall rank correlation, and Spearman correlation.
Pearson R Correlation
Pearson r correlation is the most widely used correlation statistic to measure the degree of the relationship between linearly related variables. For example, in the stock market, if we want to measure how two stocks are related to each other, Pearson r correlation is used to measure the degree of relationship between the two. It seeks to draw a line through the data of two variables to calculate the correlation coefficient r via the following formula:
where:
- - Pearson r correlation coefficient between x and y
- n - number of observations
- - value of x (for ith observation)
- - value of y (for ith observation)
Kendall Rank Correlation
Also commonly known as “Kendall’s tau coefficient”. Kendall’s Tau coefficient assess statistical associations based on the ranks of the data. It is used to test the similarities in the ordering of data when it is ranked by quantities.
Other types of correlation coefficients use the observations as the basis of the correlation, while Kendall’s correlation coefficient uses pairs of observations and determines the strength of association based on the patter on concordance and discordance between the pairs.
- Concordant: Ordered in the same way (consistency). A pair of observations is considered concordant if (x2 — x1) and (y2 — y1) have the same sign.
- Discordant: Ordered differently (inconsistency). A pair of observations is considered concordant if (x2 — x1) and (y2 — y1) have opposite signs.
Kendall’s Tau coefficient of correlation is usually smaller values than Spearman’s rho correlation. The calculations are based on concordant and discordant pairs. Insensitive to error. Values are more accurate with smaller sample sizes (compared to Spearman correlation).
where
- - number of concordant pairs
- - number of disconcordant pairs
- n - number of observations
Spearman's rank correlation
A Spearman correlation is simply a non-parametric Pearson correlation computed on ranks instead of data values or categories, and indicate monotonous rather than linear-relations. In any other aspect, Spearman's rank correlations serve the exact same purposes as Kendall’s tau and not affected by outliers as well.
where
- = - is the difference between the two ranks of each observation,
- n - number of observations
Recommendations
- Before calculating Pearson's correlation coefficient, screen your data for outliers (which can cause misleading results)
- Pearson's correlation requires an evidence of a linear relationship. Two variables can be perfectly related, but if the relationship is not linear, the correlation coefficient is not an appropriate statistic for measuring their association.
- For quantitative, normally distributed variables, choose the Pearson correlation coefficient. If your data are not normally distributed or have ordered categories, choose Kendall's tau-b or Spearman, which measure the association between rank orders.
- Spearman correlations are suitable for all but nominal variables. However, when both variables are either metric or dichotomous, Pearson correlations are usually the better choice;
- It is vital to understand that correlation does not imply causation!
Description
Brick Location
Bricks → Analytics → Data Insights→ Bivariate Correlation
Brick Parameters
- Choose specific columns
By default, all numerical columns (others will be skipped) are taken for the bivariate correlation calculation. If this checkbox is selected, only the specified columns will be processed.
- Columns
If you checked "Choose specific columns", you can specify columns by which the bivariate correlation matrix will be calculated. To add more columns just press '+' button near the parameter (or press '-' near the input box to delete unneeded ones).
- Method
This parameter lets you choose one of a measurement type/method, described in the General Info section: Pearson, Kendall, Spearman. By default, Pearson r correlation is selected.
Brick Inputs/Outputs
- Inputs
Brick takes the dataset, which contains the numerical columns
- Outputs
Brick produces the bivariate correlation matrix as a new dataset.
Example of usage (Blocked by the frontend)
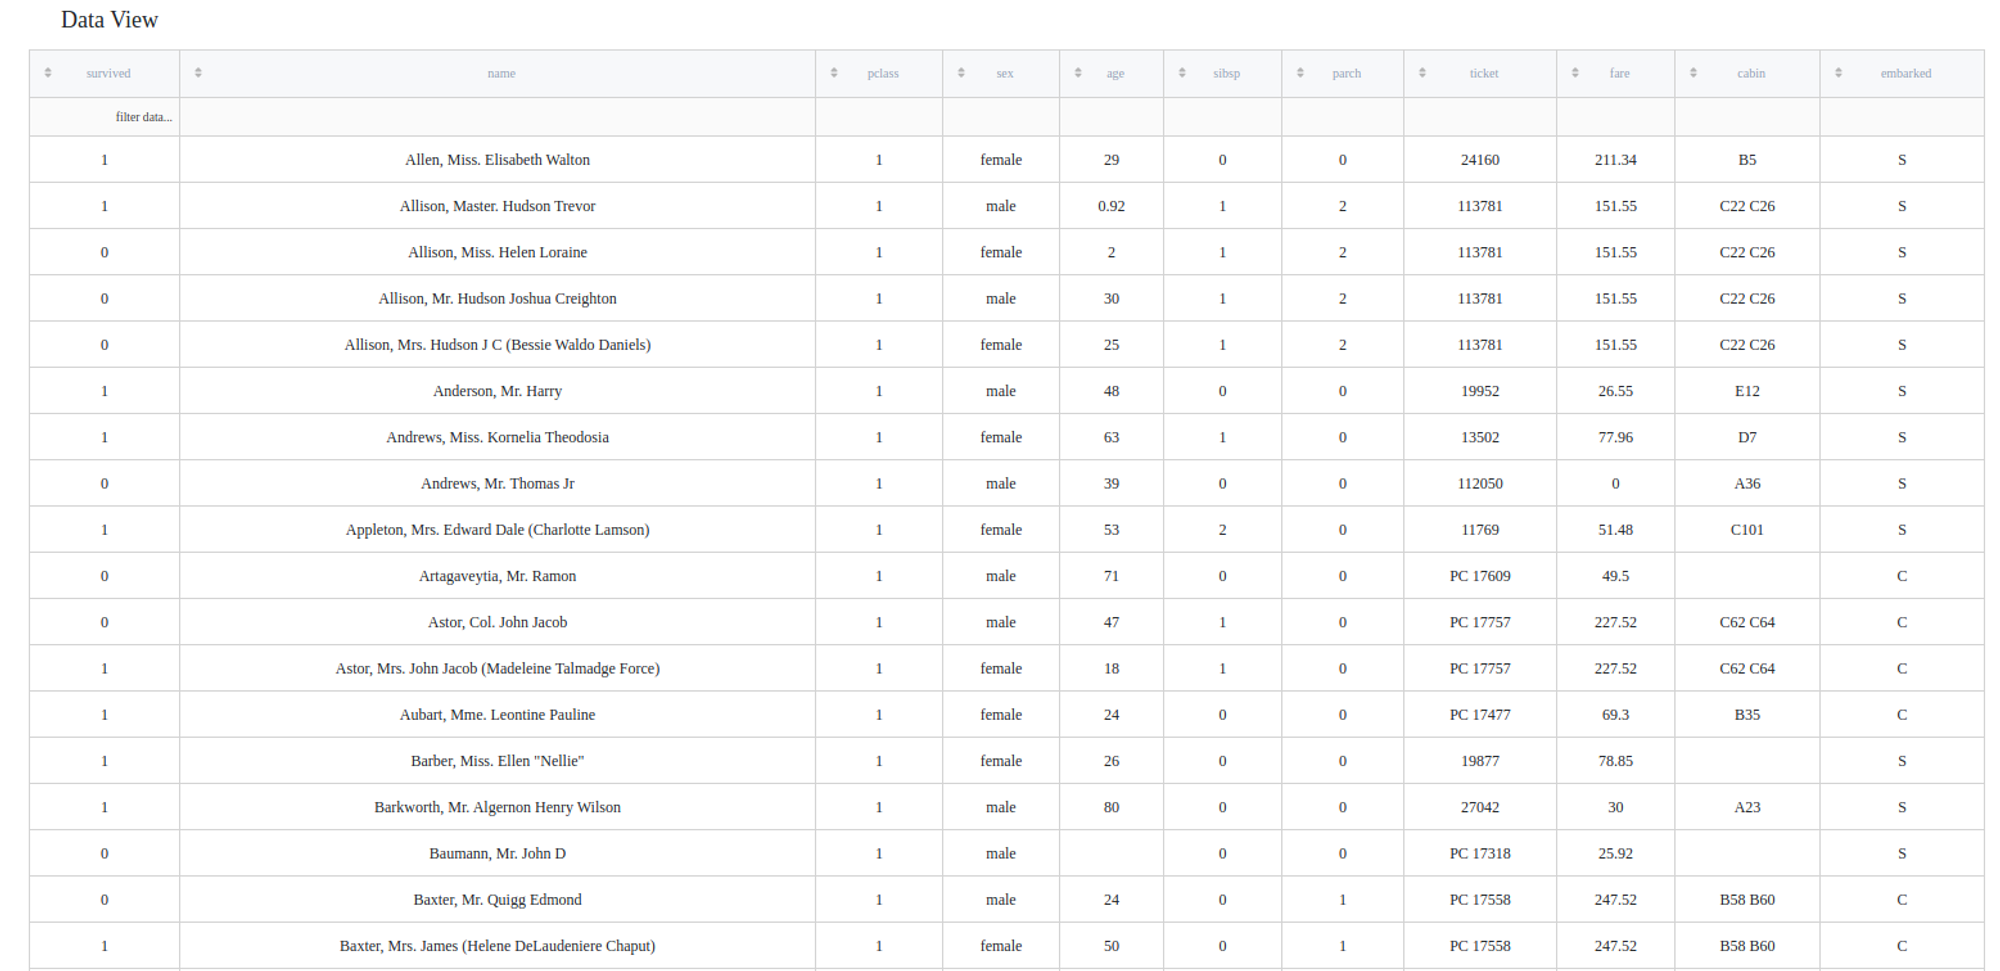
Let's consider the binary classification problem . The inverse target variable takes two values - survived (0) - good or non-event case / not-survived (1) - bad or event case. The general information about predictors is represented below:
- passengerid (category) - ID of passenger
- name (category) - Passenger's name
- pclass (category) - Ticket class
- sex (category) - Gender
- age (numeric) - Age in years
- sibsp (numeric) - Number of siblings / spouses aboard the Titanic
- parch (category) - Number of parents / children aboard the Titanic
- ticket (category) - Ticket number
- fare (numeric) - Passenger fare
- cabin (category) - Cabin number
- embarked (category) - Port of Embarkation
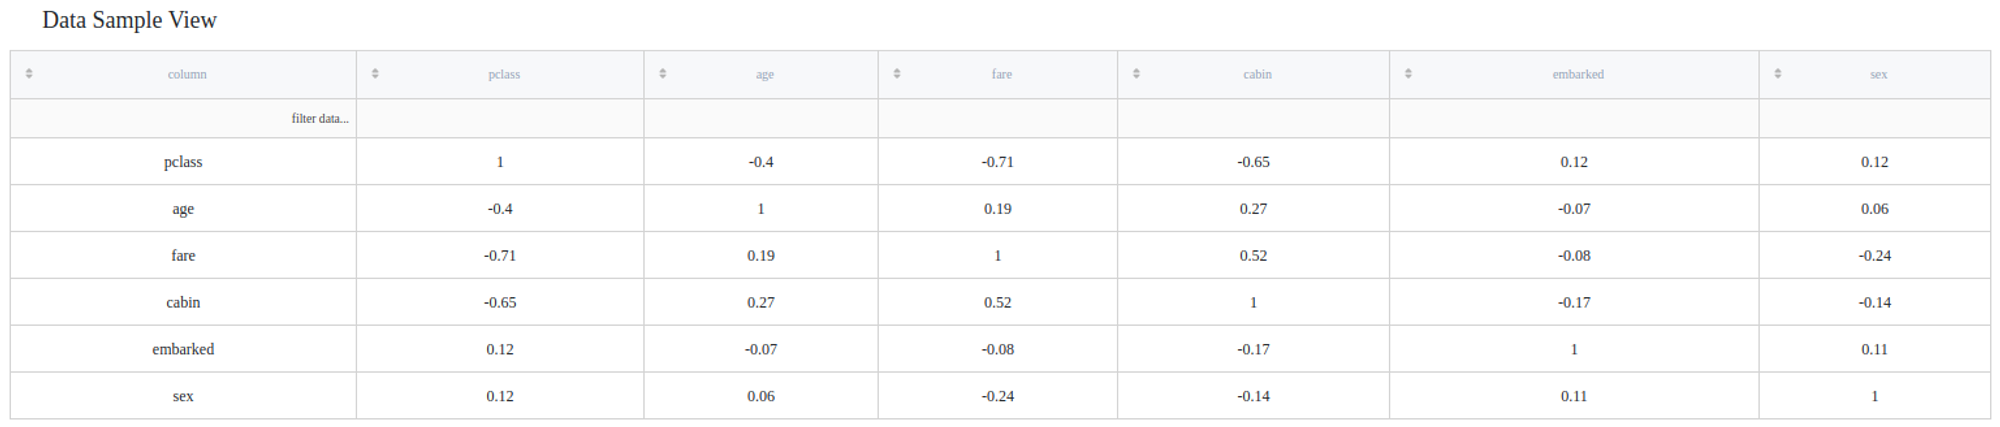
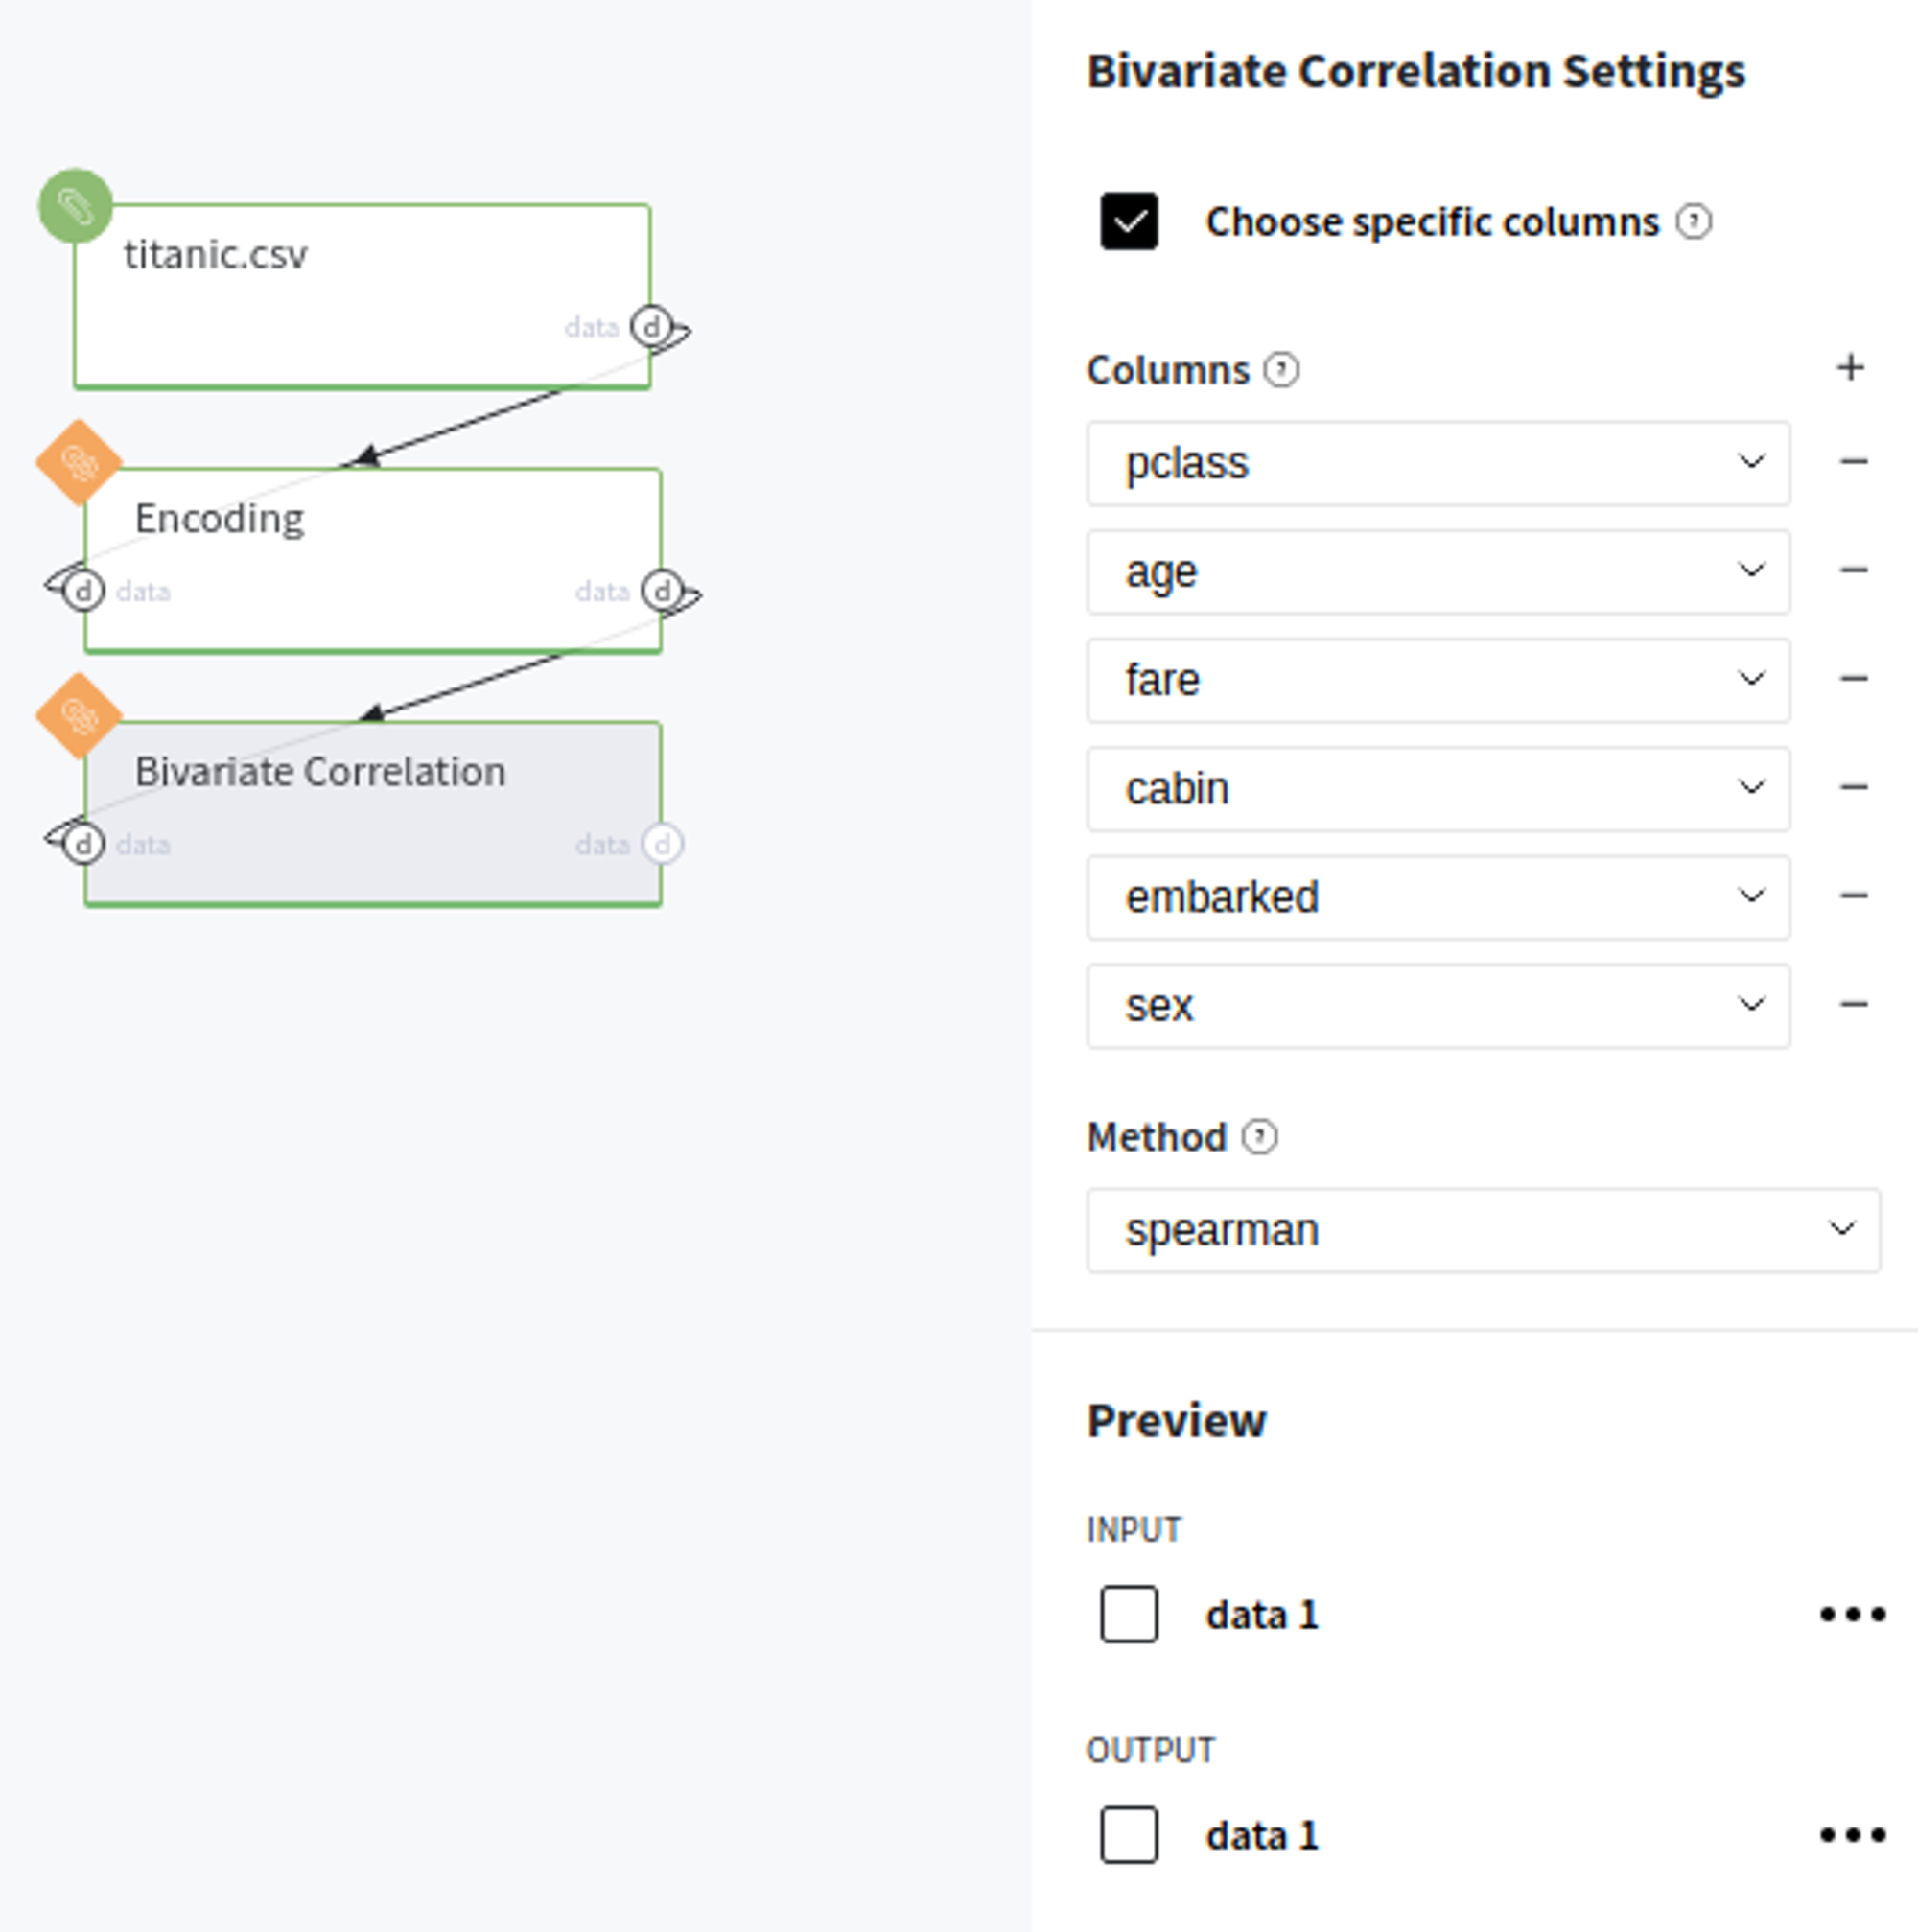
Let's consider that we want to know the correlation between such variables as pclass, age, fare, cabin, embarked and sex (please, notice that the last three of them require label encoding). Cause we do not have any evidence of linear relationships, let us choose the spearman method as a correlation metric. Therefore, we would not need any additional outliers filtering.
Executing regular pipeline run
Next steps would be made to build simple pipeline:
- First, drag'n'drop titanic.csv file from StorageSamples folder, Encoding and Bivariate Correlation bricks from BricksData Preprocessing
- Connect titanic data set to our Encoding brick and perform label encoding on the cabin, embarked sex columns.
- Connect Encoding's output with our Bivariate Correlation brick, check "Choose specific columns" option, specify all listed previously columns (you can add additional input-boxes by pressing the '+' symbol) and select the spearman correlation method.
- Run pipeline
In order to see the assessment result, you should open the Output data previewer on the right sidebar.
The results are depicted in the table: