General information
Cox Regression is one of the most popular regression techniques for survival analysis, which is used to connect several risk factors or exposures, considered simultaneously, to survival time.
The response variable is the hazard function , which assesses the probability that the event of interest occurred before . The equation models this hazard as an exponential function of an arbitrary baseline hazard () when all covariates are null, and is the regression coefficient of the covariate, .
The Cox proportional hazards model makes two assumptions:
- Survival curves for different strata must have hazard functions that are proportional over the time t.
- The relationship between the log hazard and each covariate is linear, which can be verified with residual plots.
Description
Brick Locations
Bricks → Machine Learning → Cox Regression
Brick Parameters
- Duration column
The column that contains the subjects’ lifetimes.
- Event column (optional)
The column that contains the event occurrence observation. If not specified, all cases are considered to be uncensored.
- Strata column (optional)
The column that is used for stratification.
- Cluster column (optional)
The column that has unique identifiers for clustering covariances.
- Filter Columns
Dataset columns that are ignored during the model training. However, they will be present in the resulting set. Multiple columns can be selected by clicking the ‘+’ button.
If you want to remove many columns, you can select the columns to keep and use the flag “Remove all except selected”.
Brick Inputs/Outputs
- Inputs
Brick takes the dataset with the duration target column
- Outputs
- Brick produces the dataset with an extra column ‘duration_expectation’ for model predictions
- A trained model that can be used in other bricks as an input
Example of usage
Let’s look at the example of applying the Cox Regression model.
We will use the dataset ‘lung.csv’ of the survival of patients with advanced lung cancer. It contains the following information:
- inst - Institution code
- time - Survival time in days
- status - Censoring status: 0=censored, 1=dead
- age - Age in years
- sex - Sex: 1=male, 2=female
- ph.ecog - ECOG performance score
- ph.karno - Karnofsky performance score (bad=0-good=100) rated by physician
- pat.karno - Karnofsky performance score as rated by a patient
- wt.loss - Weight loss in last six months
We can connect the Cox Regression brick to the dataset and make the following brick configuration:
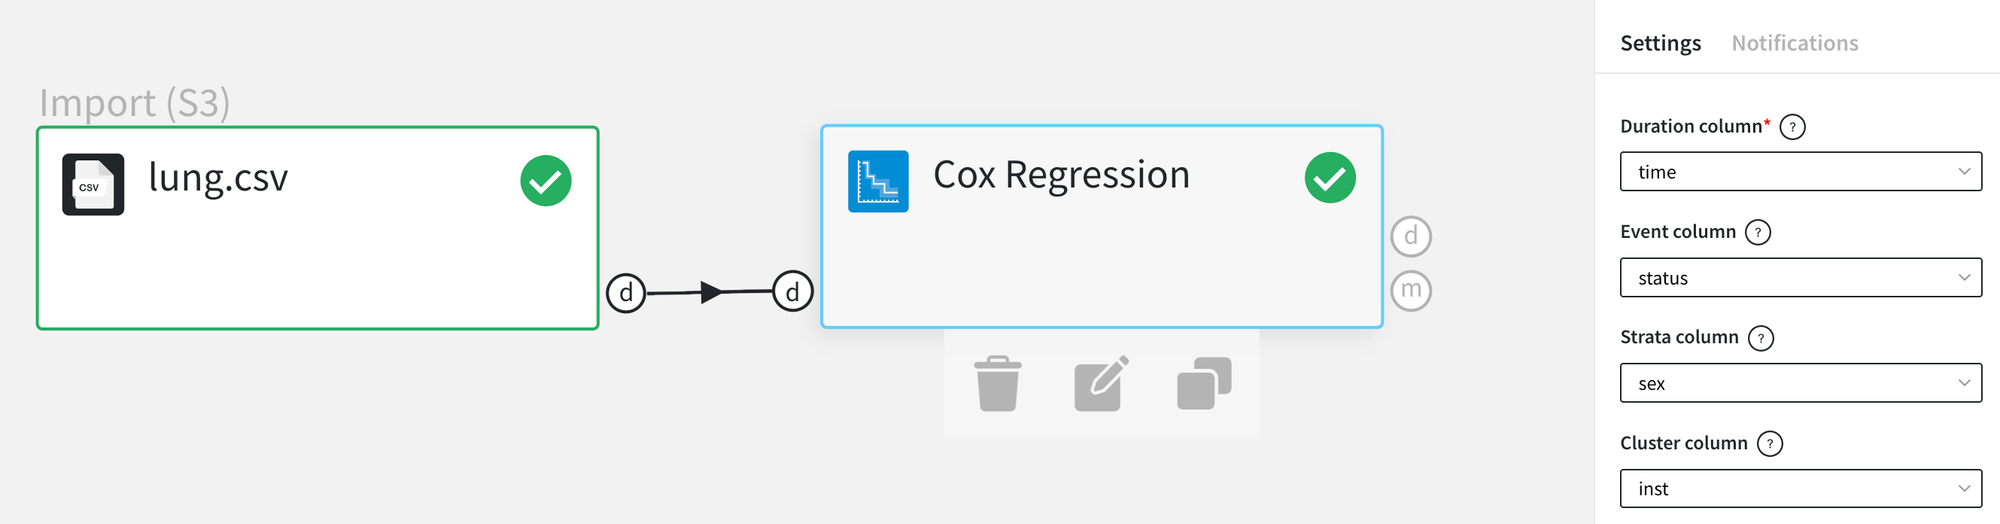
We have defined both Strata and Cluster columns. Institution code should be considered as a cluster because this is the identification of some common conditions for patients. As for the strata - it is reasonable to use the Sex feature.
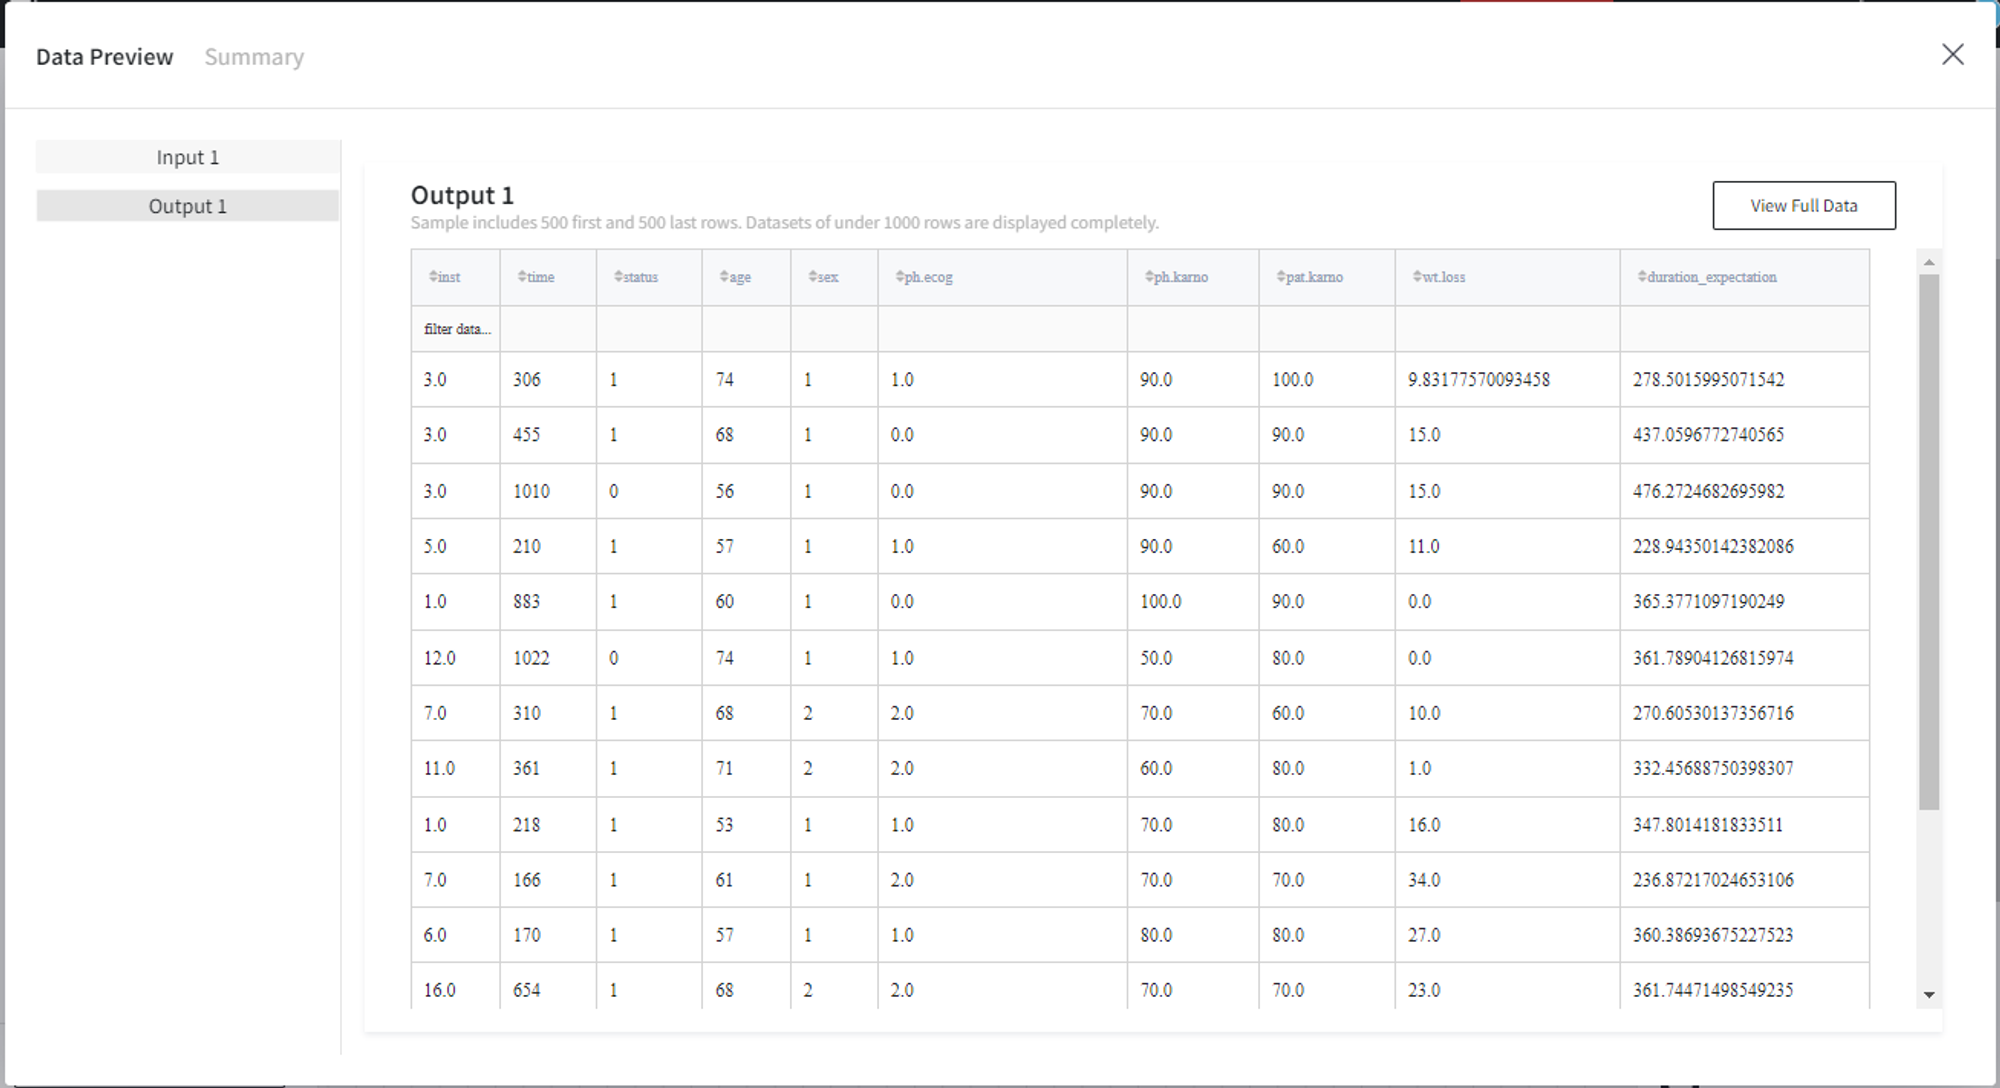
As a result, we get the dataset with an additional ‘duration_expectation’ column.
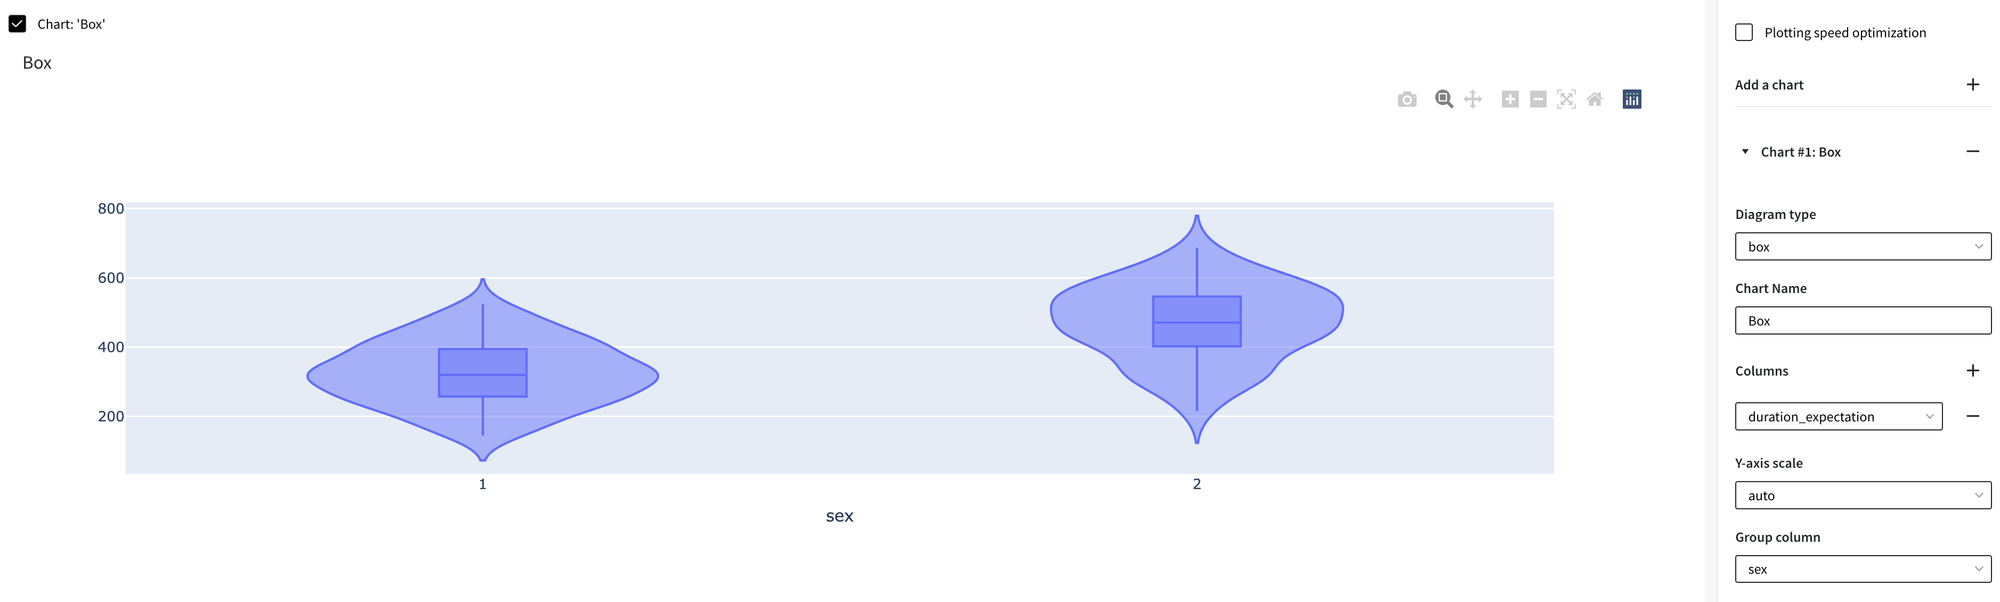
Visualization of the duration_expectation on the box-plots is depicted below. As we can see, patients with Sex=2 are characterized by longer survival time.
To see the model's performance choose the corresponding option in the Model Info section:
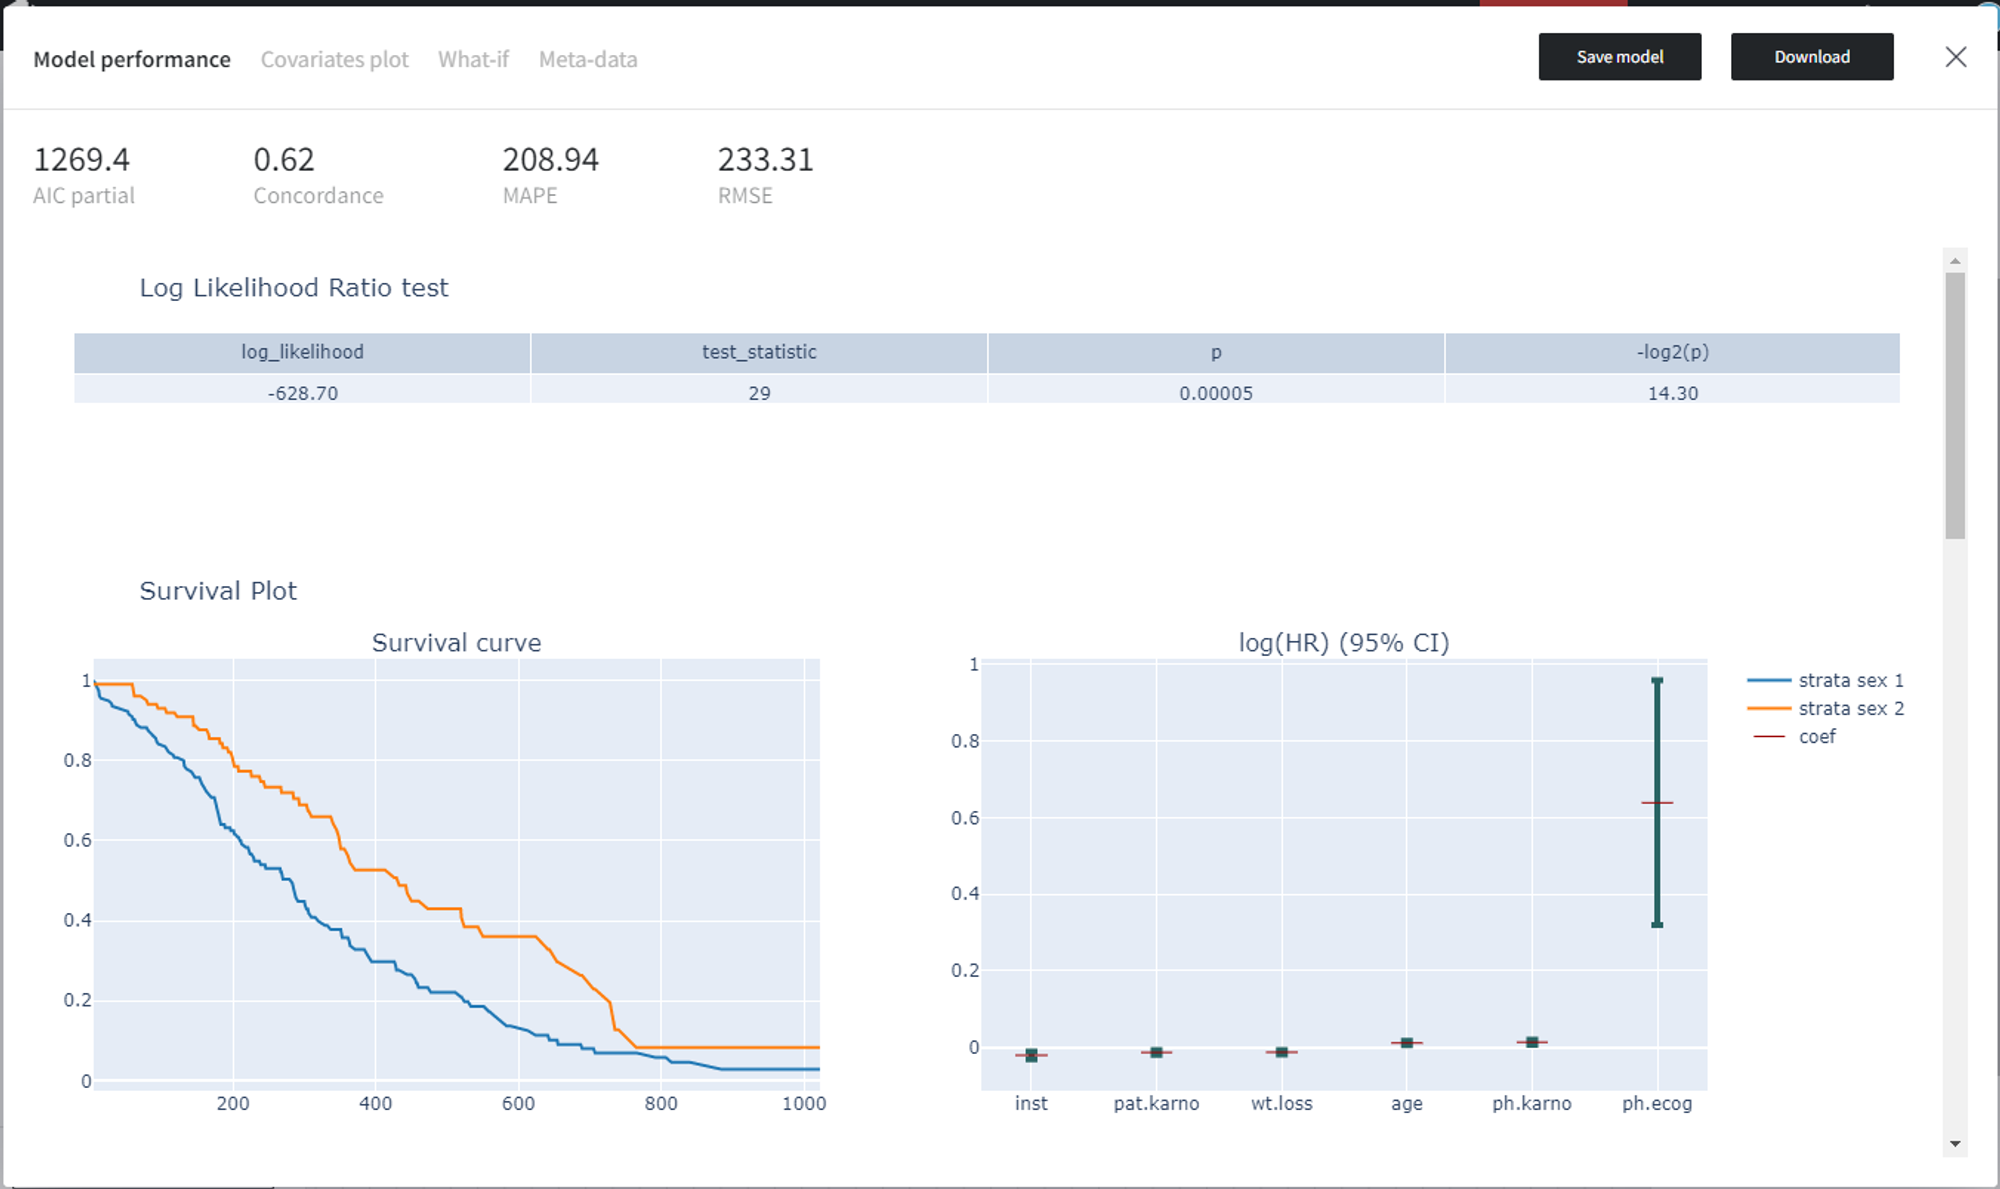
The Model performance tab provides all the essential model metrics and some visualizations.
Supported metrics: AIC (Akaike Information Criterion) partial, Concordance, MAPE (Mean Absolute Percentage Error), RMSE (Root Mean Square Error).
Also, we get the Log Likelihood Ratio test for the Cox regression model, where the existing model (with all the covariates) is compared to the trivial model with no covariates.
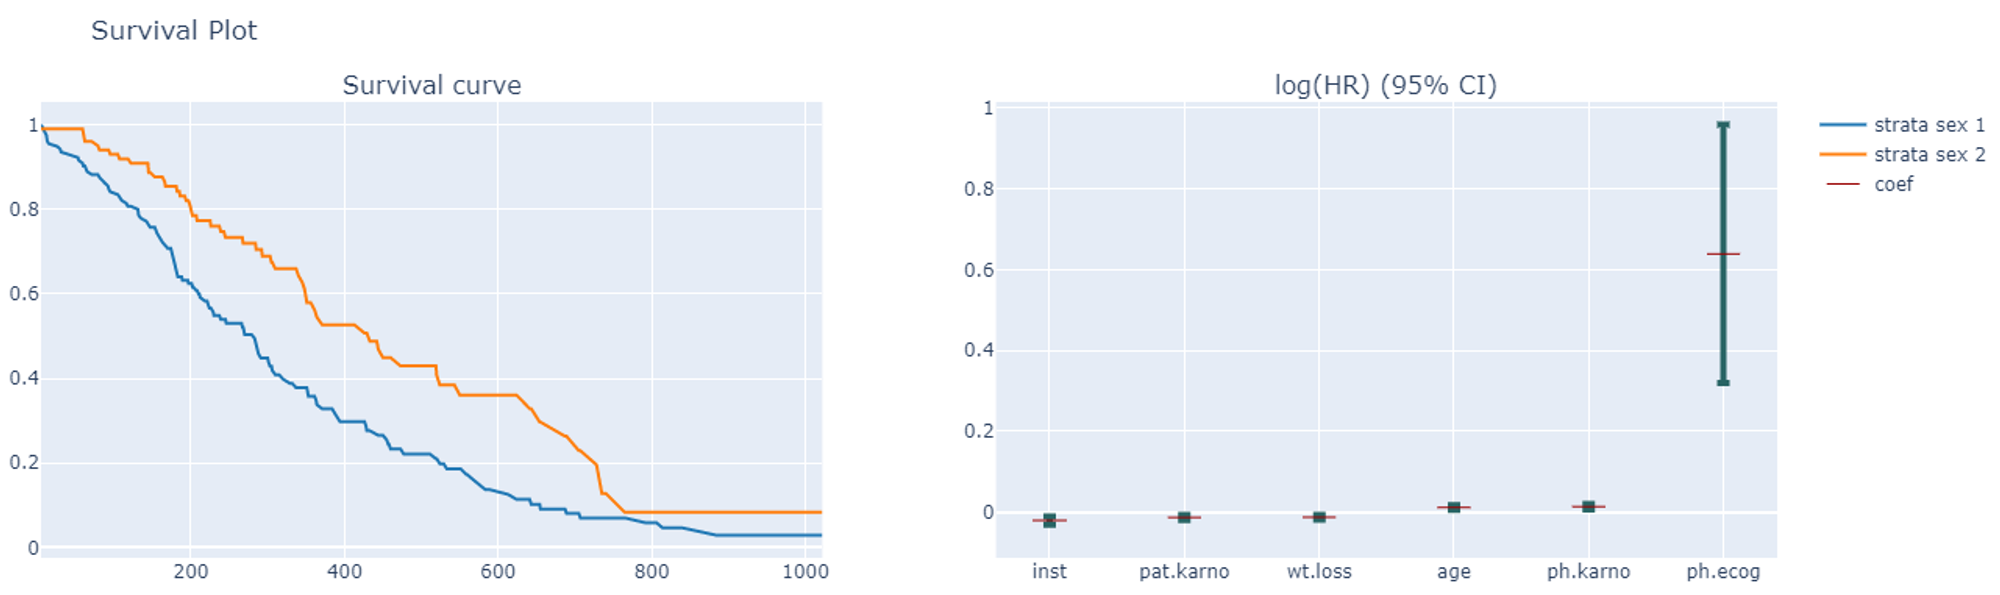
If the Strata column was provided, the Survival Plot shows the Survival curve and a visual representation of the coefficients (i.e. log hazard ratios) by strata.
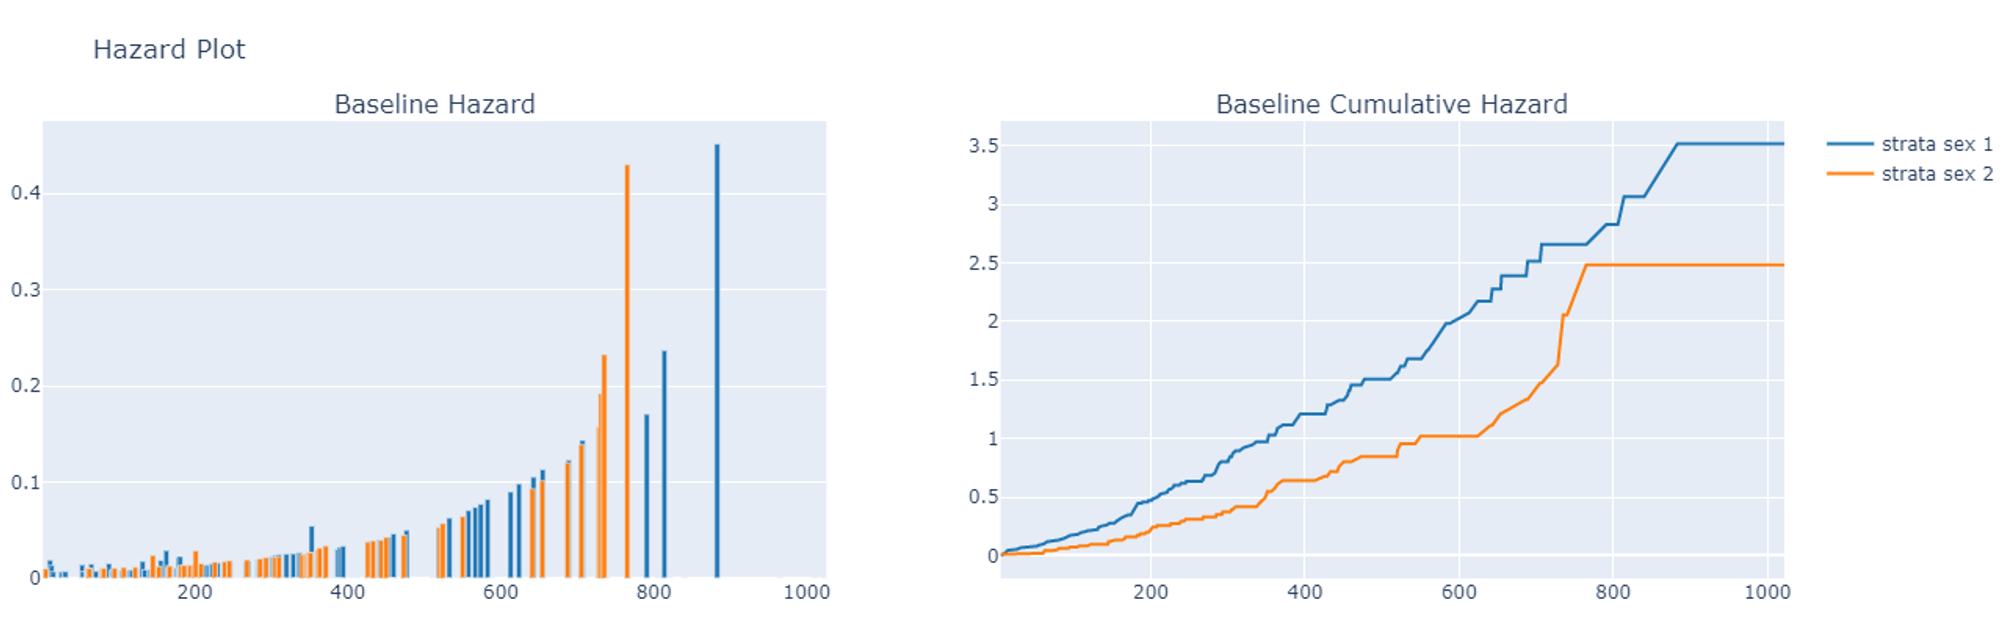
Similarly, the Hazard Plot represents the Baseline Hazard and the Baseline Cumulative Hazard by strata.
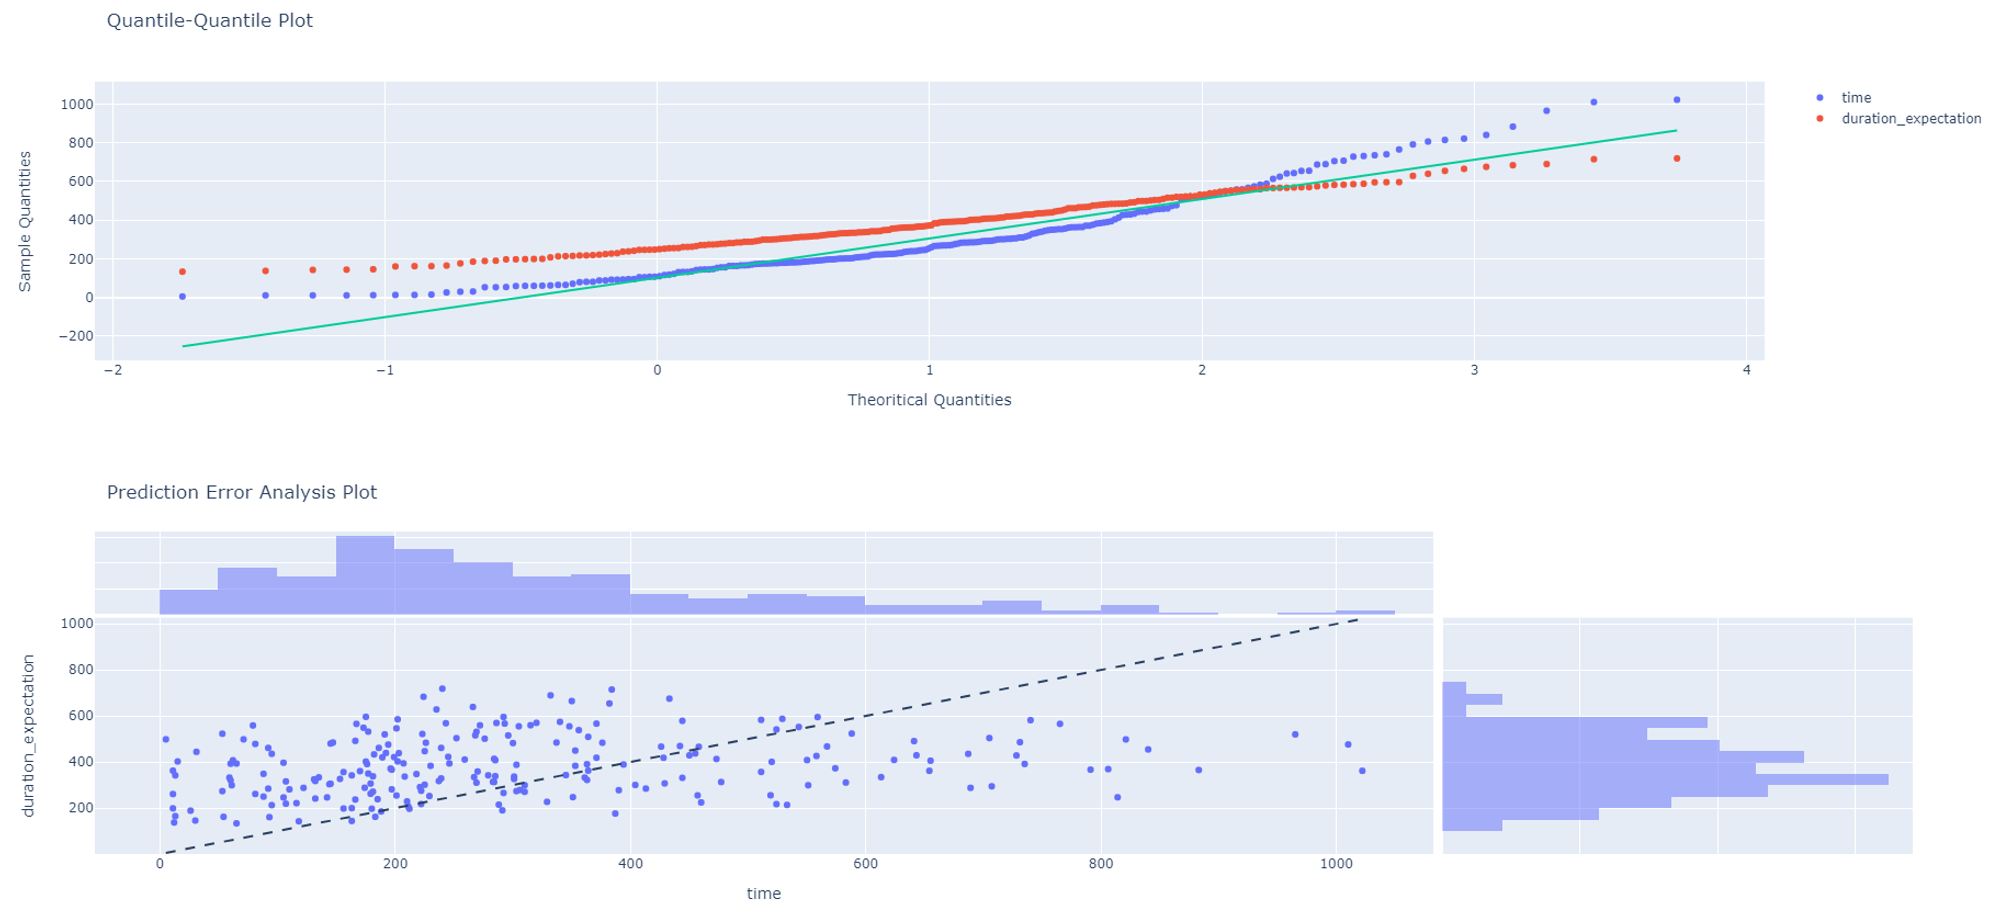
In addition, the Model performance visualizations include the Quantile-Quantile plot and the Prediction Error Analysis plot.
Compared to other models available on the platform, the Cox Regression’s Model Info has an extra tab called Covariates plot, which produces a plot comparing what happens when a covariate is varied over values in a group.
For instance, here is the ‘Partial Effect of age’ plot for our dataset:
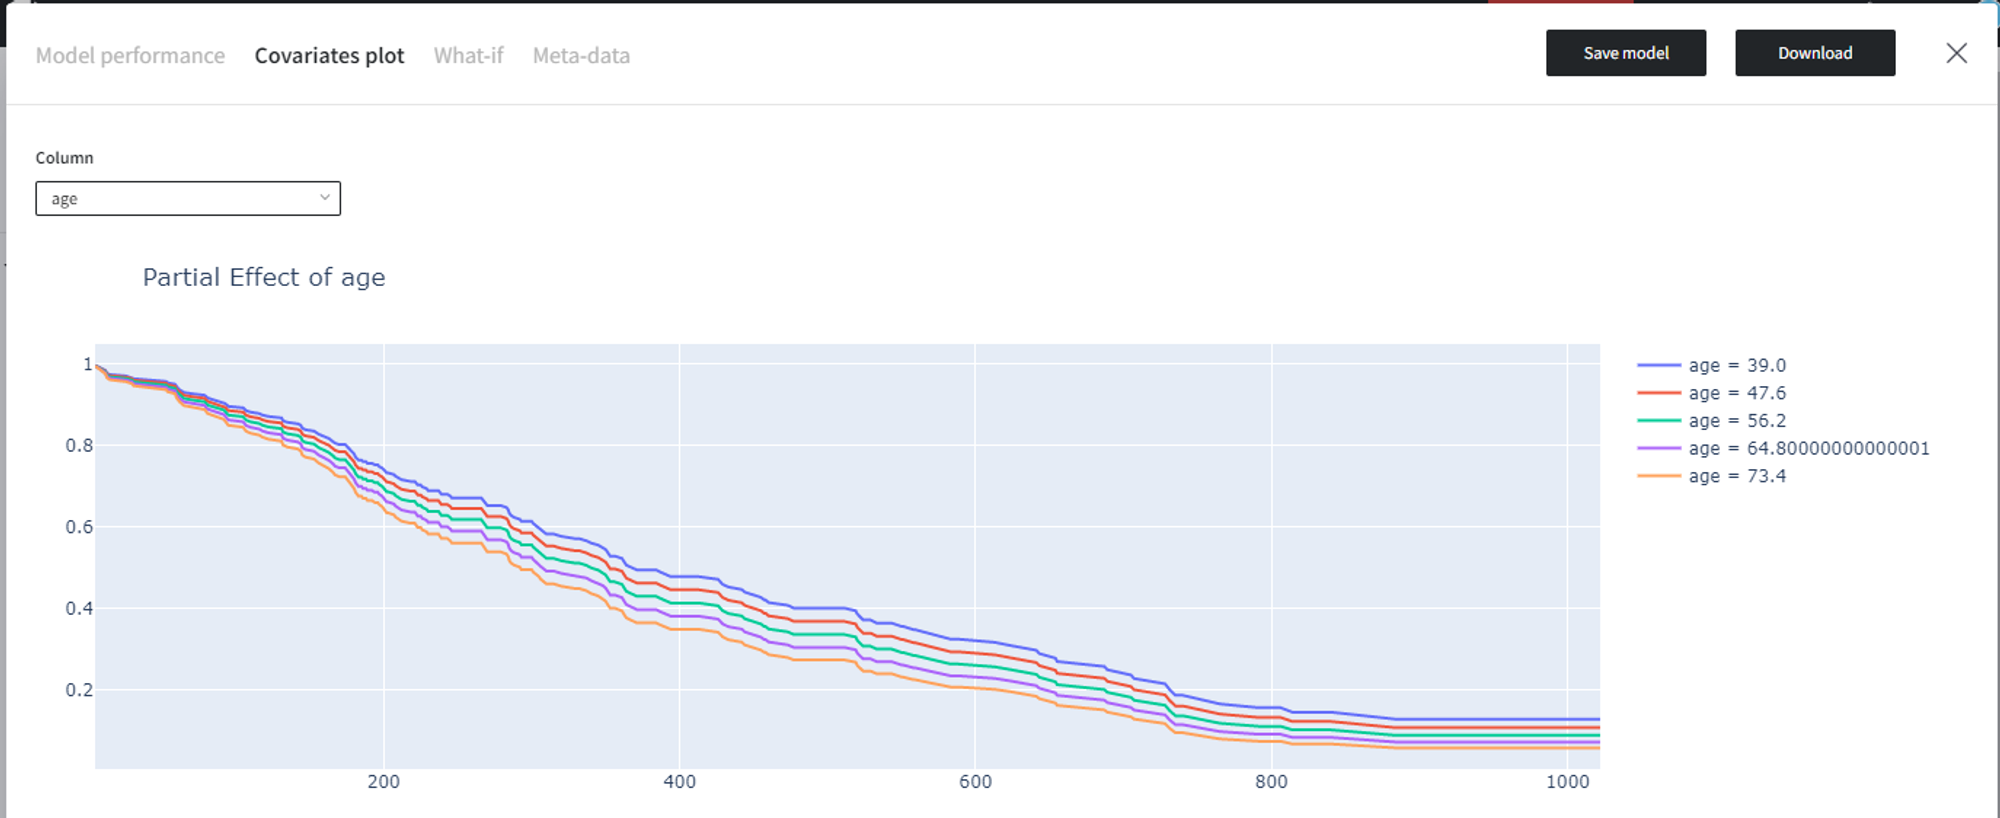
According to it, a higher age indicates a lower probability of survival throughout time.
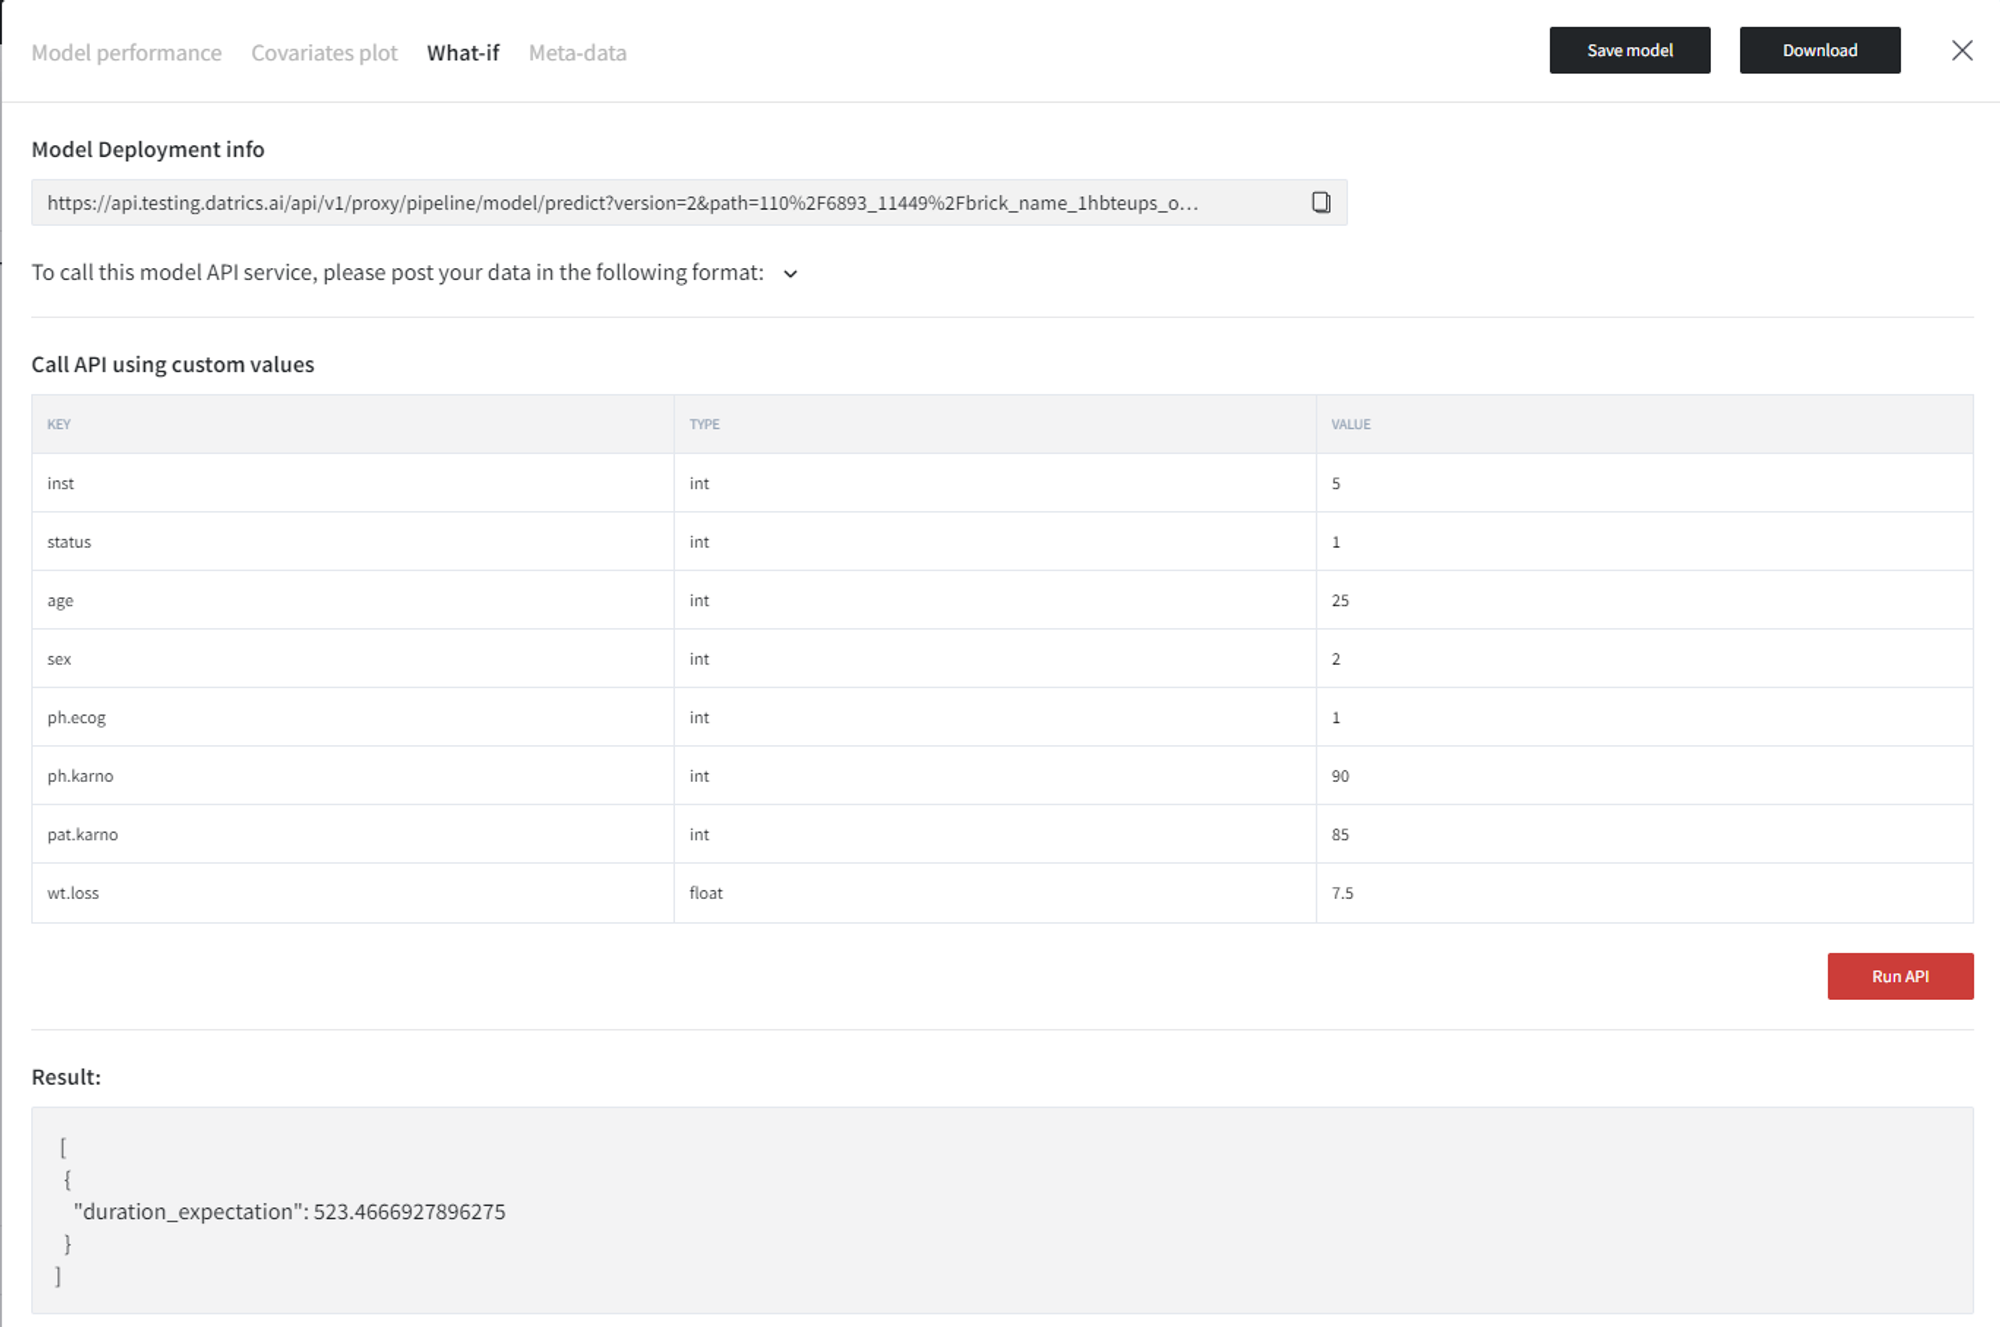
In the What-if tab, you can write down custom parameters to the model and click ‘Run API’ to generate the prediction.
Predict brick
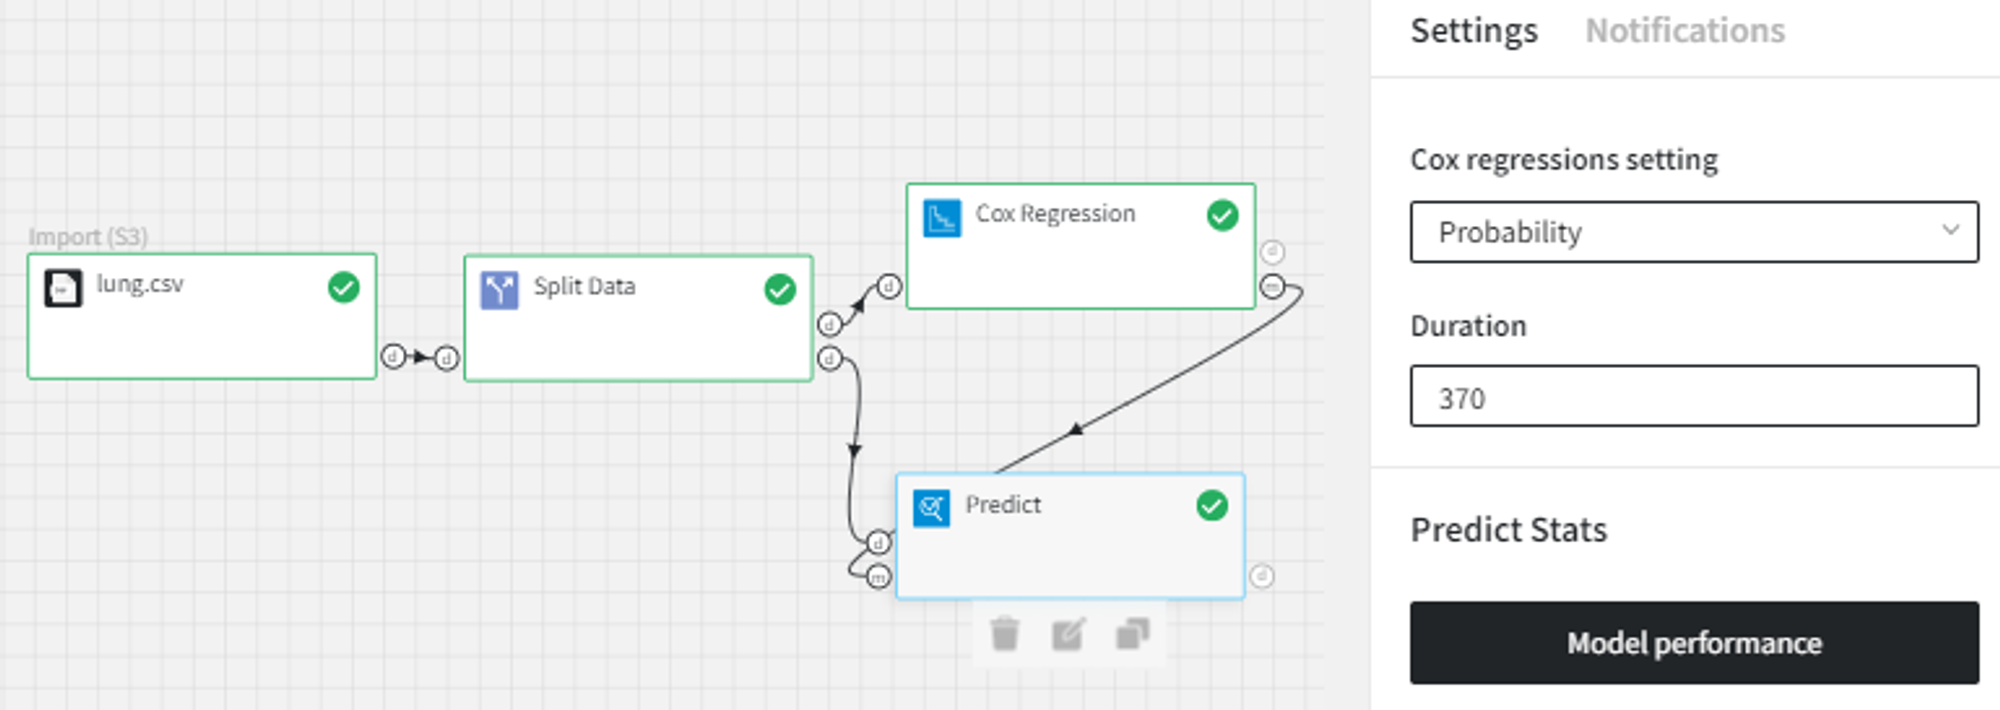
When used with the Cox Regression model, the Predict brick provides a set of parameters:
- Expectation - compute the expected lifetime.
- Partial hazard - returns the partial hazard for the individuals, partial since the baseline hazard is not included.
- Probability + Duration - predicts the probability of survival for the duration of time.
- Cumulative hazard + Duration - predicts the cumulative hazard for the duration of time.
- Median - predicts the median lifetimes for the individuals.
- Percentile - predicts the percentile (median by default) lifetimes for the individuals.
For example, we can predict the probability of survival for each individual in 370 days:
The Predict brick’s output dataset has the following structure:
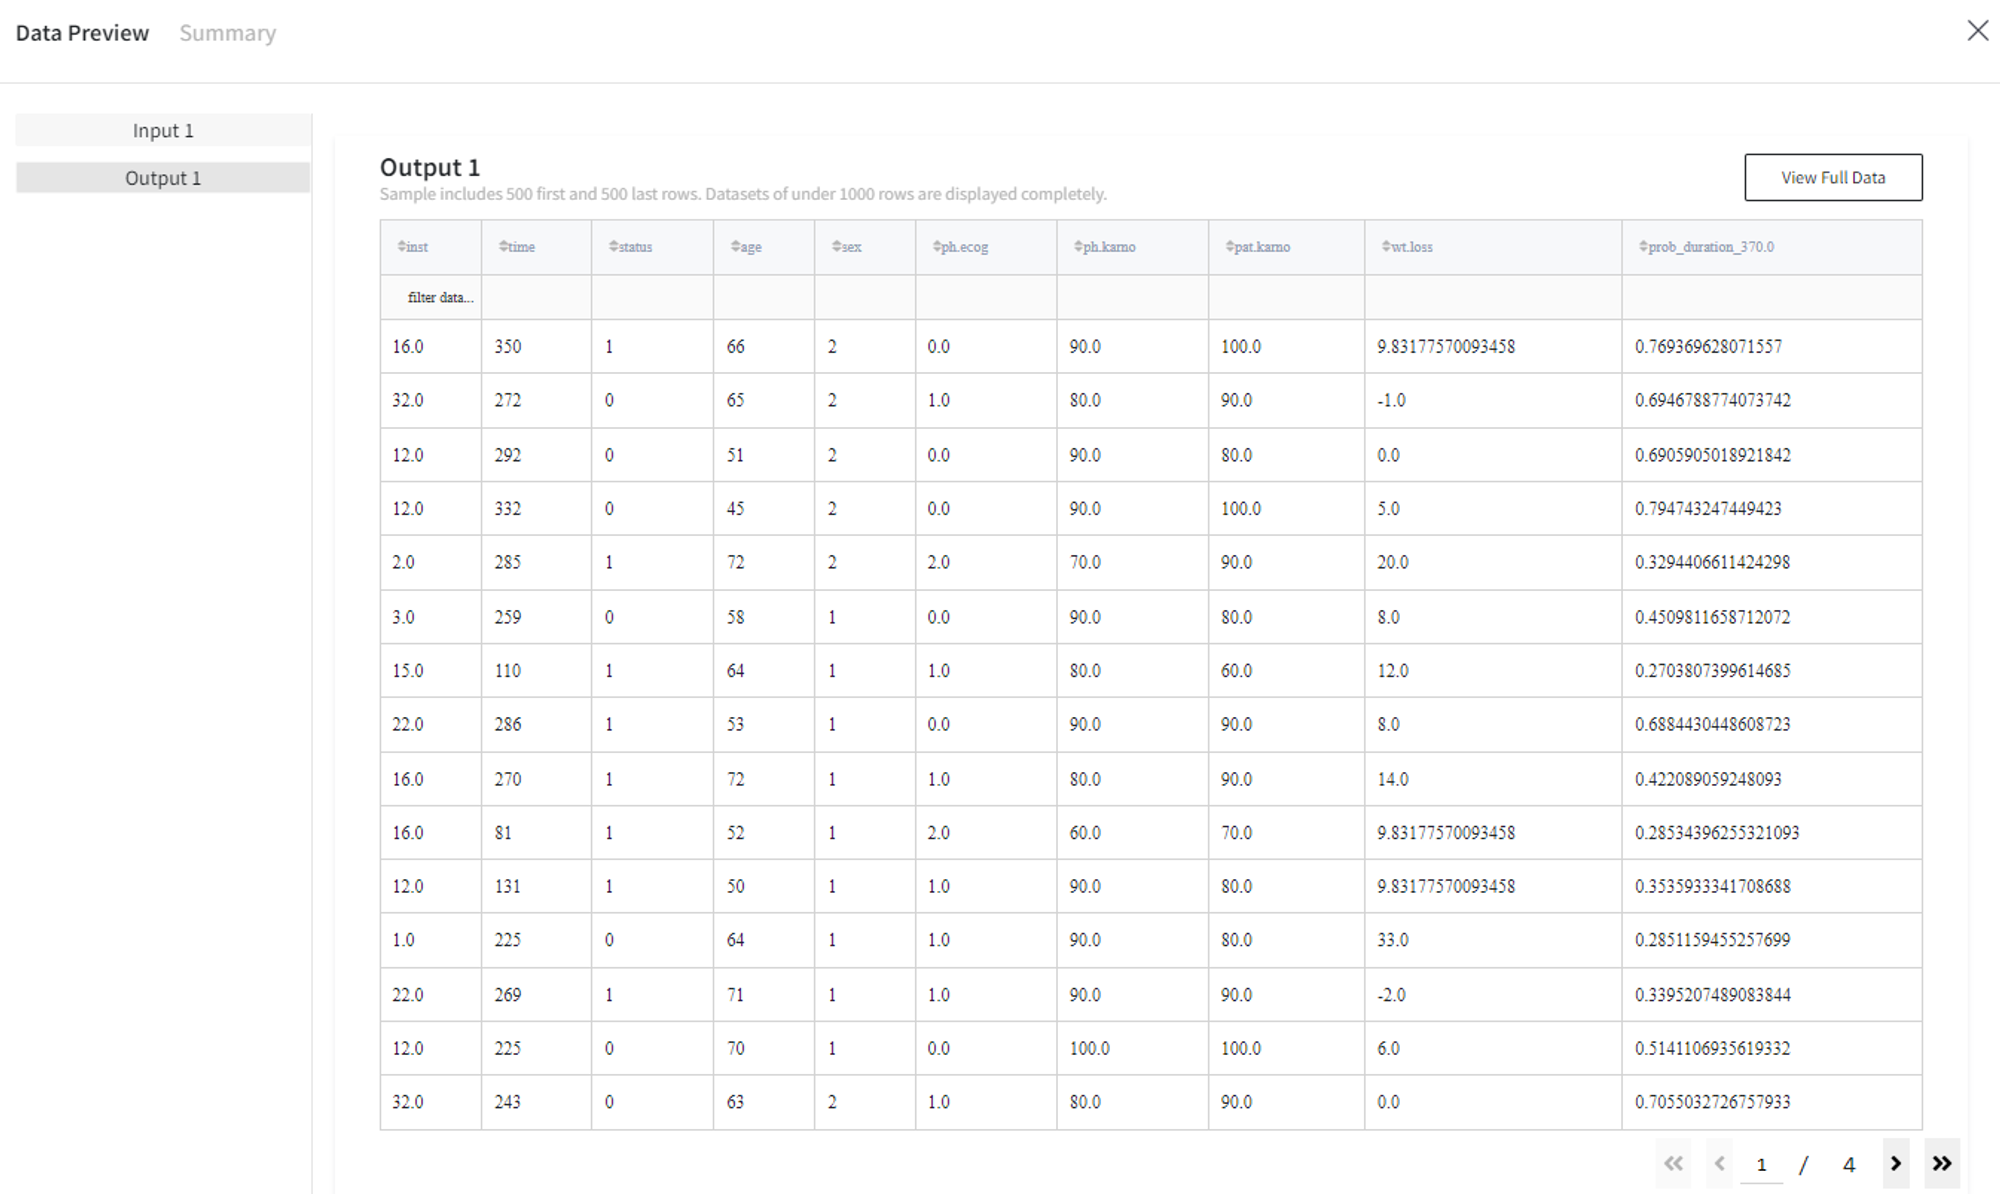
As was expected, the survival probability for patients with Sex=2 is higher than for the opposite group: