1. Create a new pipeline
To start your analysis, create a new Project and a new Pipeline. Give the pipeline the name to easier identify it further.
2. Upload your data to the pipeline
Every analysis starts with data, thus the first step in the pipeline is data upload.
Create the dataset
You may drag-and-drop your file to the scene (1), create a new dataset (3) or move the dataset from the left panel to the scene (2).

In the example below we are using home_prices_sample.csv
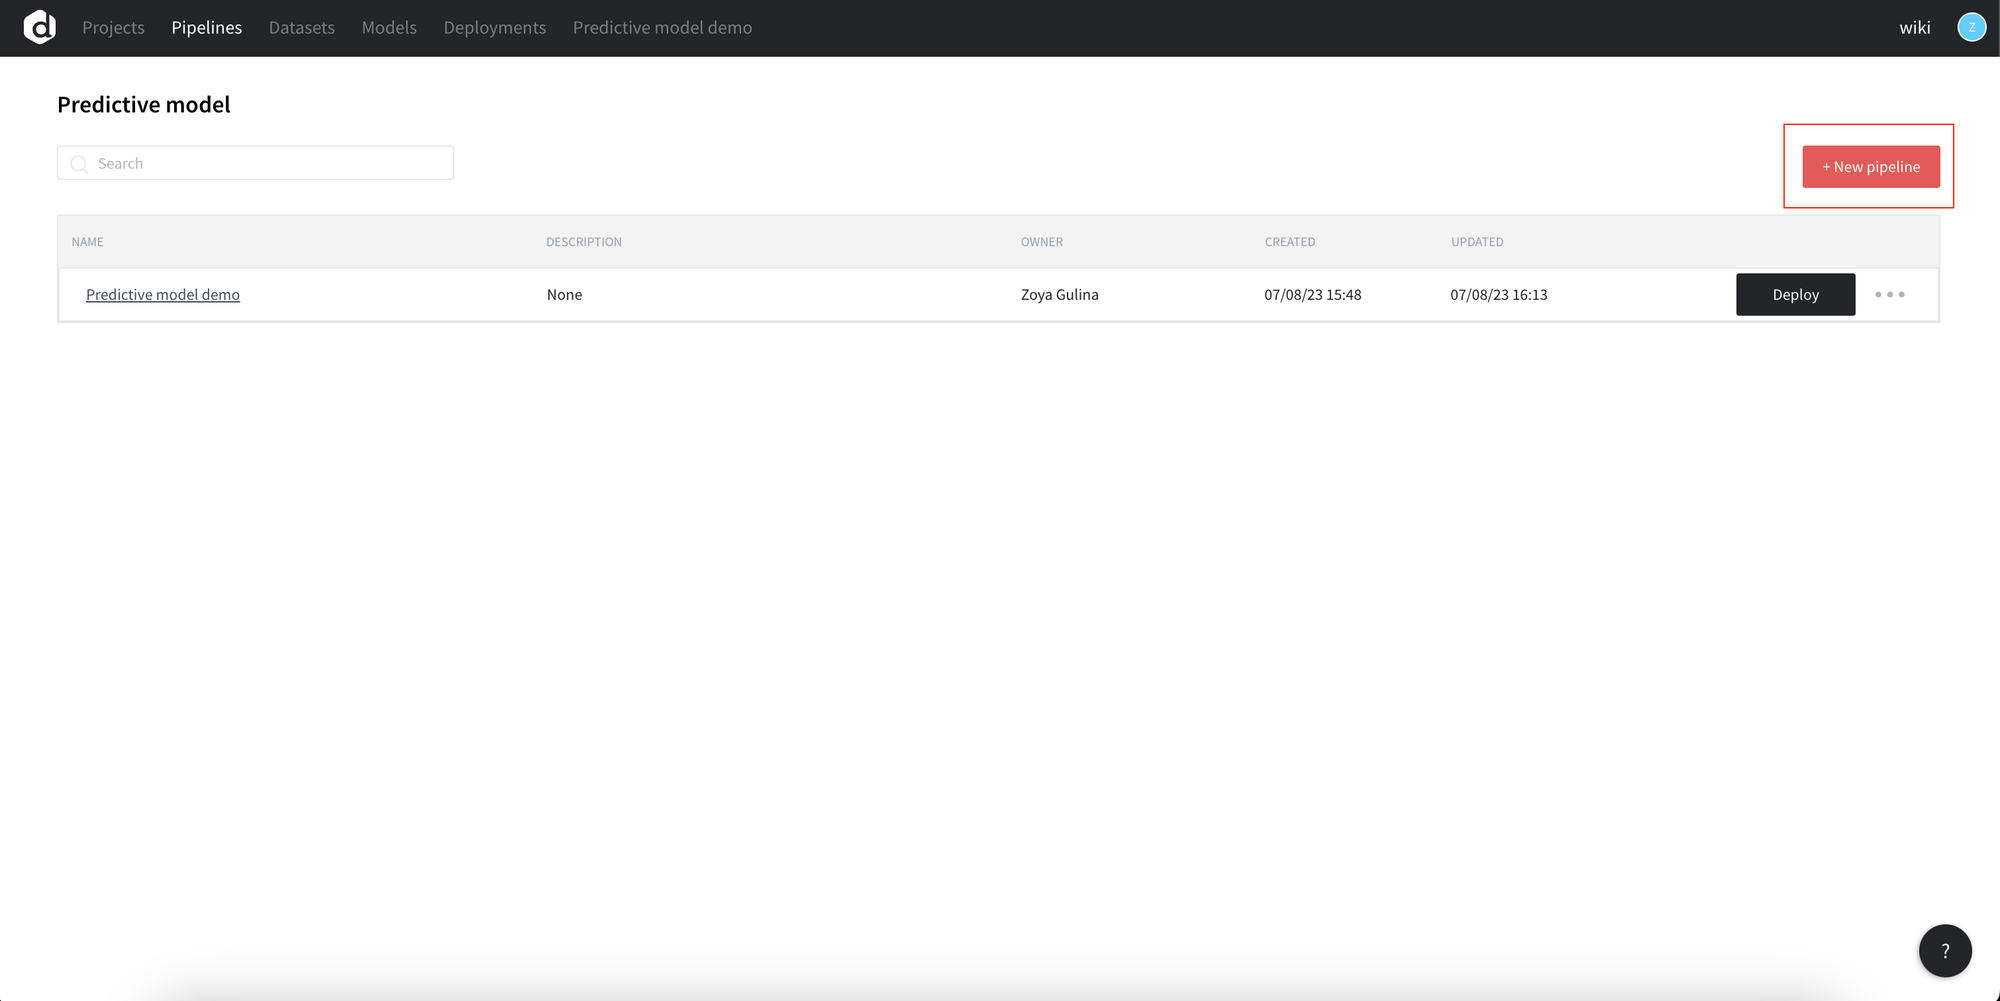
Review and upload the data
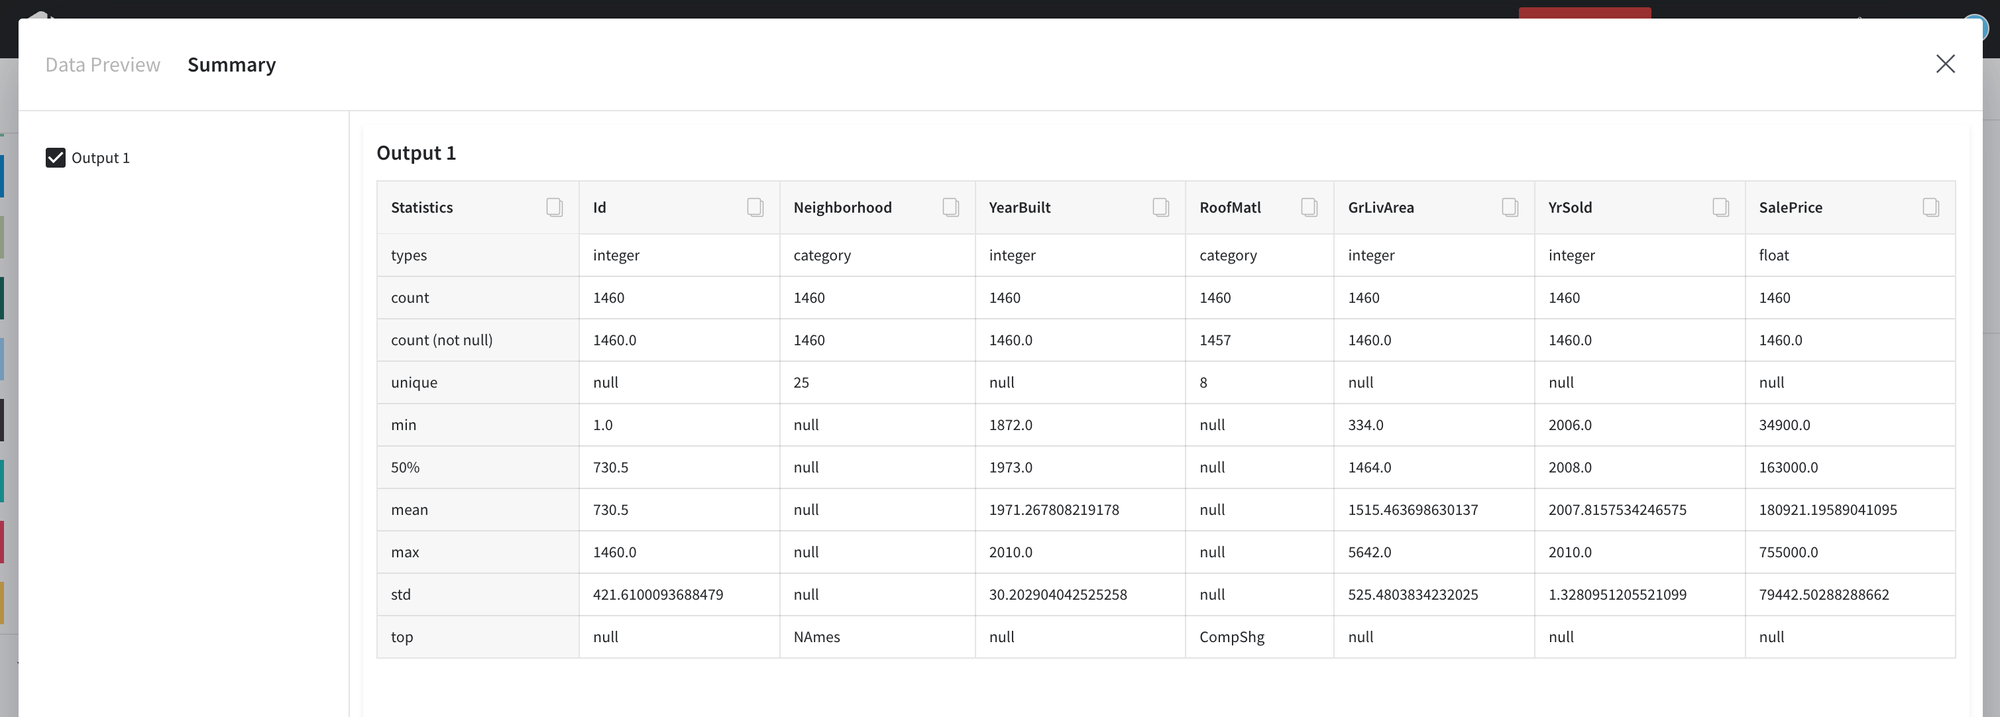
After you have added the data set to the scene, you may run the pipeline(1) to upload the data and review the data summary.
Data preview and summary are available under “View Data details”(2).

There are 2 tabs: Data Preview displays the sample of the dataset, Summary displays the list of the statistics for the entire dataset.
3. Build first pipeline
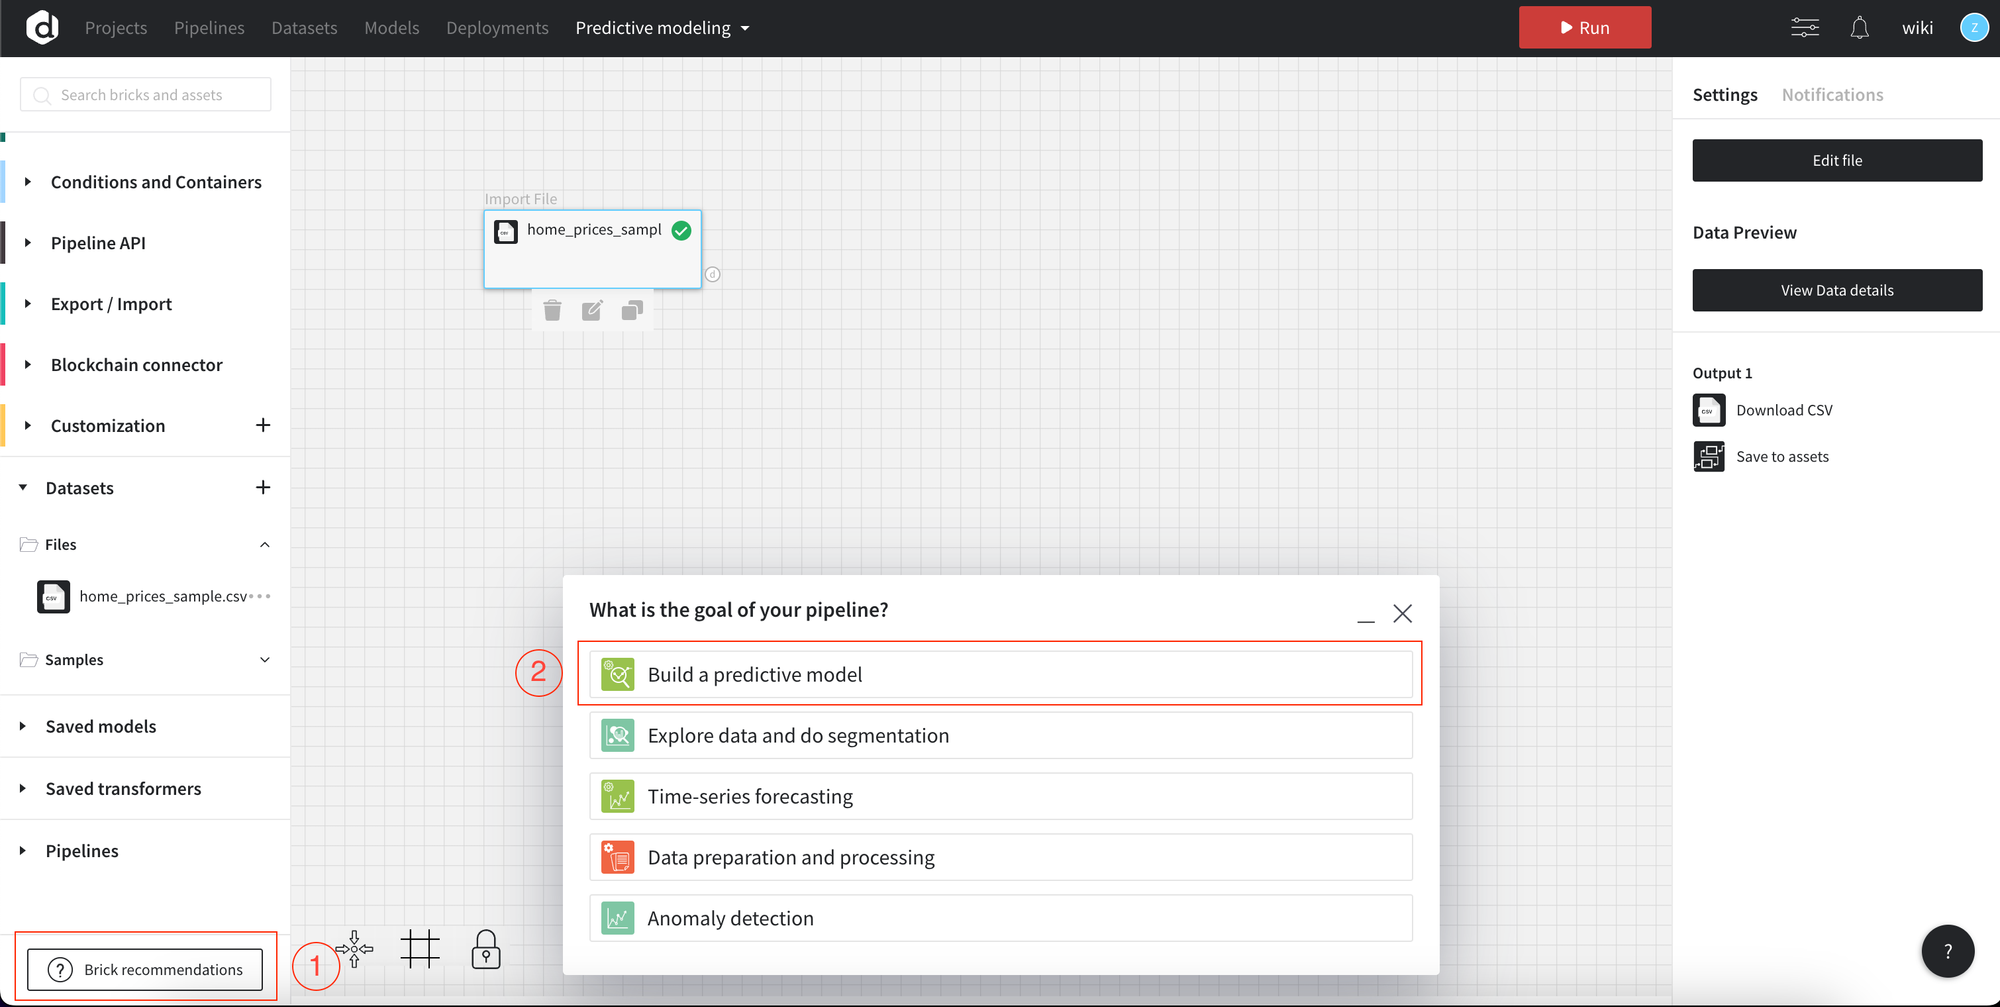
For the first pipeline, let’s try to use Brick recommendation (1).
There’s the list of goals you may choose and the we will guide you through the process of building the pipeline.
Let’s choose “Build a predictive model” (2).
4. Data Preparation
The next step is to clean and process the data for the further analysis. We have a set of functions available for data transformation and manipulation. You may browse through the list of bricks or search for them.
- Add the brick to the canvas
To use the brick drag-and-drop it from the left panel to the scene (canvas) and connect output of the dataset.
The platform suggests us to use Auto Data Preparation brick. The brick combines multiple transformations and automatically suggests the transformation rules. More details about Data transformation.
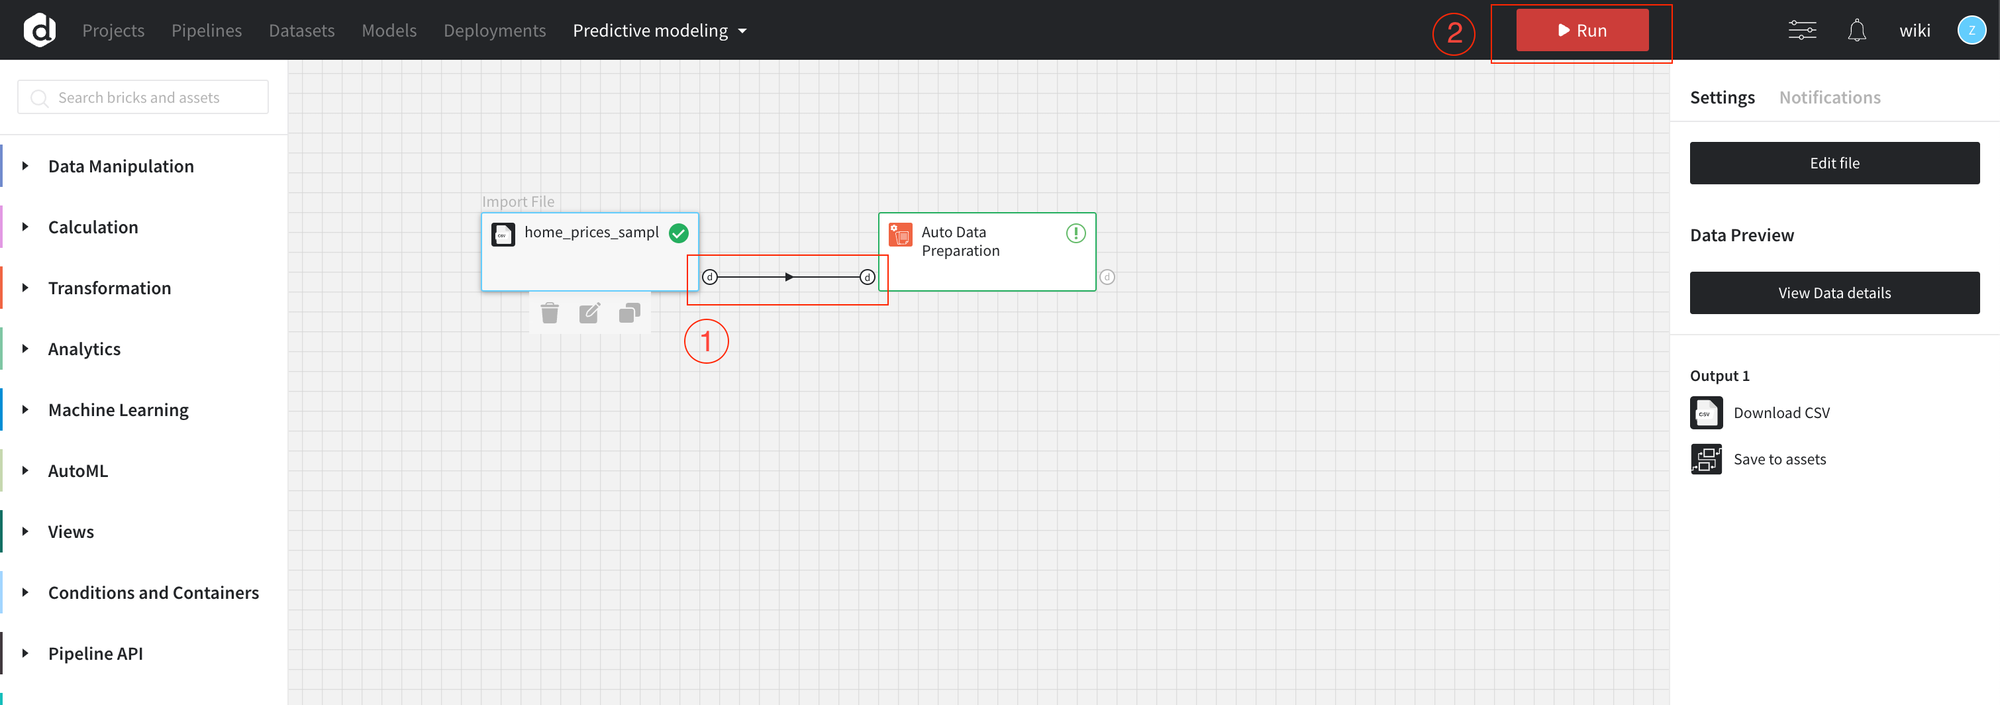
Connect the bricks on the canvas by dragging an arrow from the output of the dataset brick to the input of the Auto Data Preparation brick.
- Run the pipeline
- Open dashboard settings
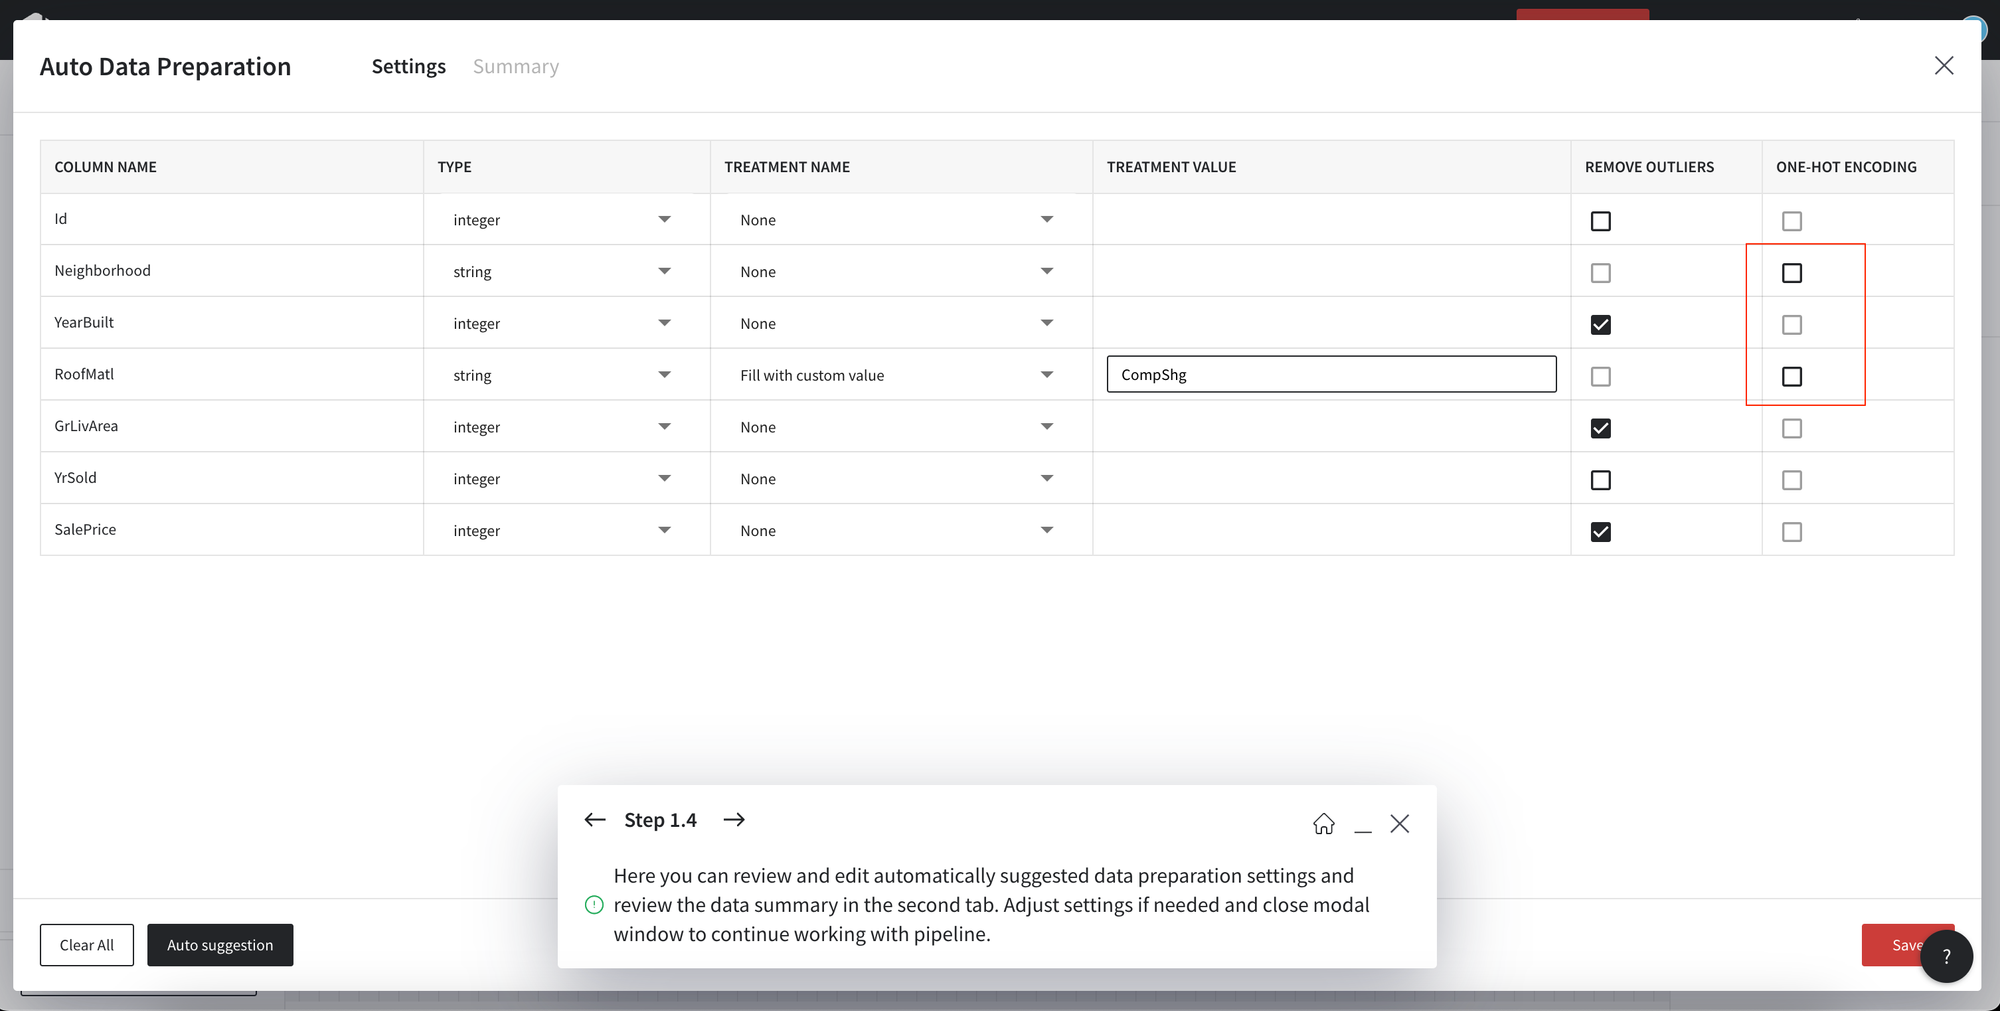
In the dashboard settings, you may see the transformation suggested for the data.
For the example purposes, we will remove One-hot encoding for the string fields. To apply the changes press Save, close the dashboard and Run pipeline.
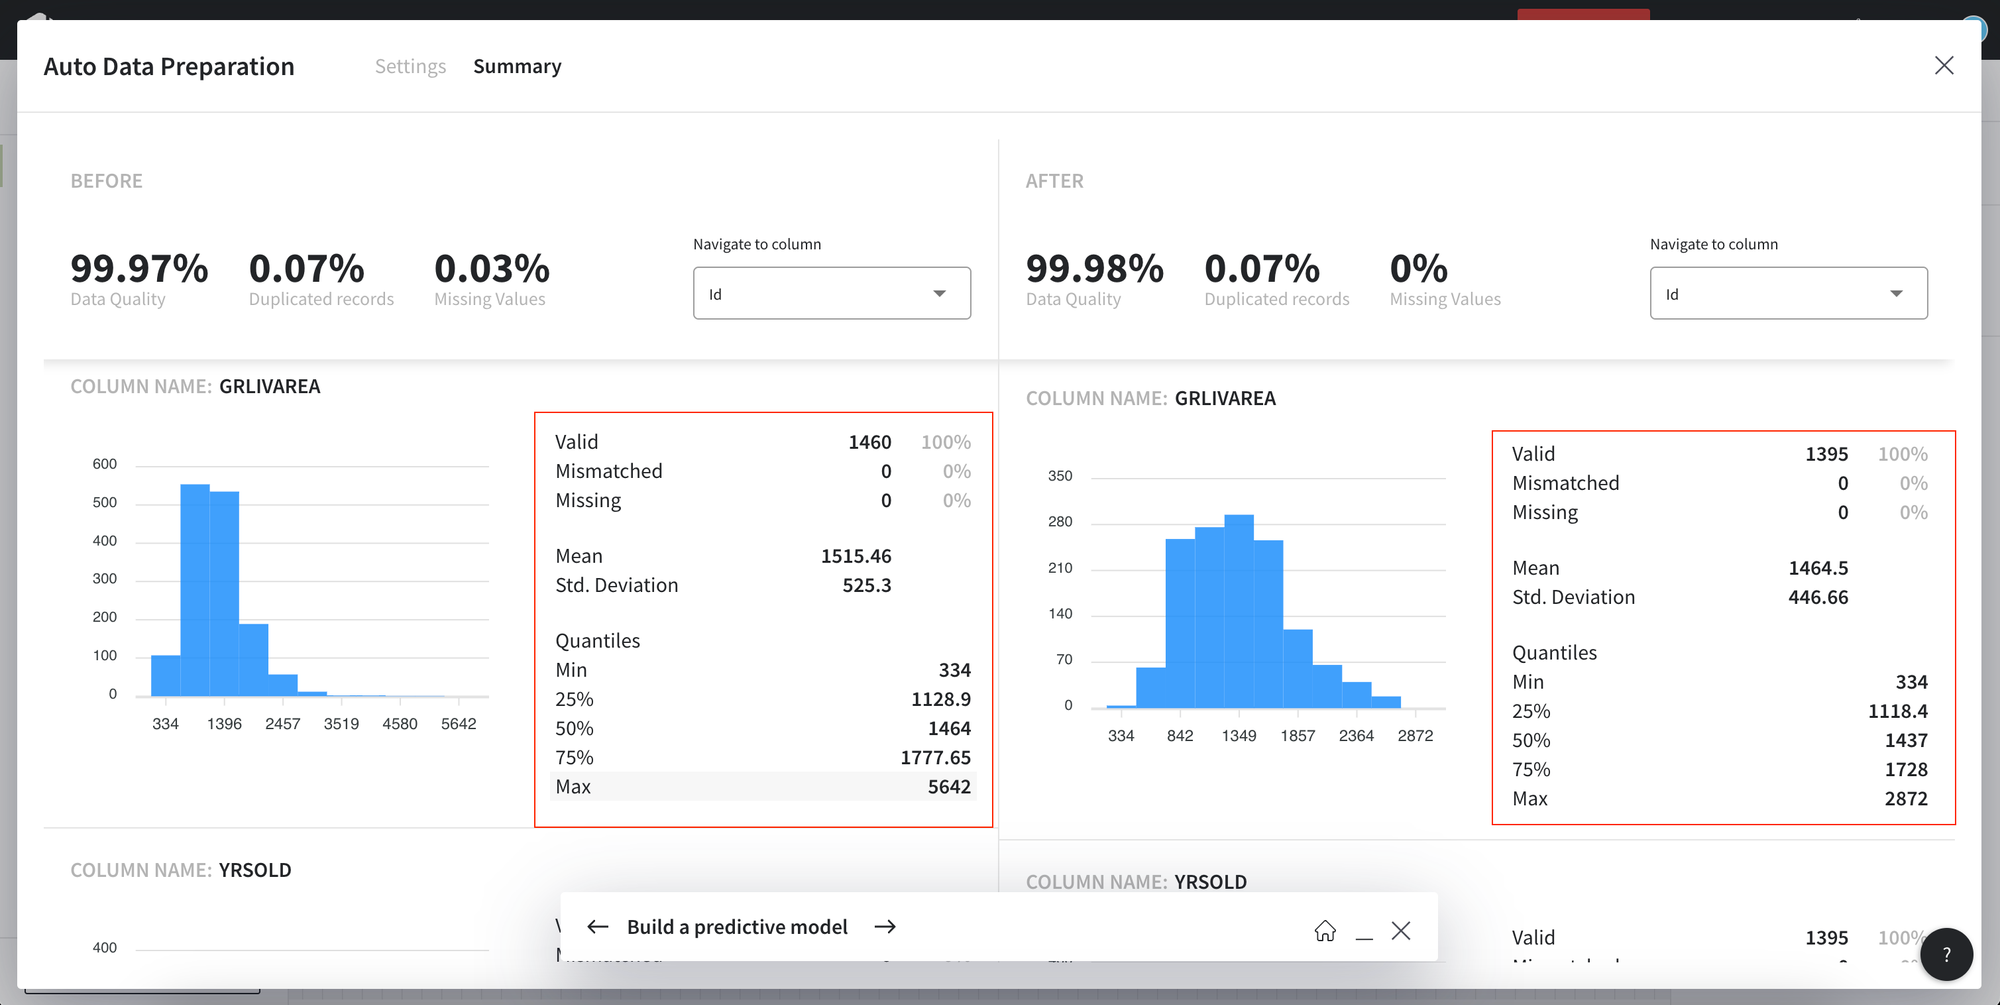
Summary tab provides the insights into the changes applied.
- Data preview
Open Data Preview if you would like to view the data sample or full data.
5. Split the data for training and testing
Find the Split Data brick and connect to the Data Preparation. This step allows you to train the model on the subset of data.
6. Predictive modeling
- Drop the AutoML Predictive Model
Drop the AutoML Predictive Model brick to the canvas and connect to the Train data from the Split Data brick.
Then setup the Target variable (1) and Run the pipeline (2).

- Open model view
Model performance consists of the model metrics and plots.
Classification
- Supported metrics: accuracy, precision, recall, f1-score, ROC AUC, Gini
Regression
- Supported metrics: RMSE, MAPE, R2
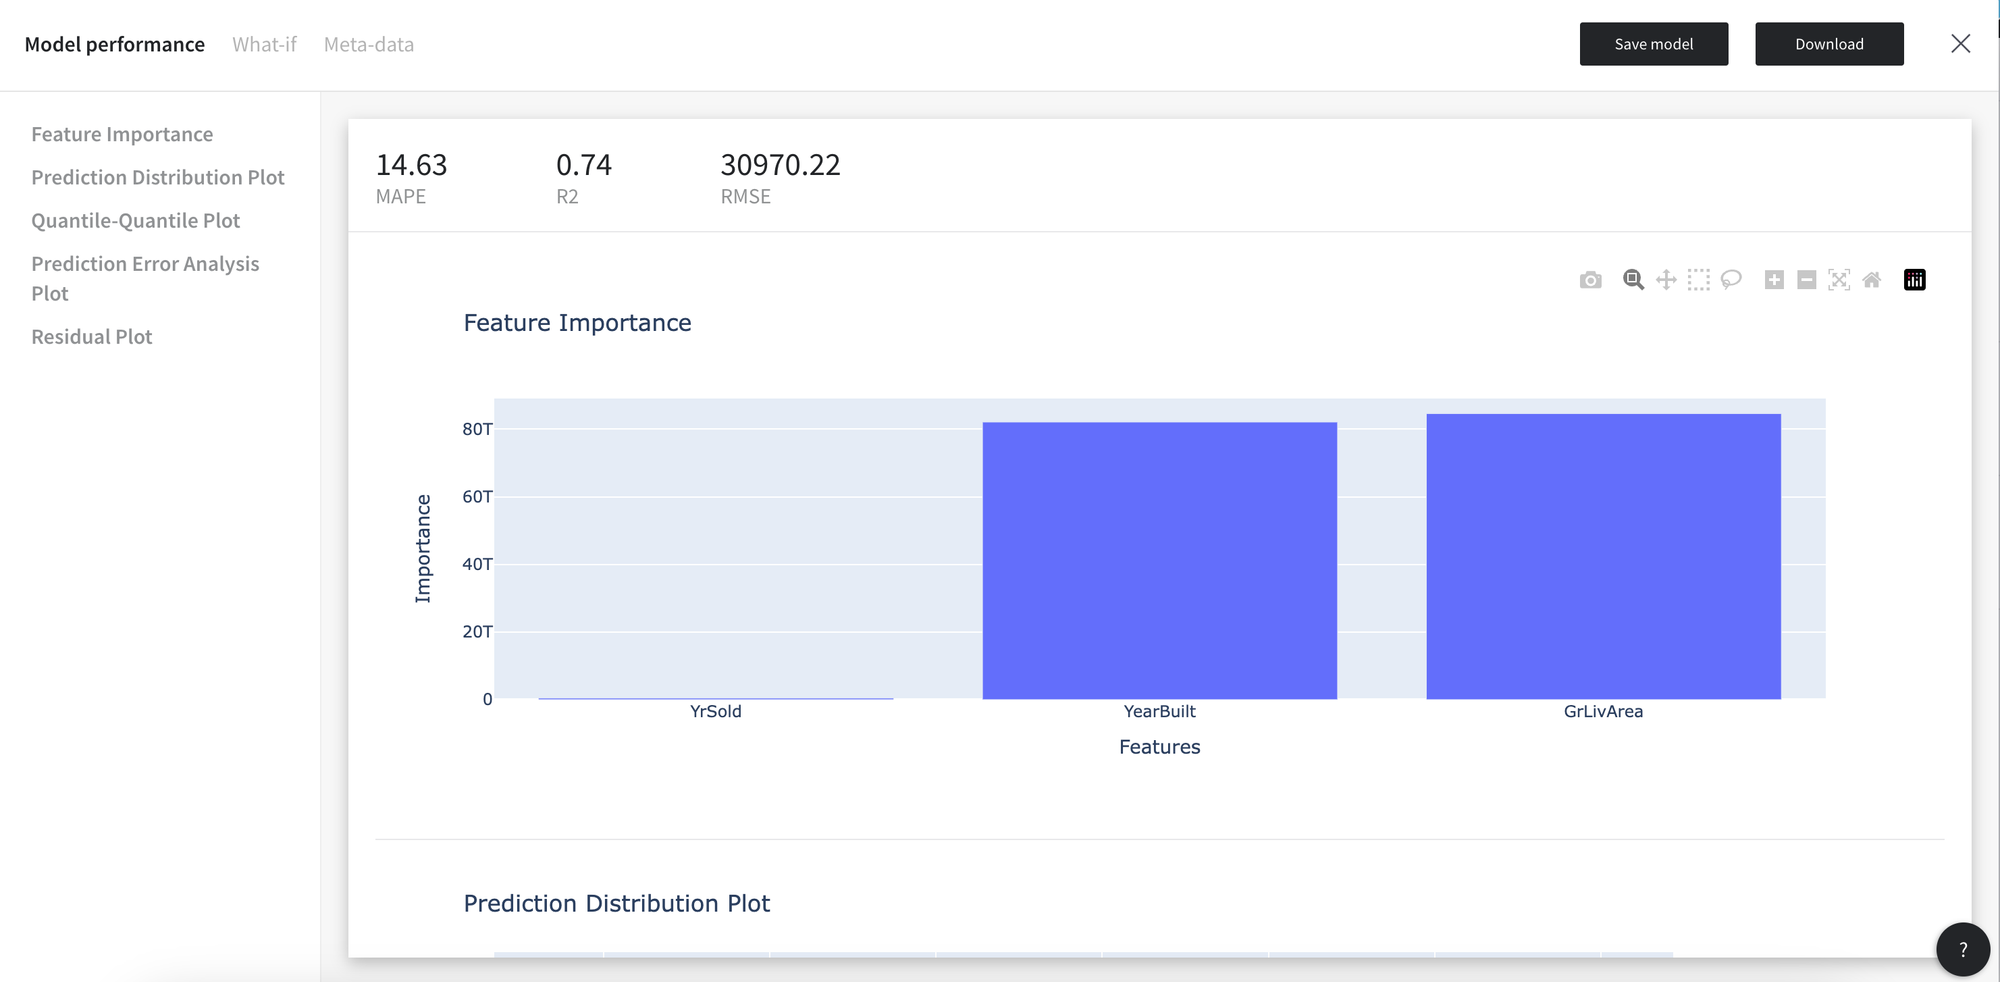
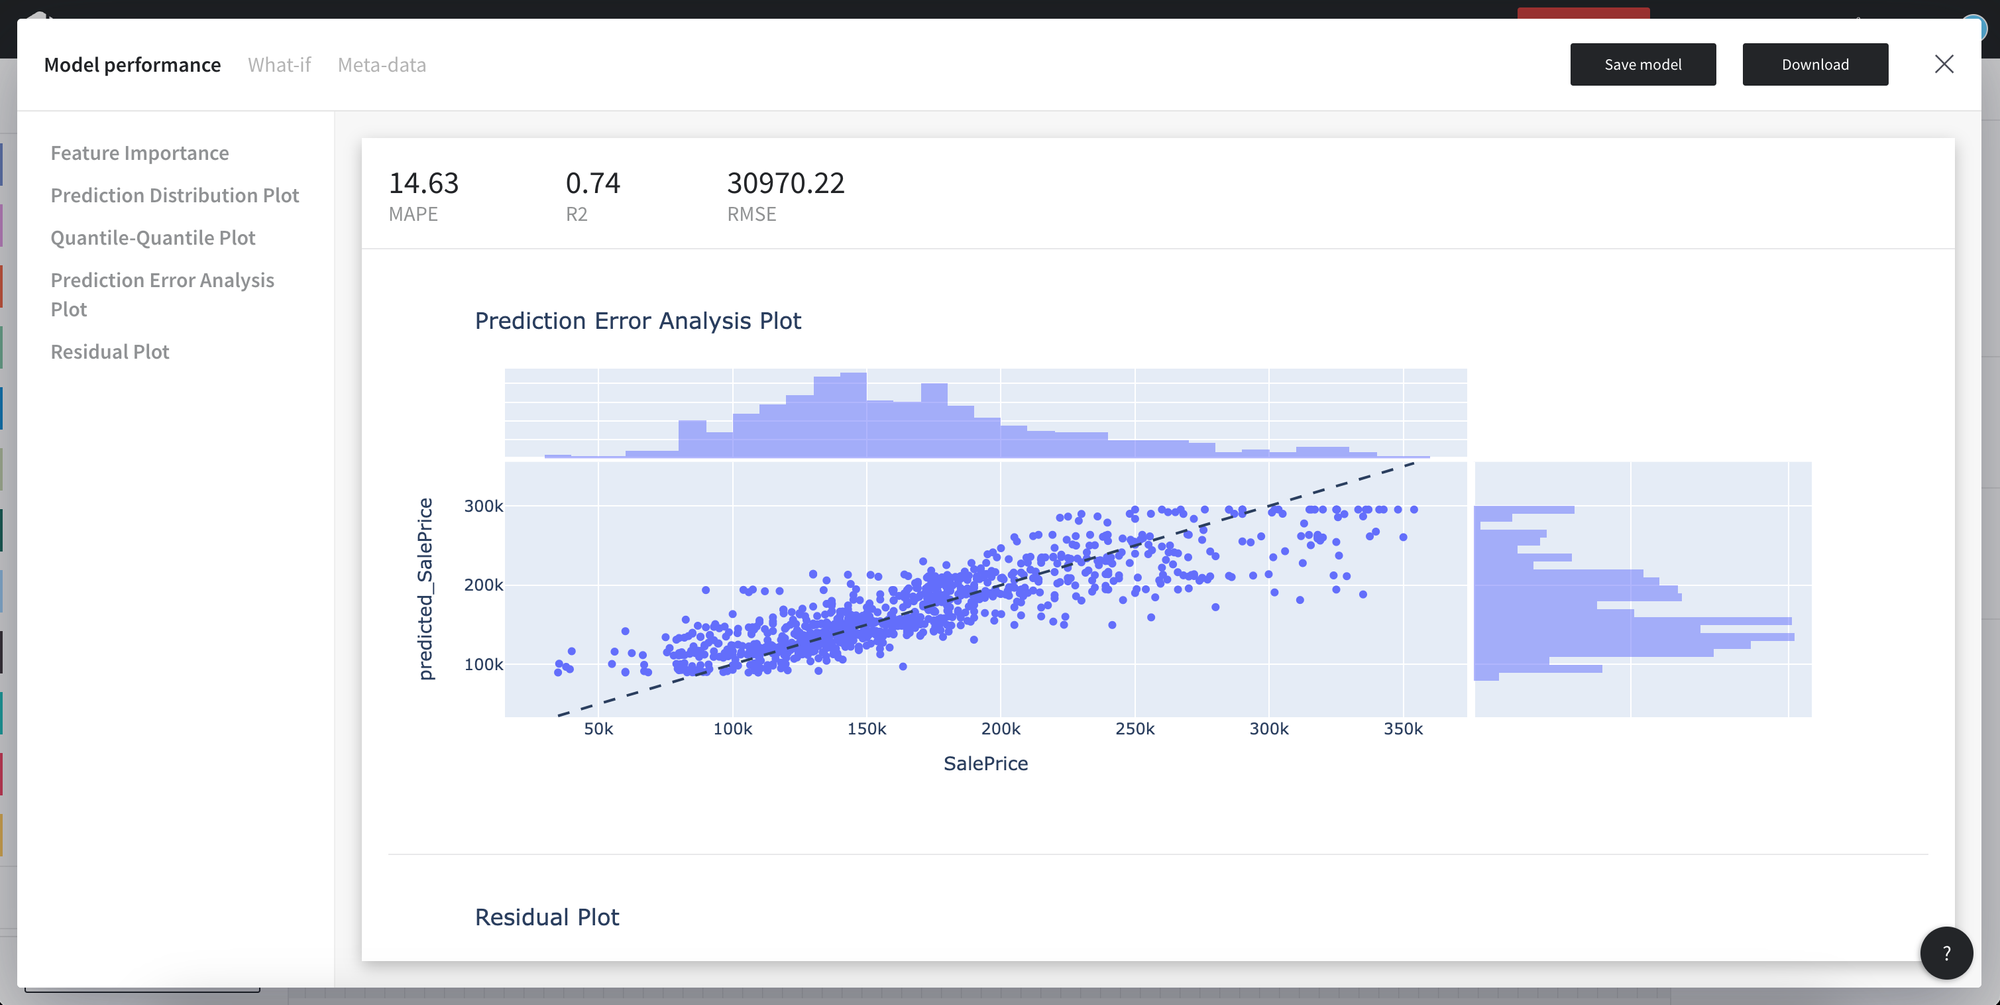
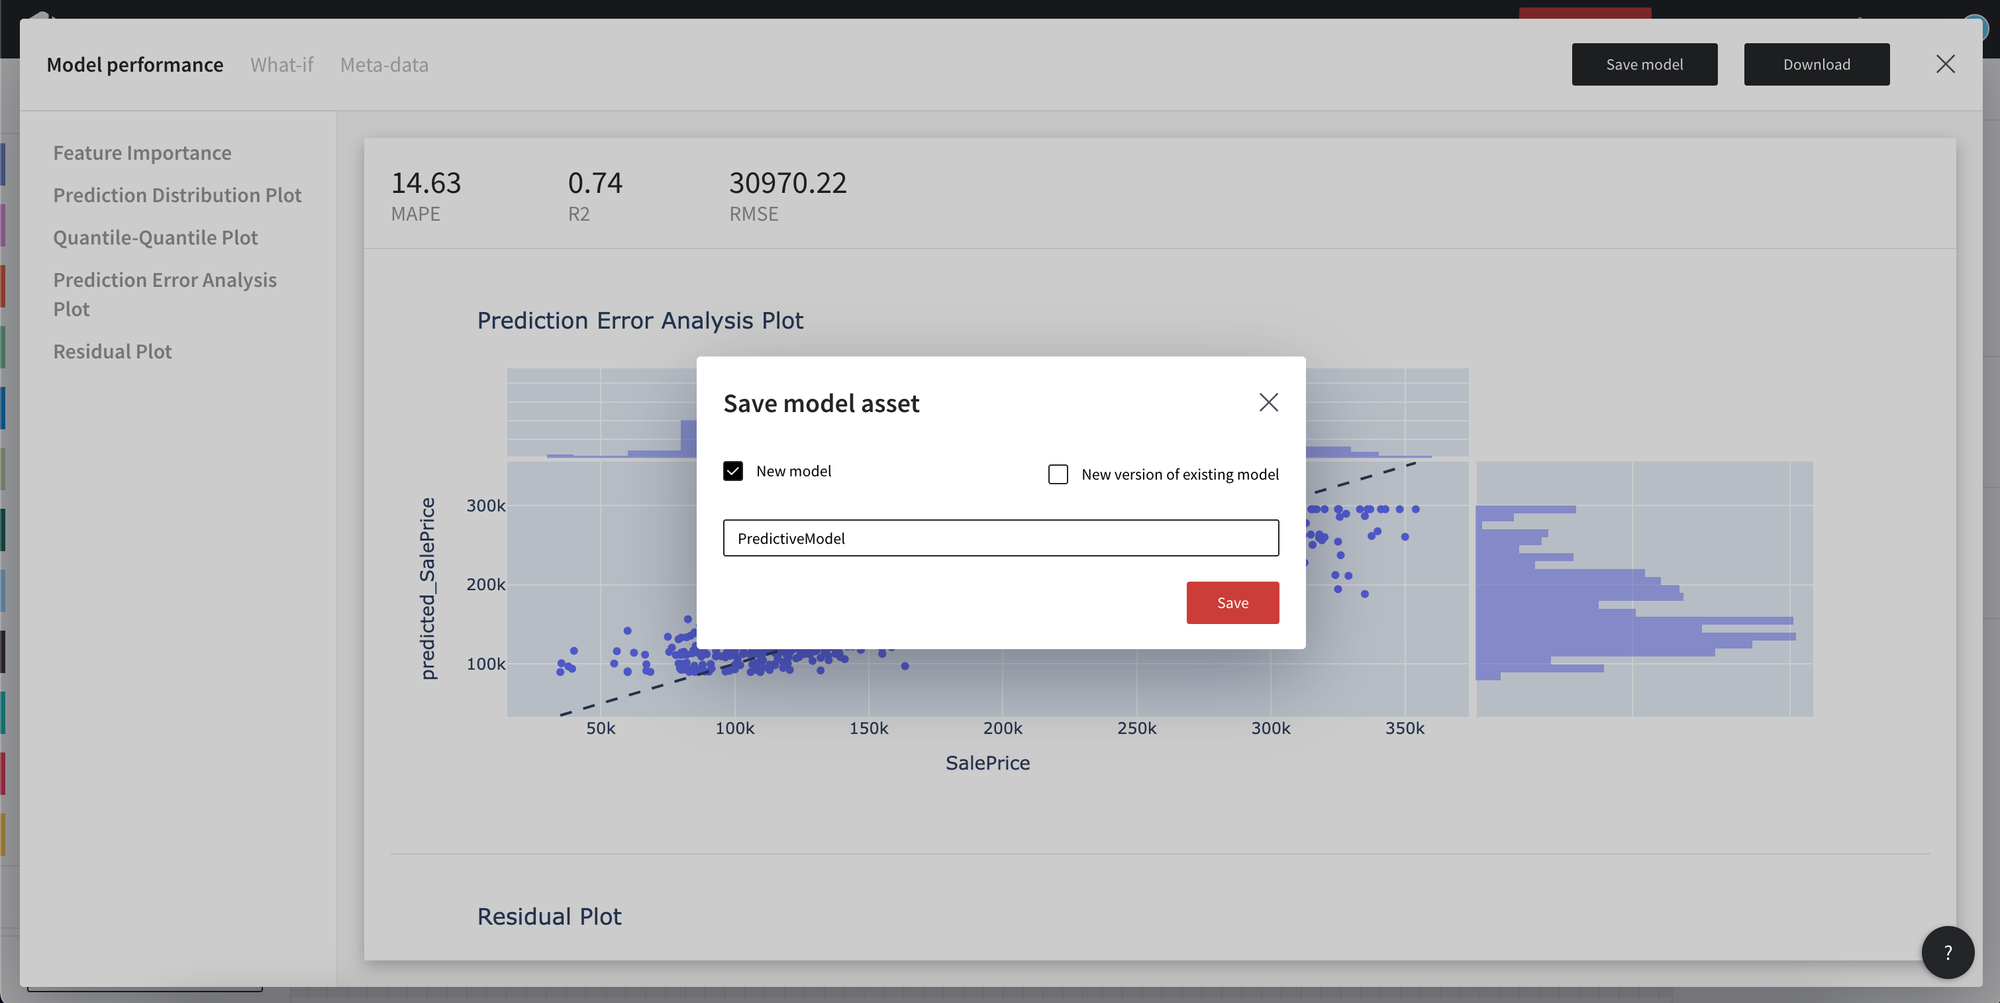
You may download the model in the json format or save models to the assets from the Model view.
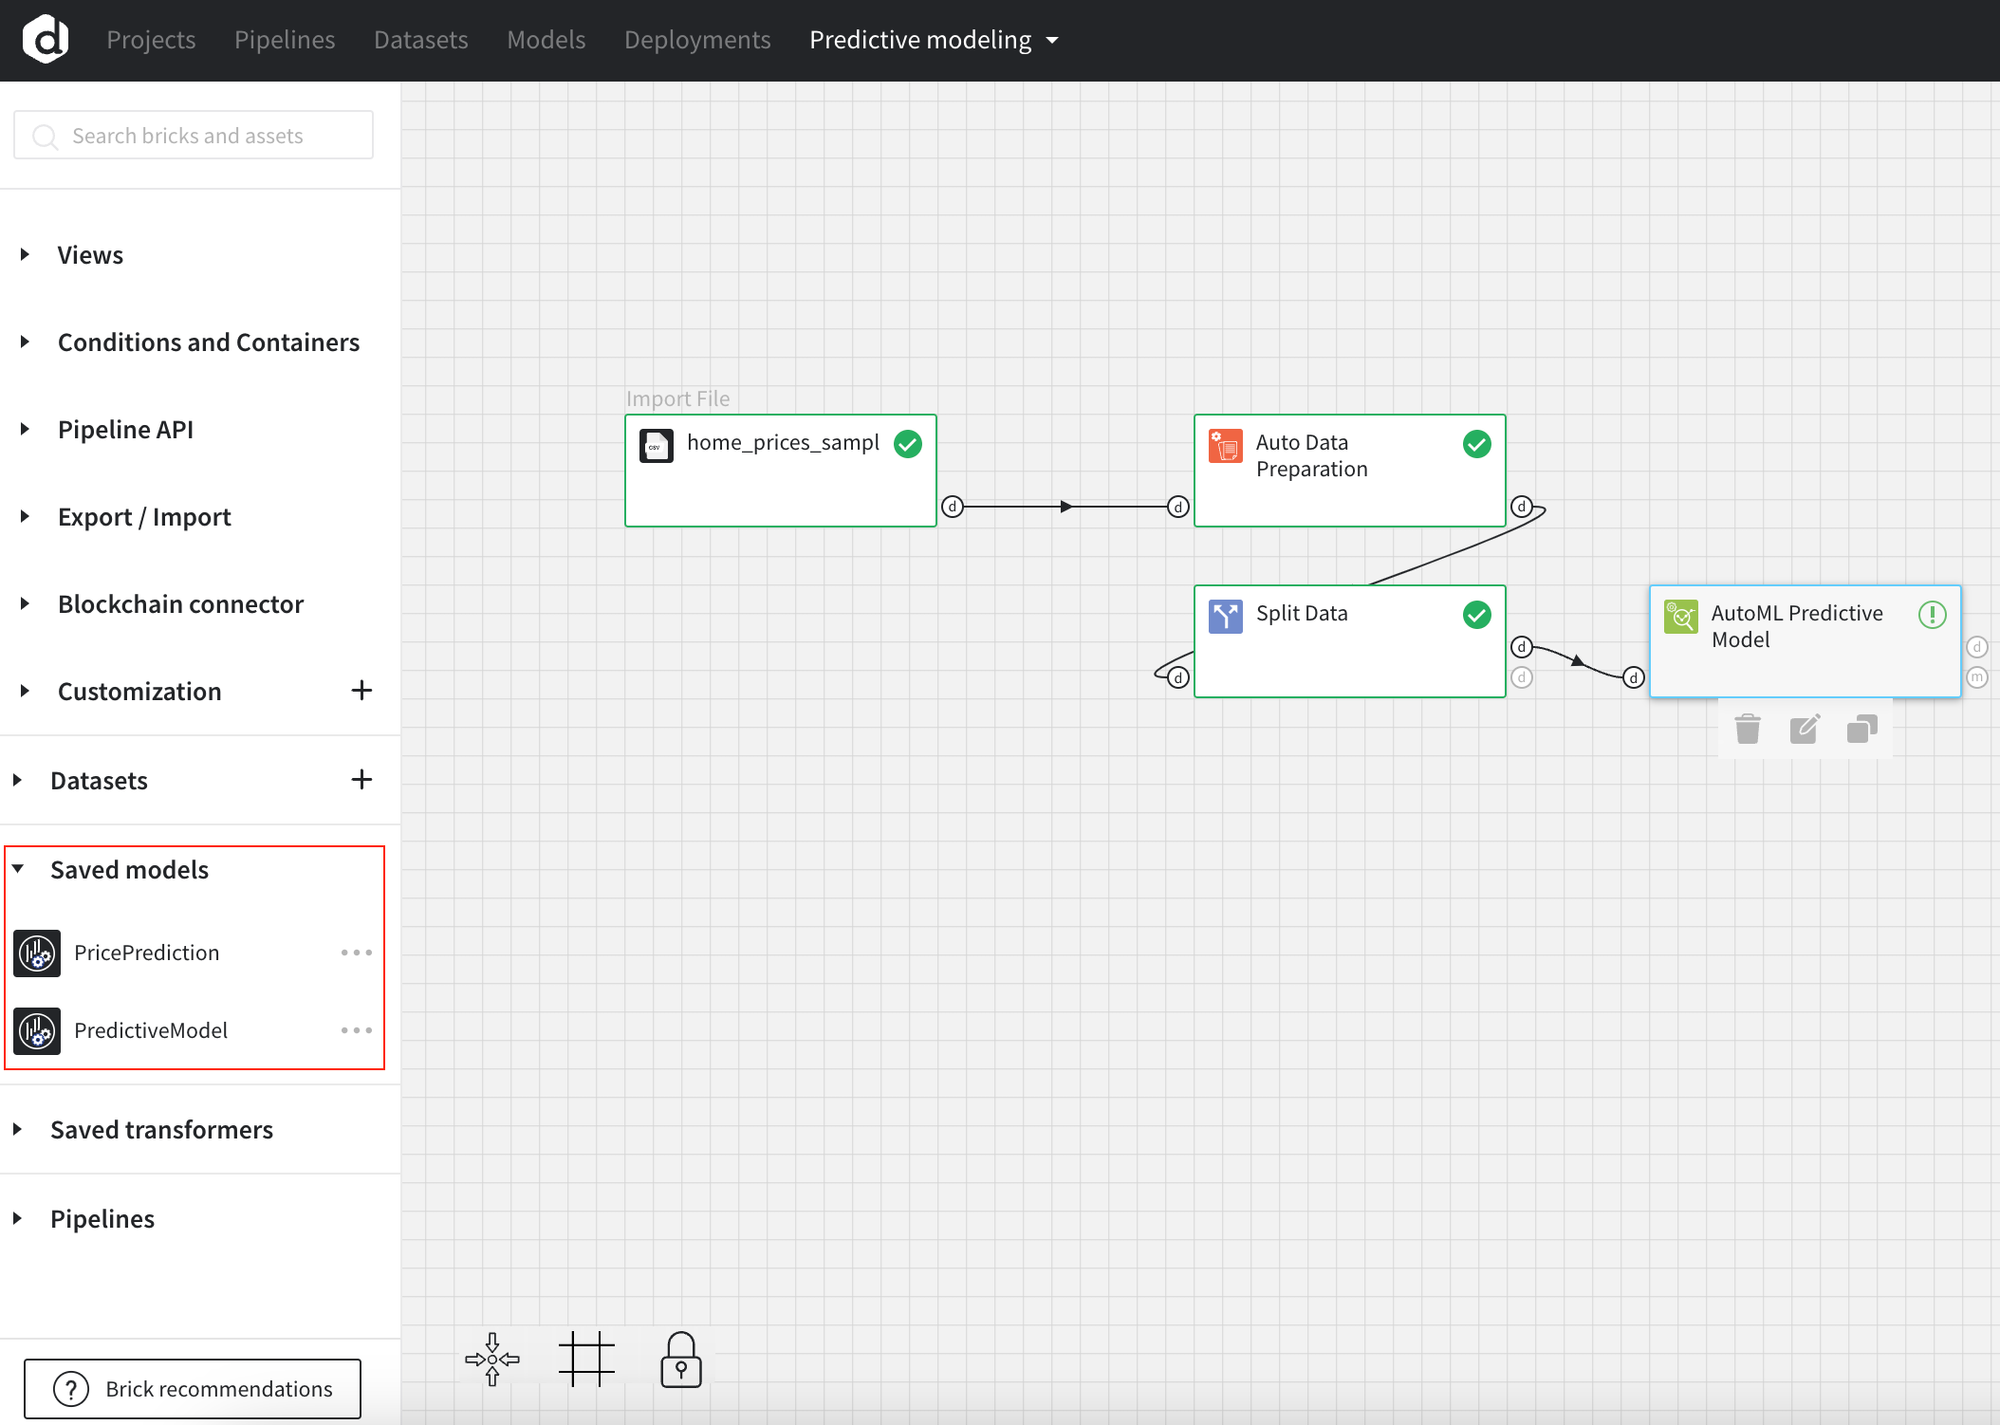
Models saved to the assets maybe used in the other pipelines.
- Save the model with the name
- Models available in the “Saved models”
- Predicted values
To review the predicted values open the View Data details. The new column is added to the dataframe - predicted_SalePrice.

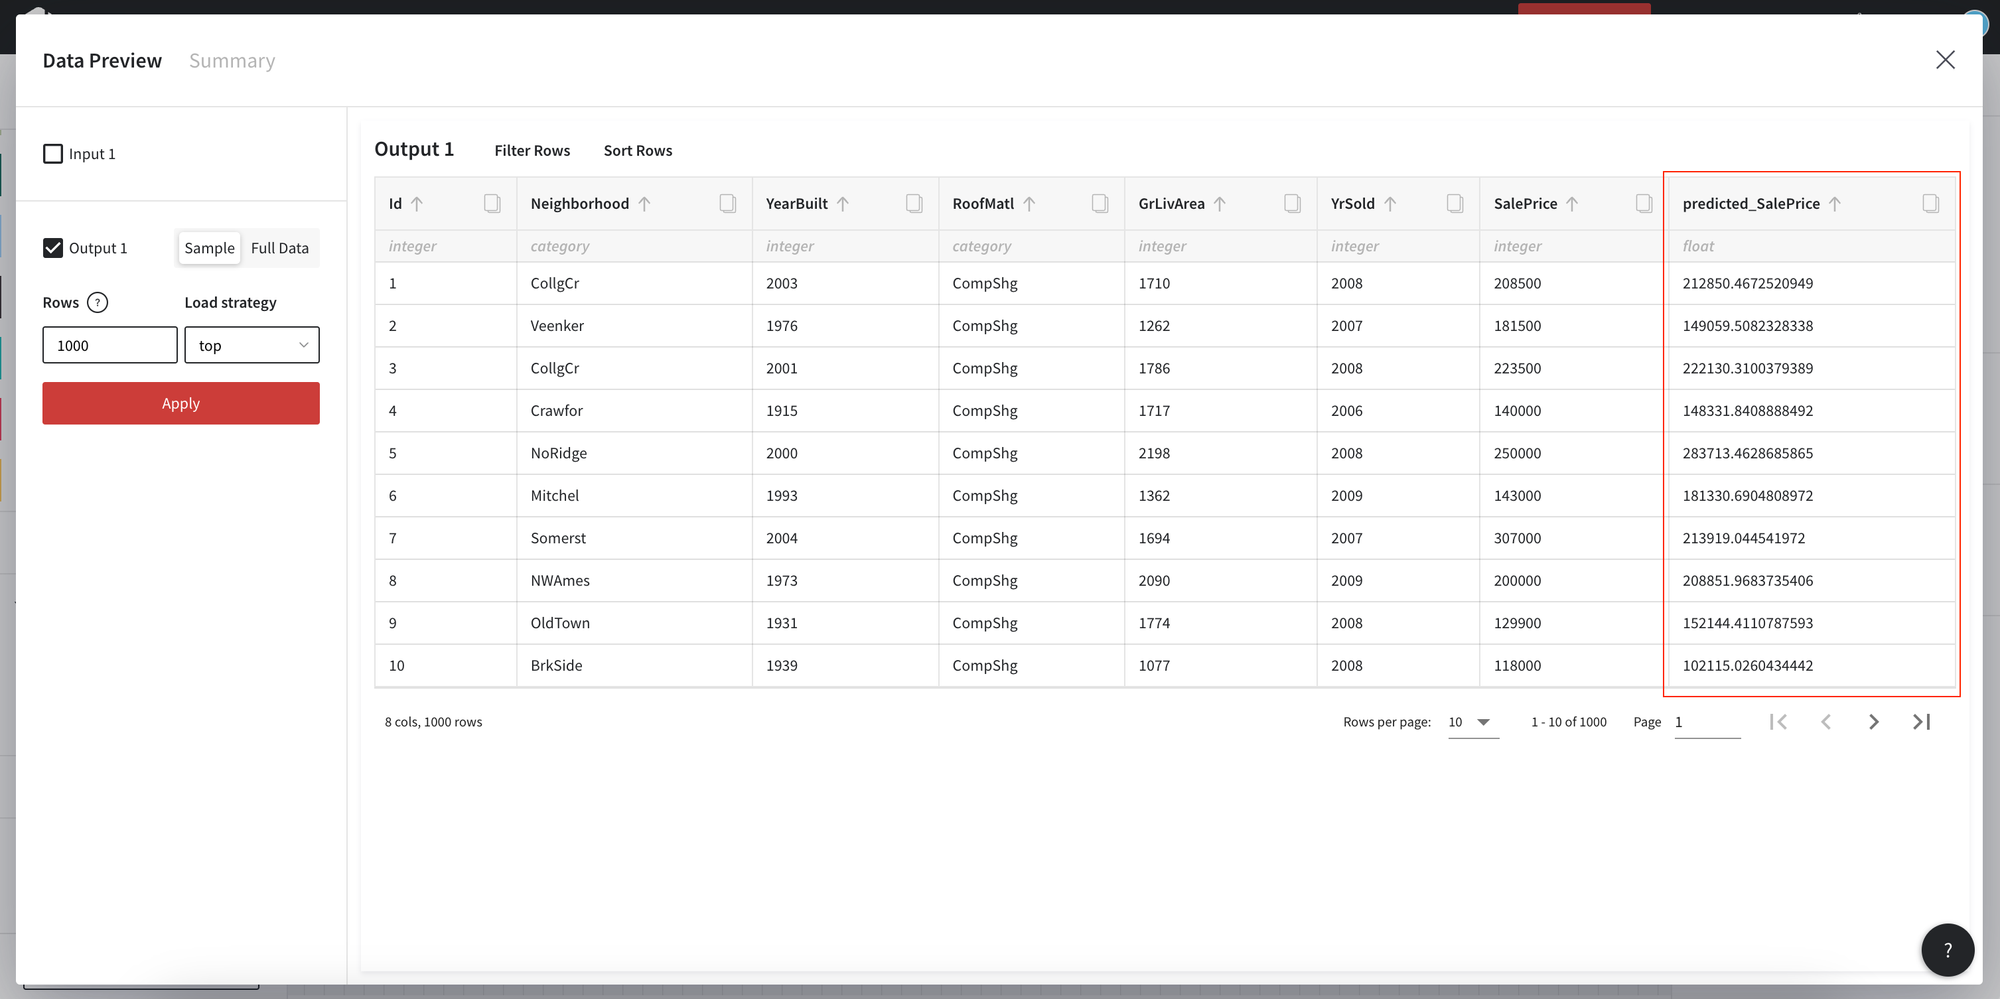
Output of the AutoML Predictive modeling brick - data frame with the predicted values and a trained model.
7. Use the trained model
After we have trained the model, let’s test the performance on the test data sample.
- Find the Predict brick in the list.
- Connect the inputs to the Predict brick
Connect the data from the Split Data and model from the AutoML Predictive Model.
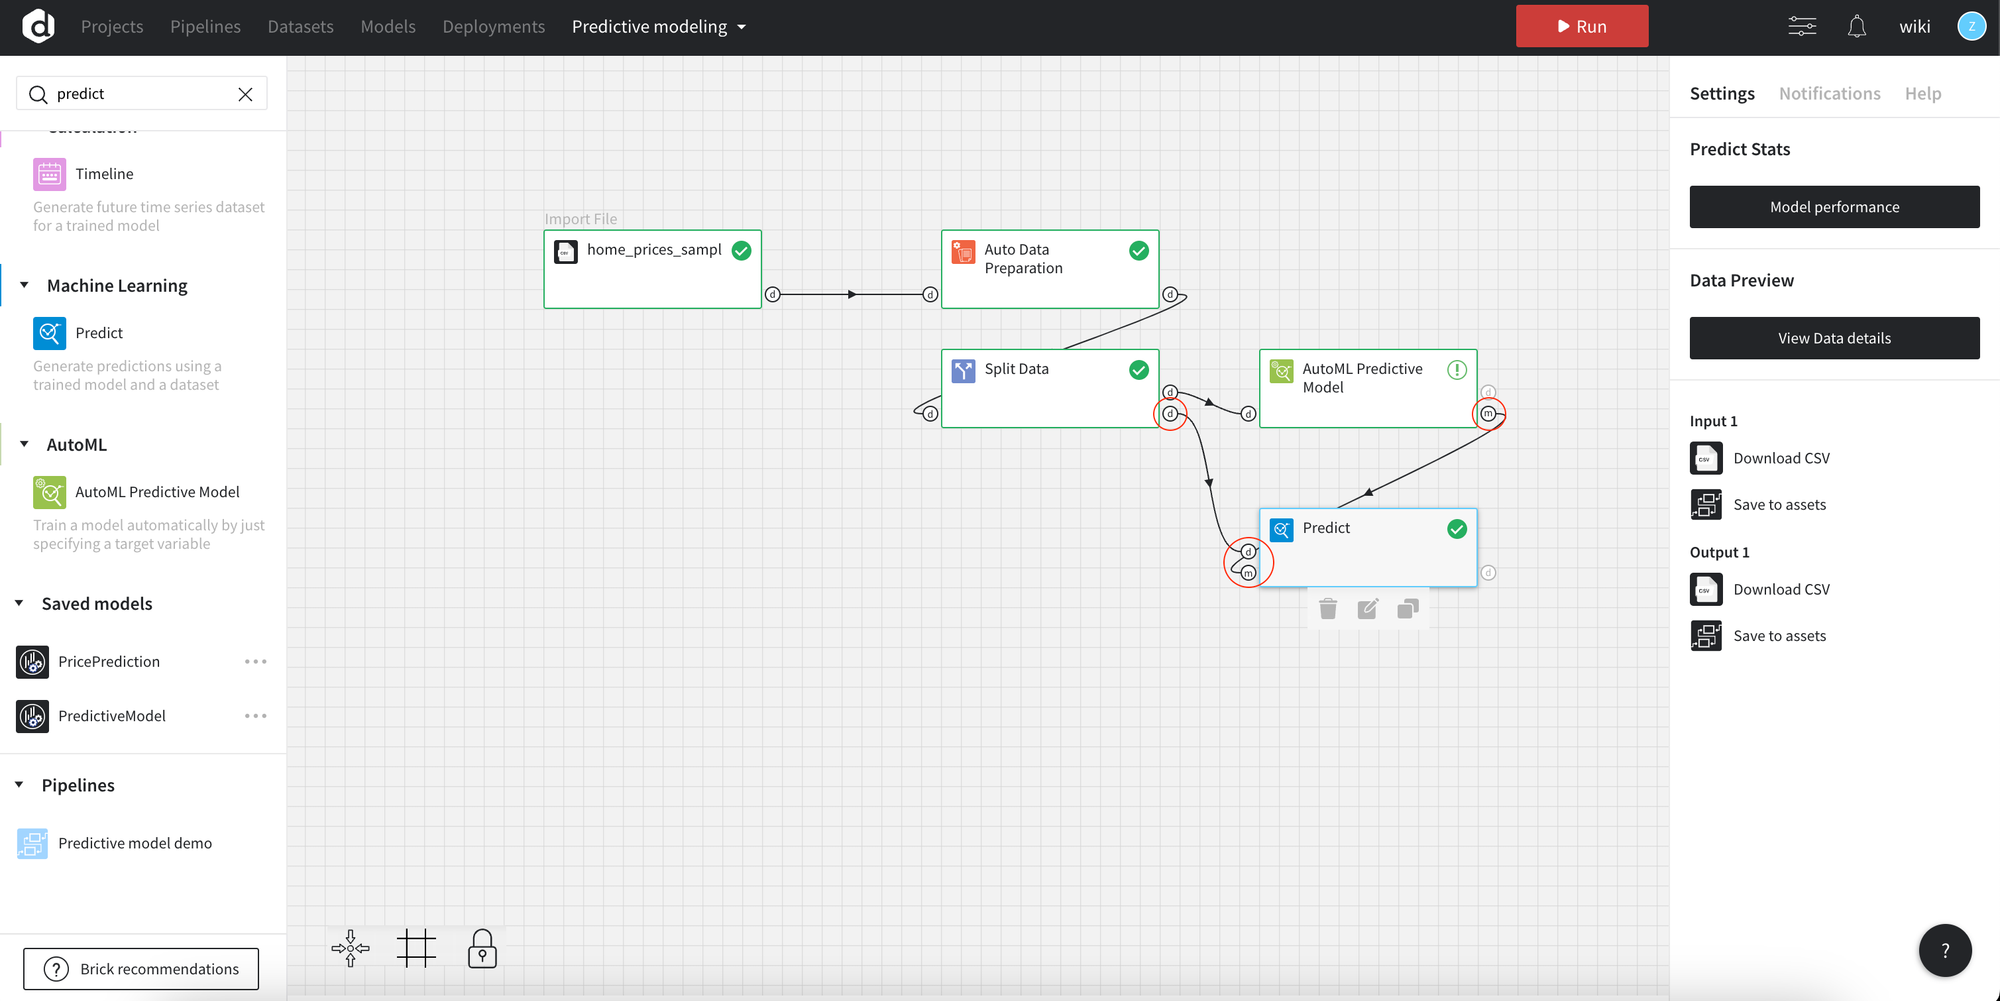
- Run pipeline
- Open Data details
In the Data details you may see the predicted values.