General information
Data Preparation Brick provides an interactive interface for preprocessing and investigation of the input dataset.
The brick allows to select the most appropriate types for the features, treat missing values (if exist), perform outliers removal for quantitative variables, and one-hot encoding for categorical attributes in one step.
Furthermore, the brick automatically produces the data summary where analyses the quality of the dataset before and after the specified preprocessing steps and calculates the descriptive statistics of every column both for the input and output datasets.
Description
Brick Locations
Bricks → Analytics → Data Mining / ML → Data Preparation
Brick Parameters
The brick parameters can be defined on the tab Settings inside the dashboard via the following table:
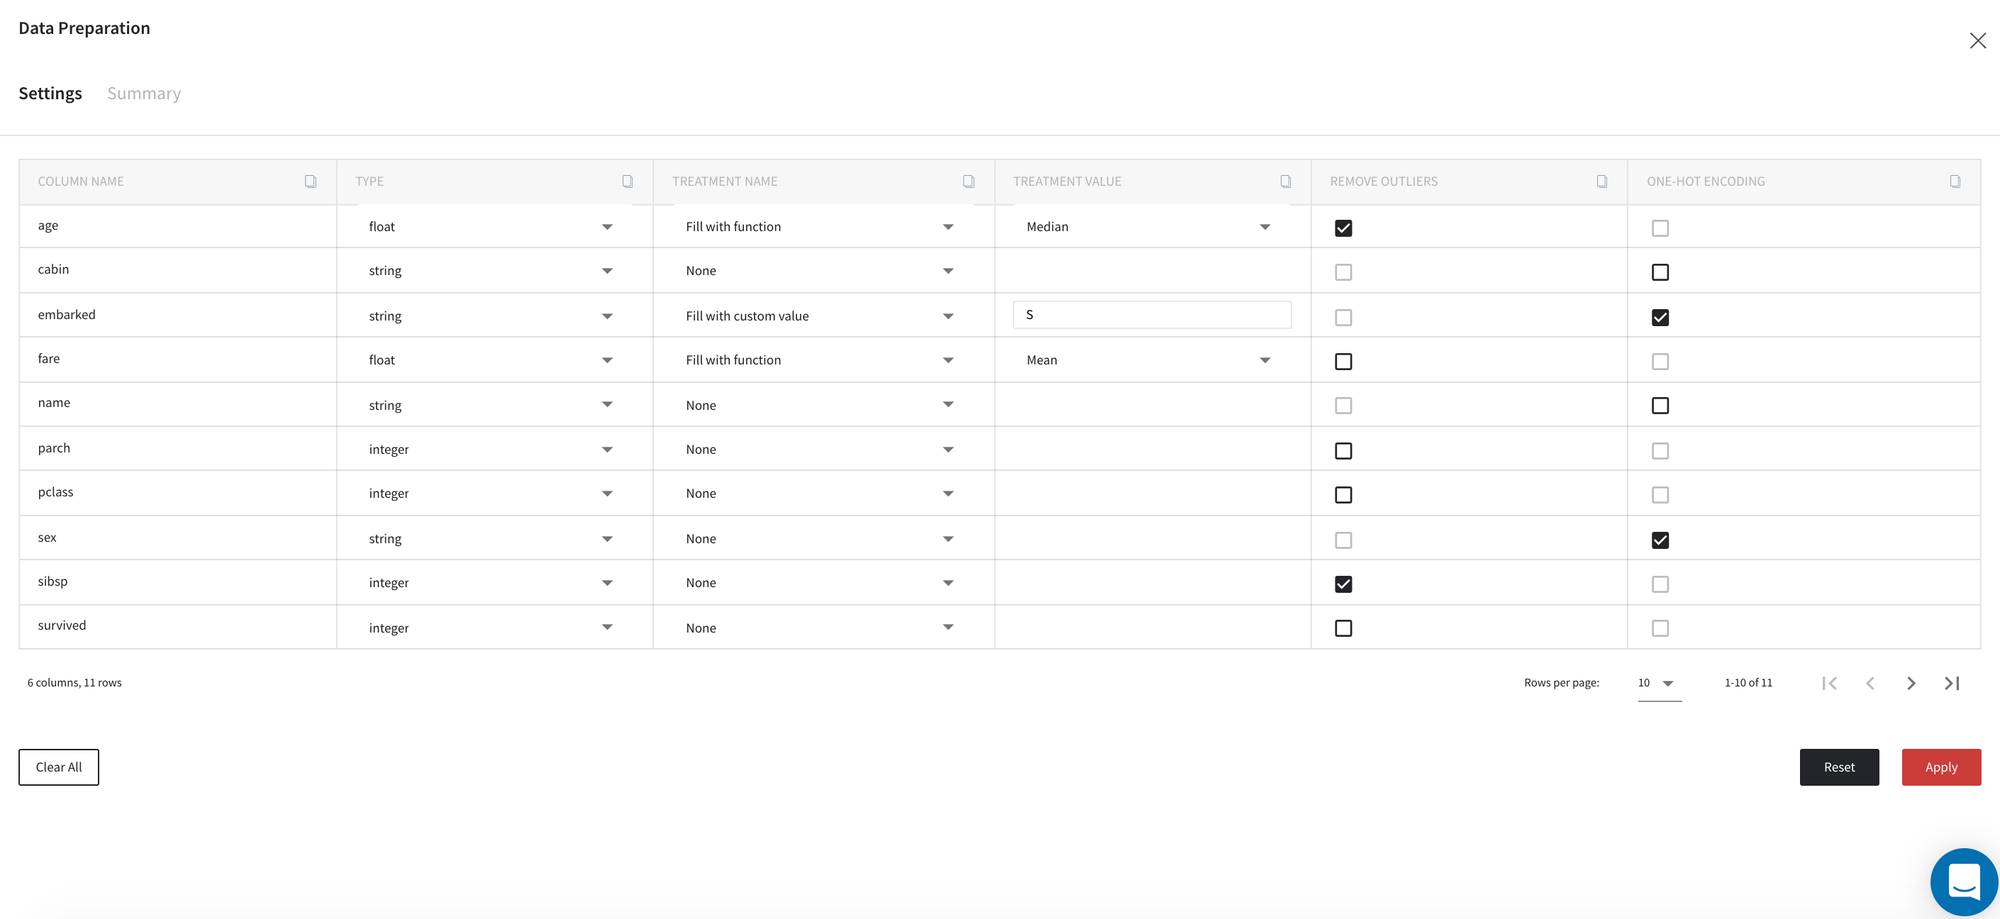
The first column of the settings table includes the names of the input dataset variables which we work with, while the rest of the columns define the following preprocessing parameters:
- Type
The current type of the column.
Here we support boolean, integer, float, string and datetime types.
- Treatment name
- Fill with custom value
- Fill with function
- Delete columns
- Delete rows
- None (do not handle missing values in the column)
Method to fill the missing values in the column.
In this parameter you can specify one of the treatment strategies:
- Treatment value
- Min
- Max
- Mean
- Median
- Mode
- Forward fill
- Backward fill
Additional setting for missing values treatment. This field is enabled only if the treatment type is either Fill with custom value or Fill with function.
If treatment name is Fill with function then you need to chose one of these functions:
Note, that functions min, max, mean, median, mode are supported only for numerical columns.
With "Fill with custom value" you need to specify the value to fill the missing values with. Note, that this value should be compatible with the column type.
- Remove outliers
The binary flag, that determines whether to remove outliers from the column. This field is enabled only if the type of the column is numeric.
By default, the Interquartile Range (IQR) method is used for this step. Therefore, the normal data range is defined with lower limit as and upper limit as where - are the first and the third quartile respectively, and . Any data point outside this range is considered as outlier and will be removed from the output dataset if checkbox is on.
- One-hot encoding
The binary flag, that determines whether to perform one-hot encoding for the column. This field is enabled only if the type of the column is string or boolean.
Despite the brick parameters, we also can configure transformations using the buttons:
- Clear all
Clears all transformation rules to None and reads data types from the input data
- Reset
Get auto-suggestions for all transformation rules
- Apply
Apply current transformations to the data
Brick Inputs/Outputs
- Inputs
Brick takes the data set without any restrictions.
- Outputs
Brick produces the result as a new dataset which obtained after transformations. The shape of the output dataset may differ from the input depending on the selected configuration for missing values treatment and outliers removal. Also columns where one-hot encoding was applied will generate new column for every unique value (original column will be deleted).
Brick Dashboard
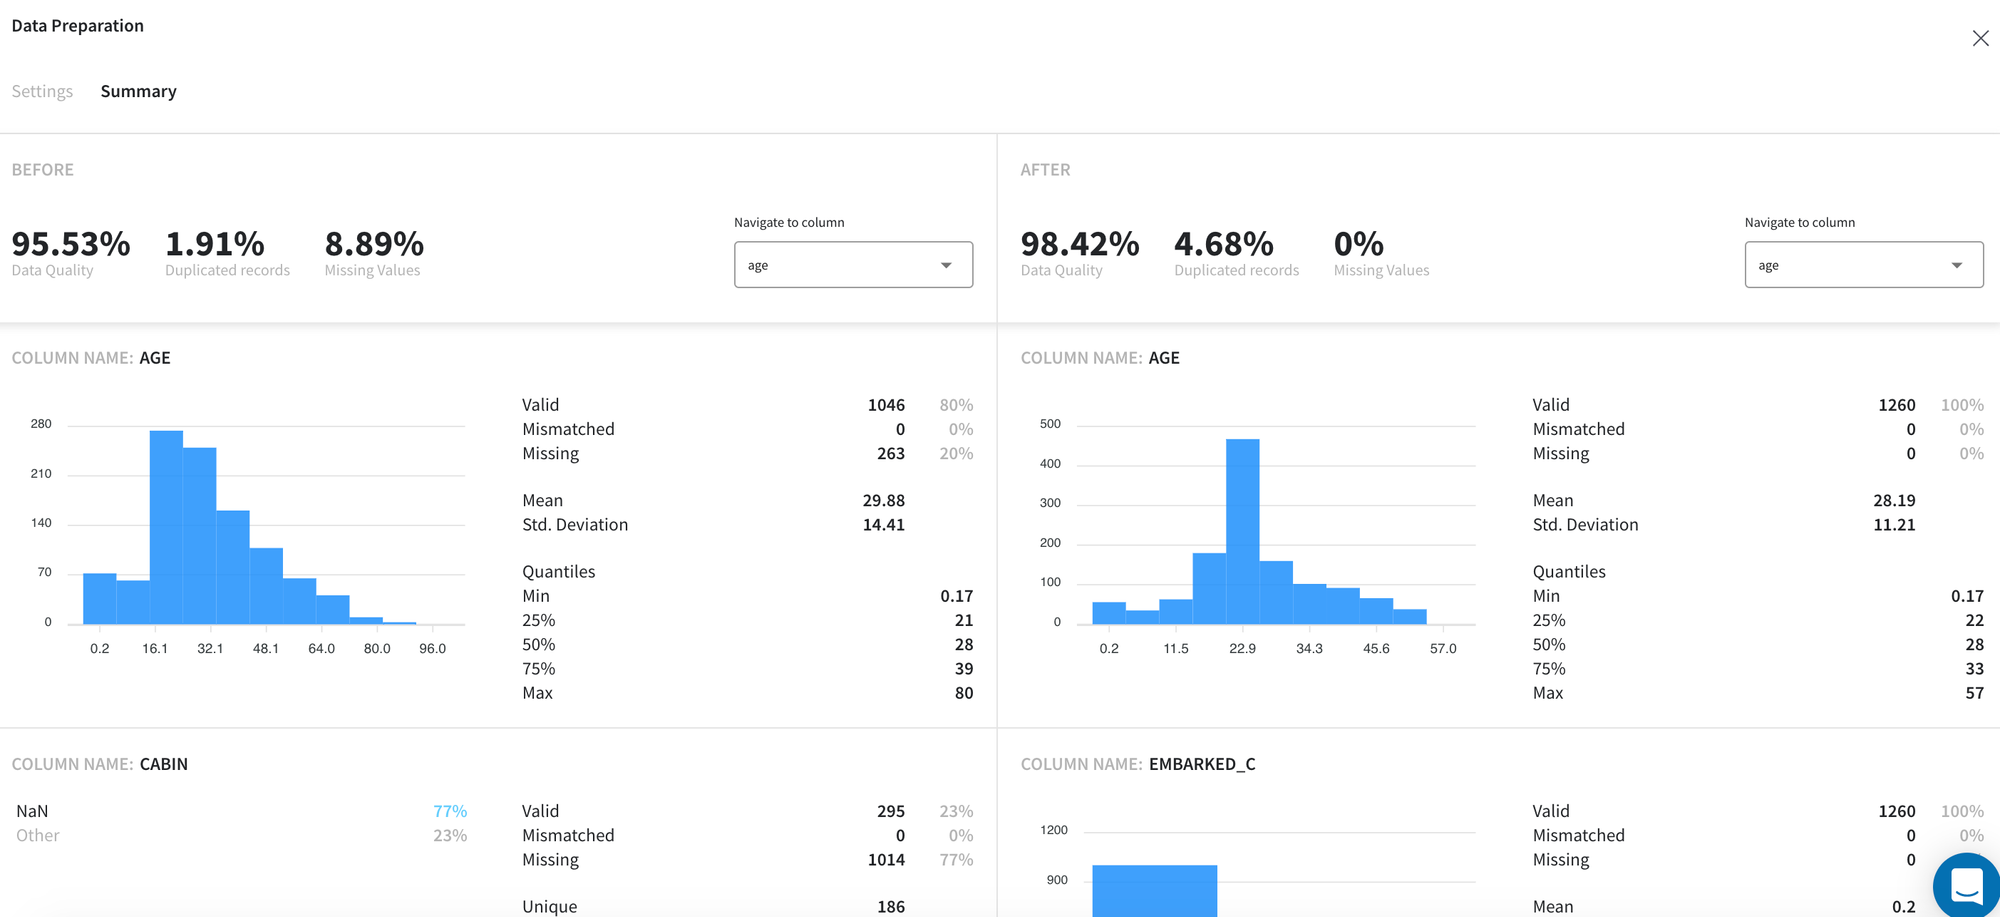
Another brick output is Summary Dashboard that can be accessed on the tab Summary:
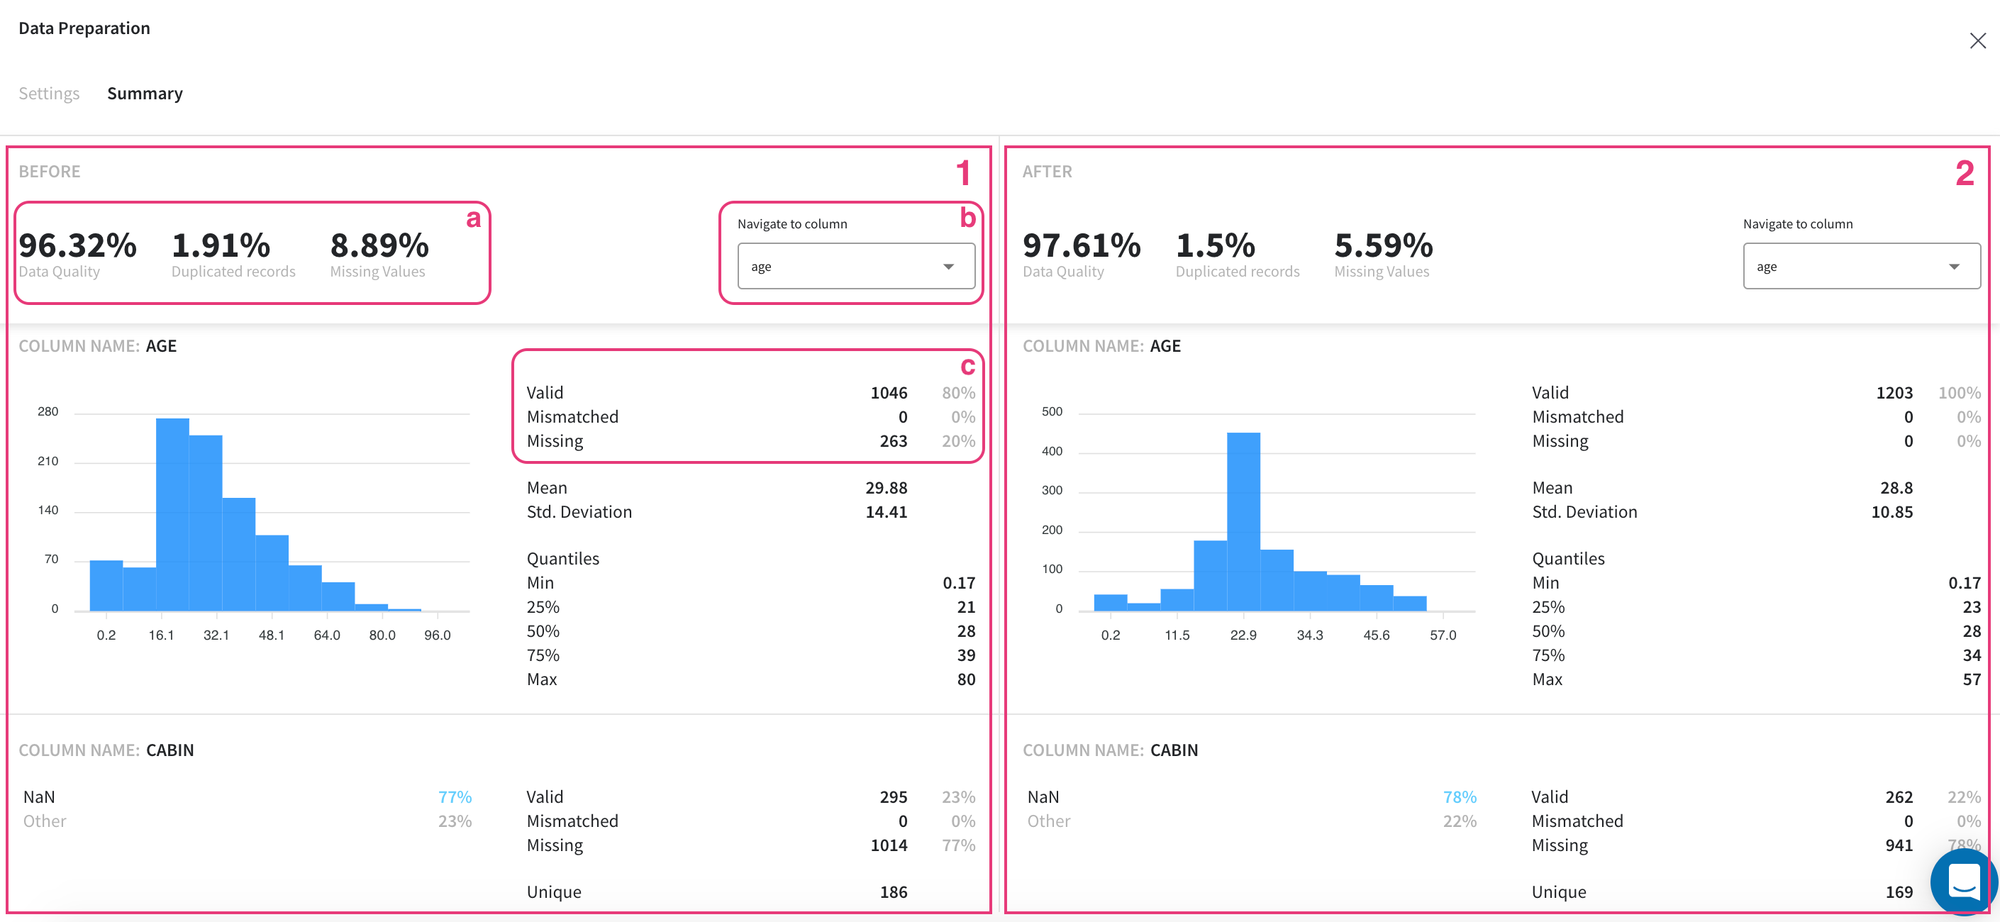
This dashboard illustrates general statistics of the input (1 - before transformations) and output (2 - after transformations) datasets and their columns in the same manner.
On the top bar (a) we can see the overall summary of the dataset, which includes the following characteristics:
- Duplicated records - share of duplicated rows across the data that are identical or very similar to each other
- Missing Values - share of table cells that contain missing values
- Data Quality - overall rate of the data quality which comprises the weighted ratio of duplicated rows, missing and not-matched values
In the lower part of the dashboard, we can view the descriptive statistics for columns that exist in our datasets separately.
First of all, for every column, we can see the number of records and their share which include missing, mismatched (those values which cannot be converted to the specified type), and valid (neither missing nor mismatched) values (c).
Despite these standard characteristics, other descriptive statistics are provided for data attributes depending on their type. For example, for numeric variables, we can visually observe their distribution and its general features such as mean, standard deviation, and major quantiles; while for categorical columns we can see the number of unique values and the ratio of the most common values (if their share in the data exceeds 1%).
For ease of reference and comparison of the columns, we can use a dropdown menu (b) with all column names to quickly navigate to the necessary variable and review the results.
Example of usage
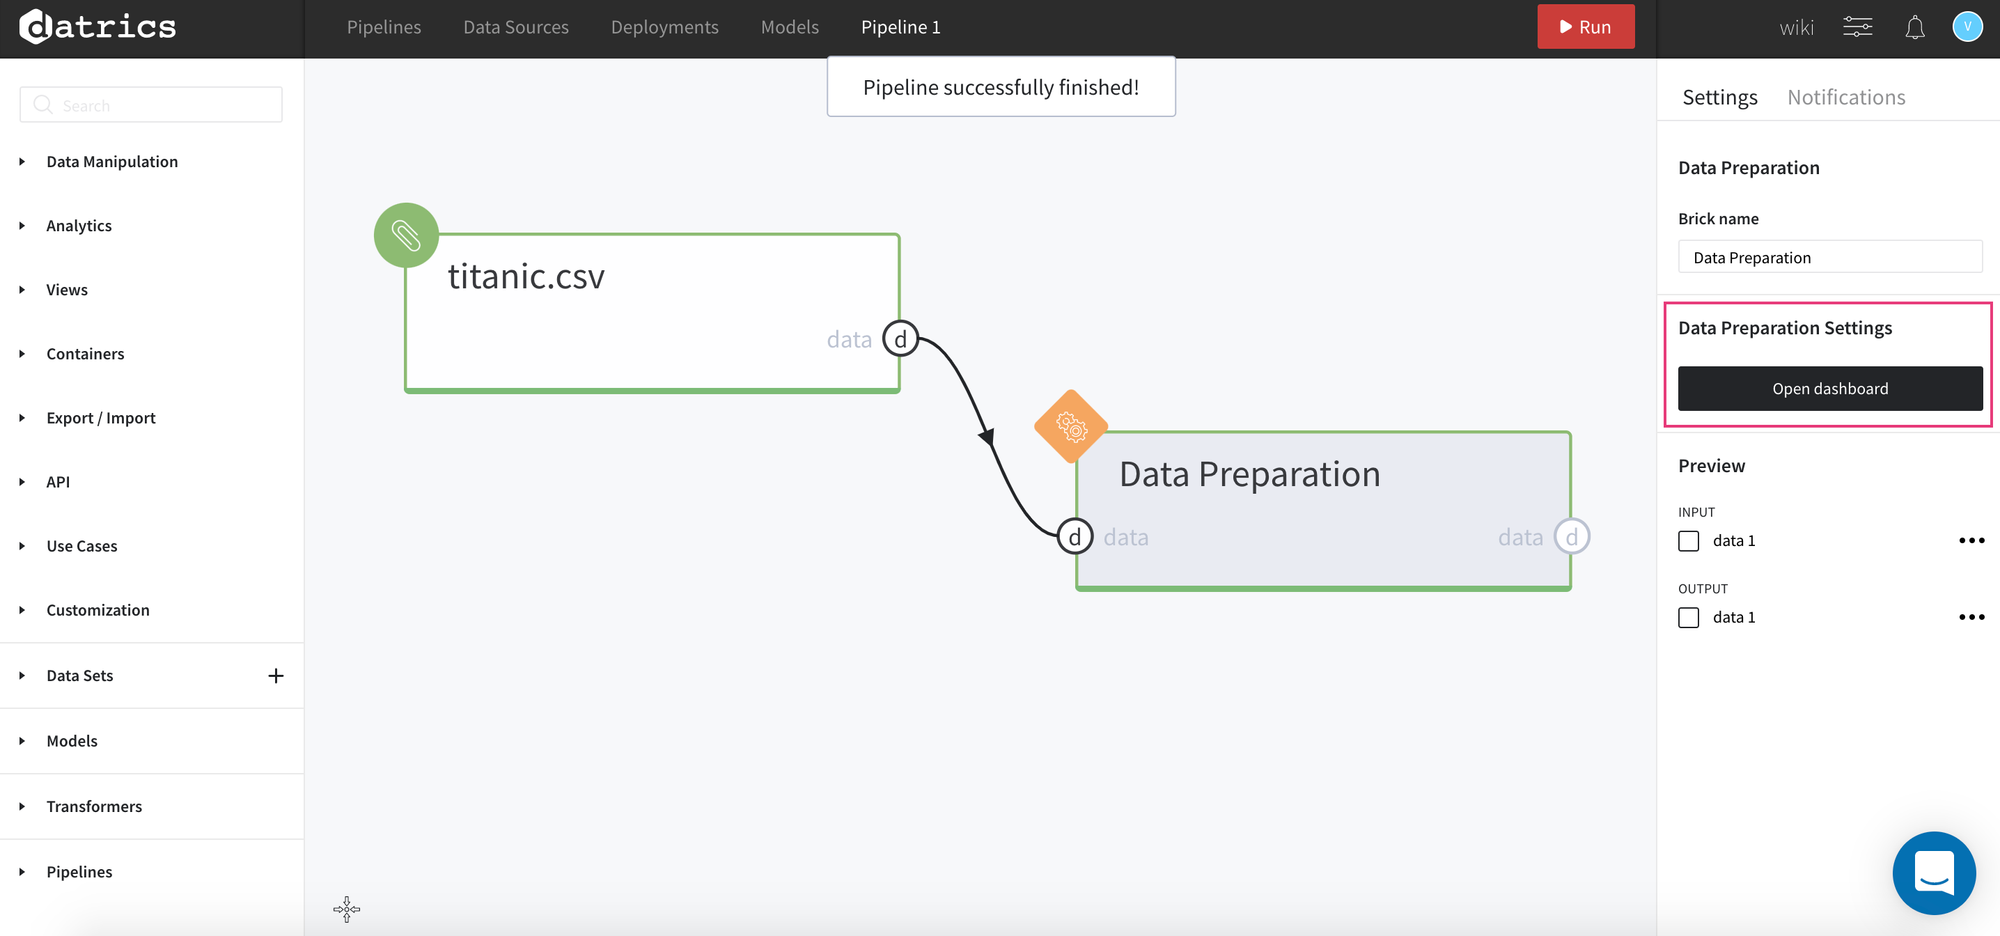
For demonstration let us consider the Titanic dataset.
First of all, we load and connect Titanic data and Data Preparation brick on the scene and Run our pipeline.
After running is complete, on the right sidebar we must see the Open dashboard button, where we can configure our transformations and review the summary.
Inside the dashboard we can see the Settings tab which defines our preprocessing steps.
Note, when opening the dashboard after the first run, the transformation rules are filled by auto-suggestions from the platform.
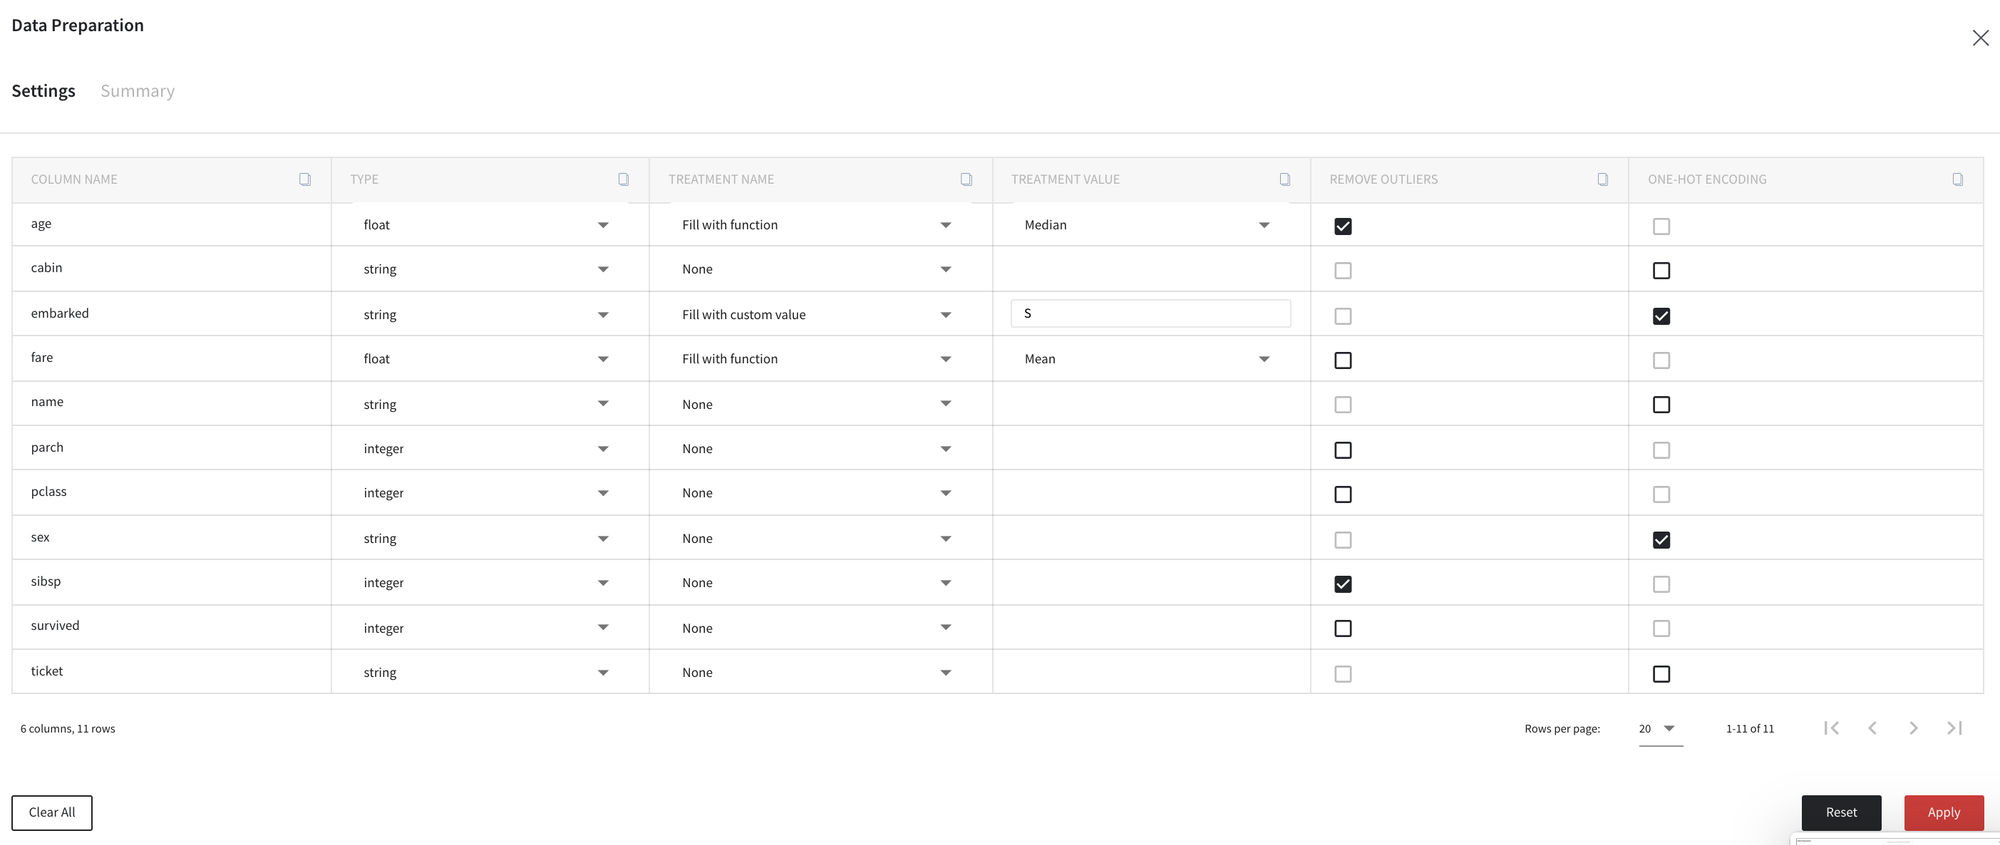
Using this table, let us change some treatment strategies and column types.
For example, we define new types for variables pclass, survived and ticket, edit strategy for missing values treatment for columns embarked and fare, and decide to drop the columns cabin and name.
Note, that after changing the column type or treatment methods, all other options became freeze until the Apply button is clicked.

In order to apply the changes we run the brick using the Apply button in the down right part of the dashboard.
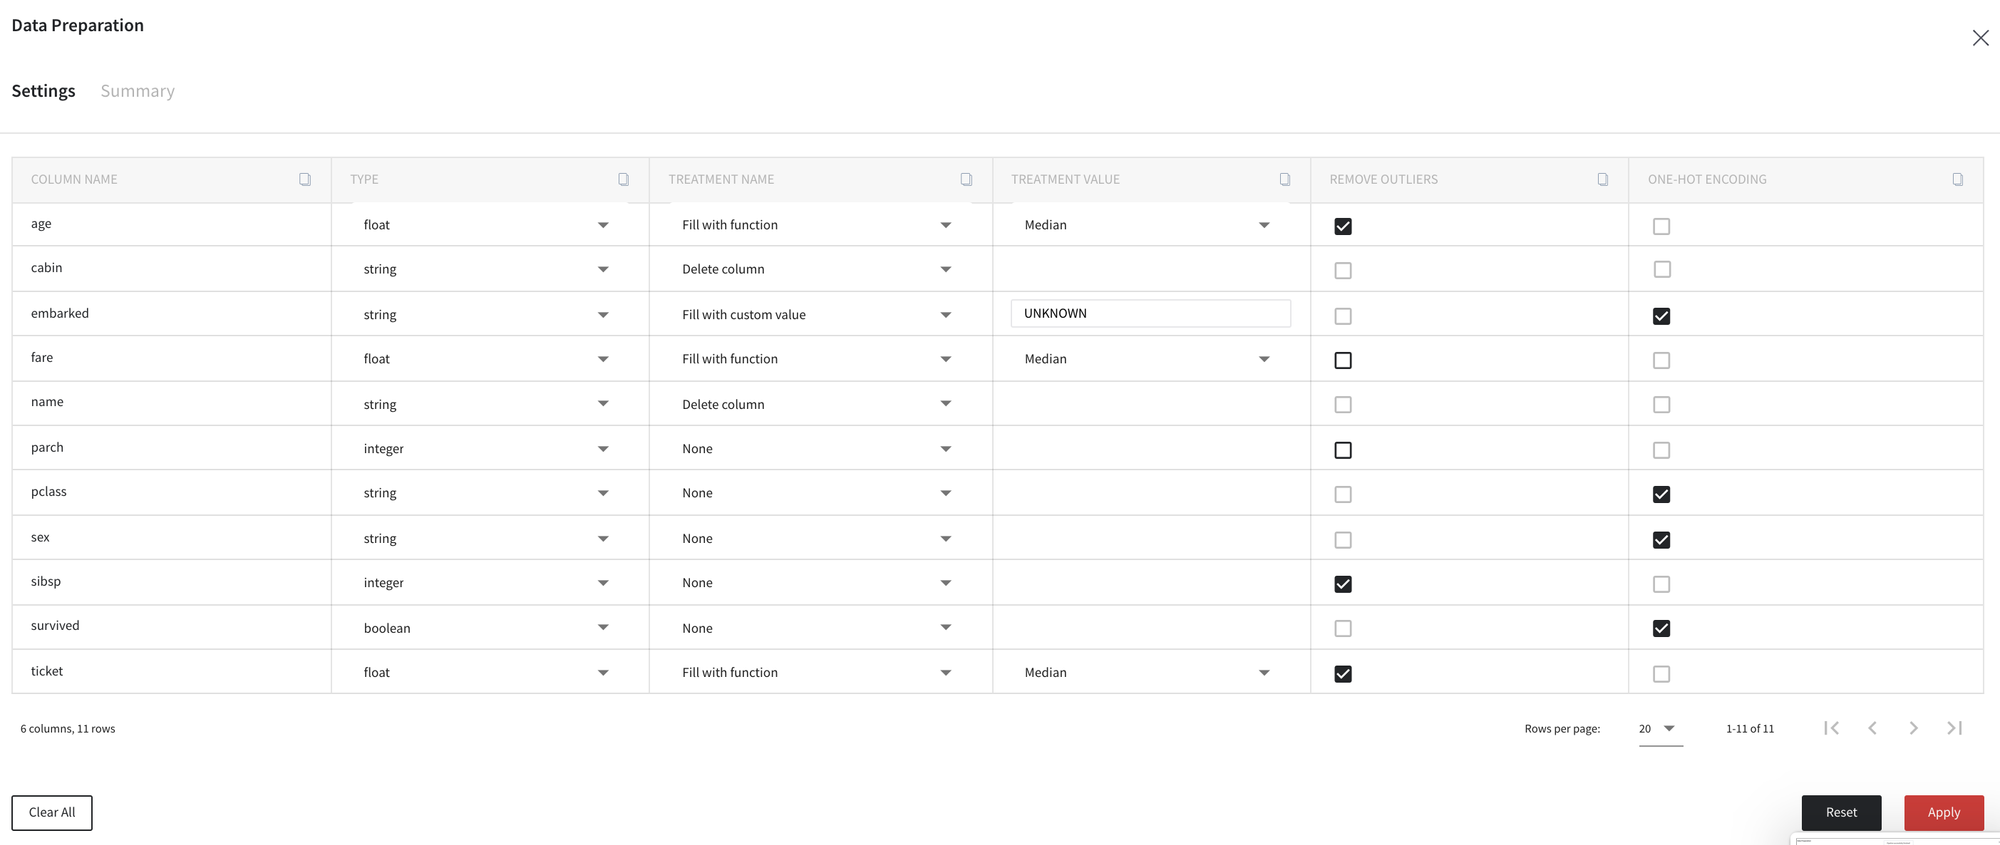
After that, the brick notifies us about the appliance of auto-suggestions that were produced after custom types and missing values treatment changes, so then we can decide to change other transformations.
For example, we disable the outliers removal for columns sibsp and ticket, and do not apply one-hot encoding for column sex as follows:

Finally, after clicking Apply button we can review our results on the tab Summary and compare our dataset before and after defined transformations.