Pipeline for the demonstration of Datrics abilities to predict product demand on SKU level, based on the analysis of historical data, which includes information about product price, product category, the number of sold items, etc. The proposed pipeline performs data preprocessing, including cleansing and feature engineering, training and application of the demand forecasting model.
Problem Statement
Based on transactional online retail data analysis, predict the demand level for specific product item.
Invoice - Invoice number. Nominal, a 6-digit integral number uniquely assigned to each transaction. If this code starts with letter 'c', it indicates a cancellation.
StockCode - Product (item) code. Nominal, a 5-digit integral number uniquely assigned to each distinct product.
Description - Product (item) name. Nominal.
Quantity - The quantities of each product (item) per transaction. Numeric.
InvoiceDate - Invice Date and time. Numeric, the day and time when each transaction was generated.
Price - Unit price. Numeric, Product price per unit in sterling.
CustomerID - Customer number. Nominal, a 5-digit integral number uniquely assigned to each customer.
Country - Country name. Nominal, the name of the country where each customer resides.
Data Analysis Scenario
Inputs
Initial Goal
Create the predictive analytics solution for the forecasting the demand on separate SKU with respect to the calendar and price dependencies
Analysis Constraints
Analysis should be performed for the product items, that have a long history of sale, and are related to UK transactions.
Data Cleansing
First of all we have to delete invalid and abnormal cases and some excess attributes:
Delete cancelled orders - orders with negative items quantity
Moreover, we should limit the data for the analysis with the transactions that are referred to the United Kingdom and the SKUs that were sold for at least 100 days in the observed period.
Feature Engineering
As we are going to perform the forecasting of the future demand on separate SKUs considering their price and seasonal dependencies. That's why we need to represent the transaction data in the aggregated form when each row relates to the unique SKU per day and contains information about the total number of sold items and the average price per item for the particular date:
Experiment Design
In order to simulate the application of the developed solution, the prepared dataset is splitter into two subsets on a calendar basis - 80% of older data is used for the model training and the newest 20% - for the validation correspondingly. Moreover, for the clear prediction on the future period simulation, two-weeks planning data with respect to the initial distributions was generated.
Modelling
Retail data is characterized with good seasonality dependencies and might be represented as a superposition of harmonics and non-linear trend, and one of the appropriate solutions - apply time series decomposition and make forecasting based on separate analysis of the trend, seasonality, and holidays effects. That's why we choose Prophet by Facebook as a core of our solution. Prophet - is the robust procedure for forecasting time series data based on an additive model where non-linear trends are fit with yearly, weekly, and daily seasonality, plus holiday effects.
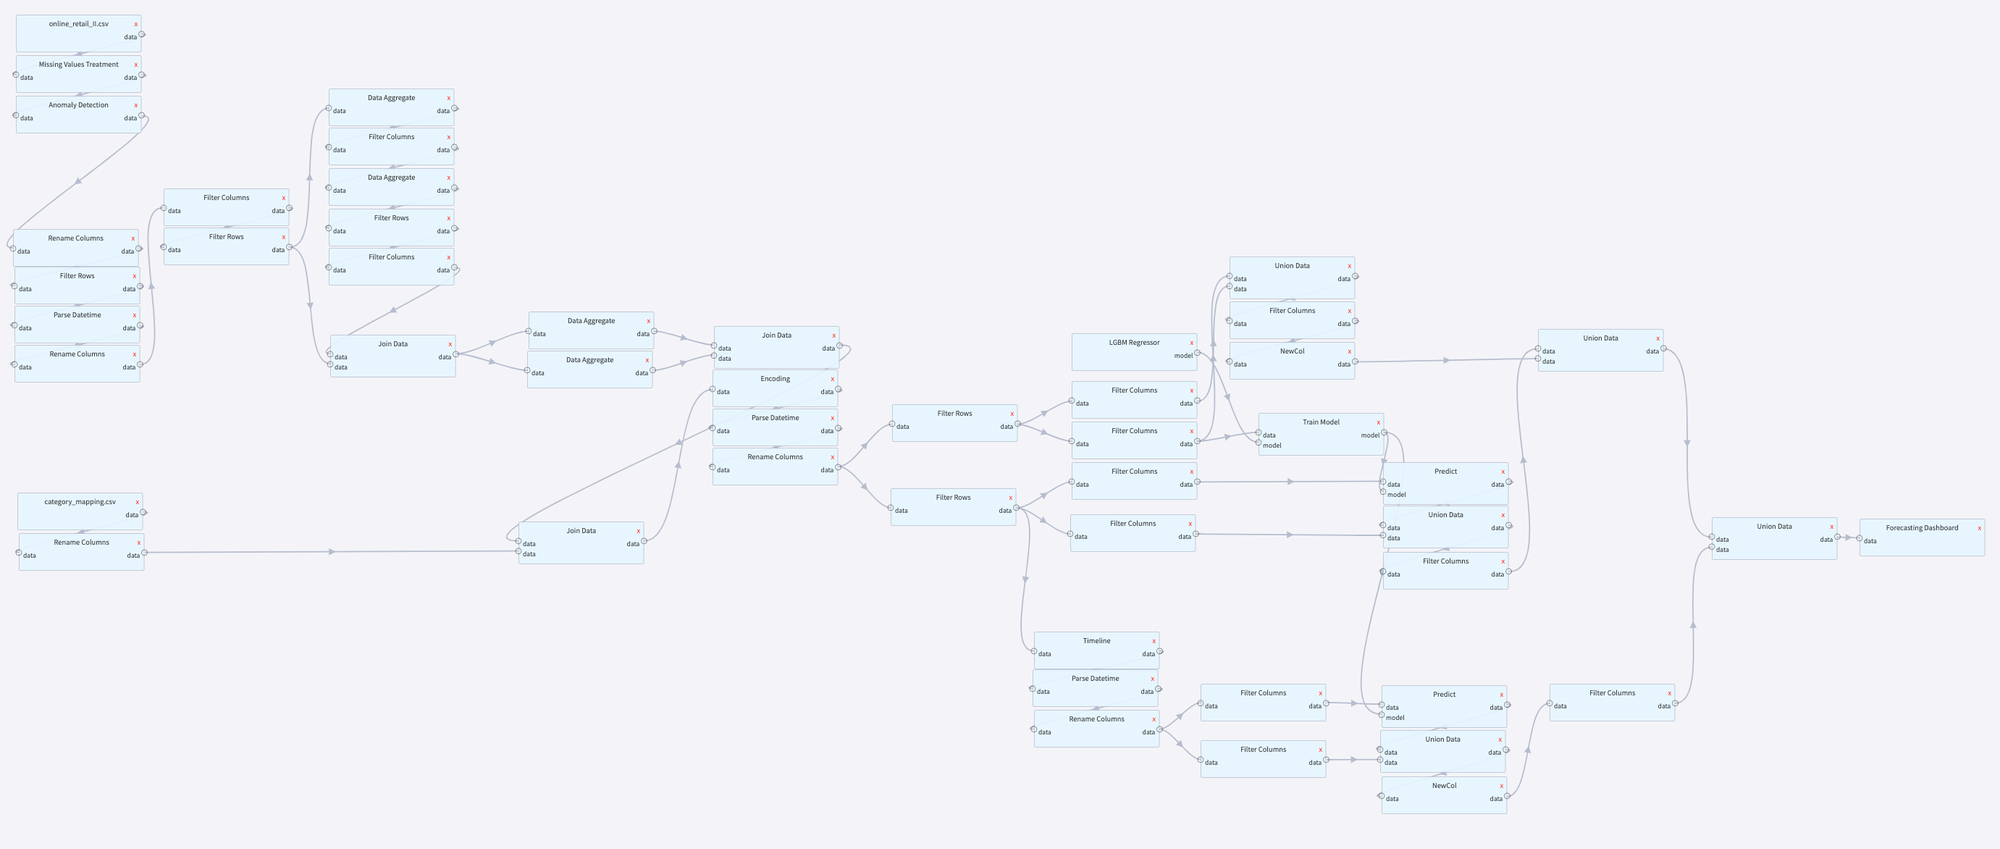
Datrics Pipeline
Pipeline results
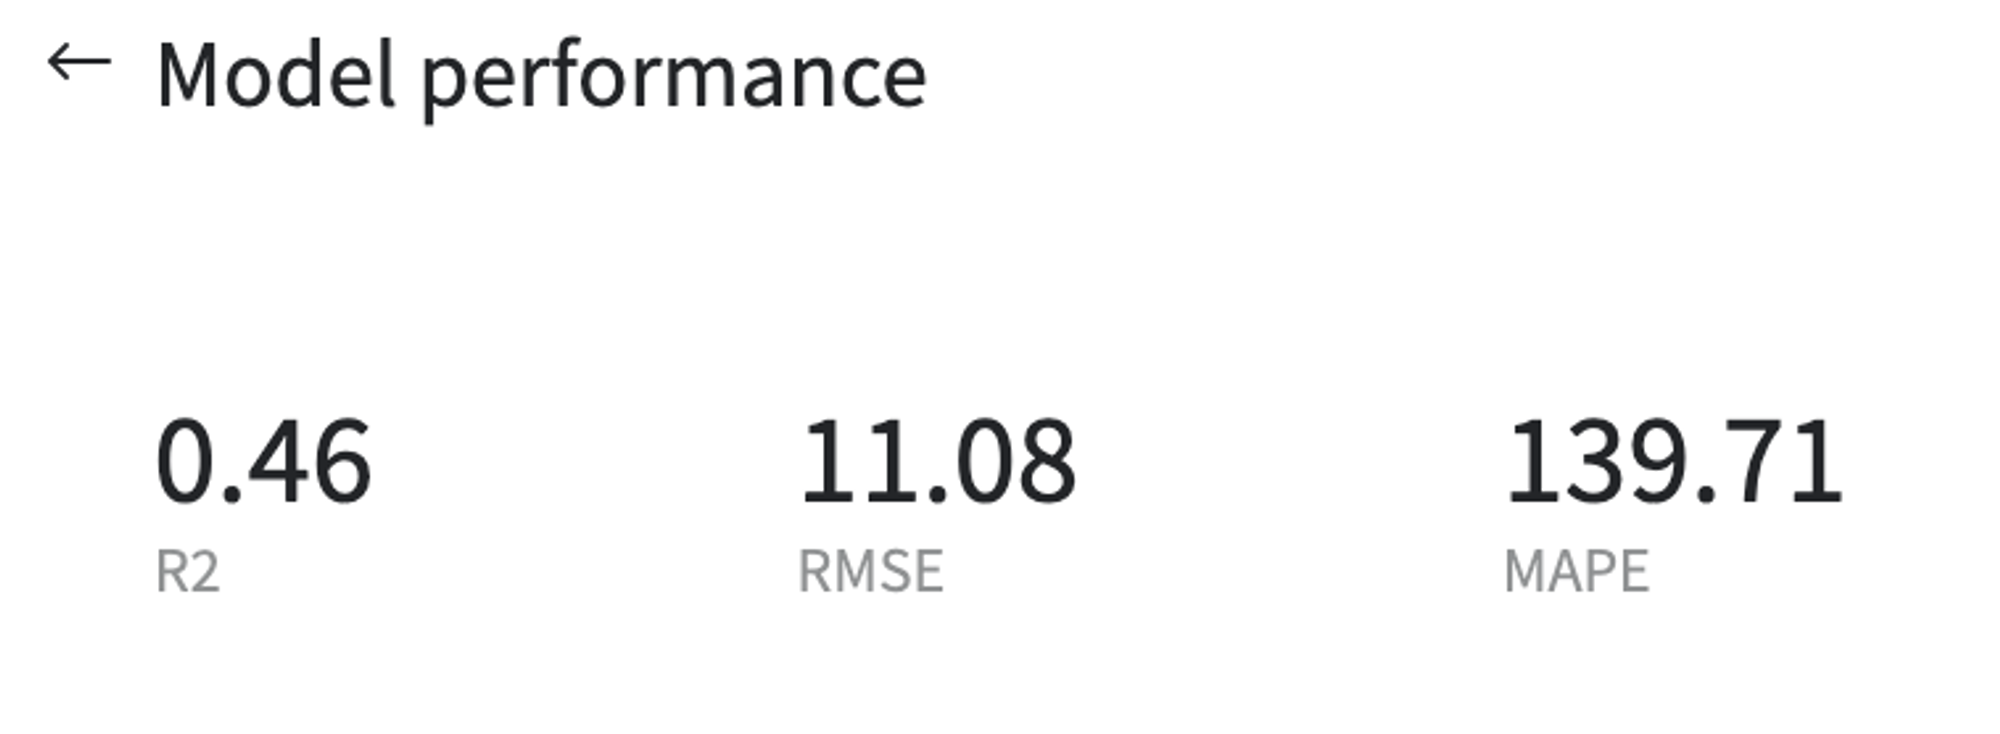
Model performance
The model provides a sufficient fitting of the dependent variable - the coefficient of determination is 0.46% on the test set. To see the final results, press "Model performance" button on the Predict brick menu.
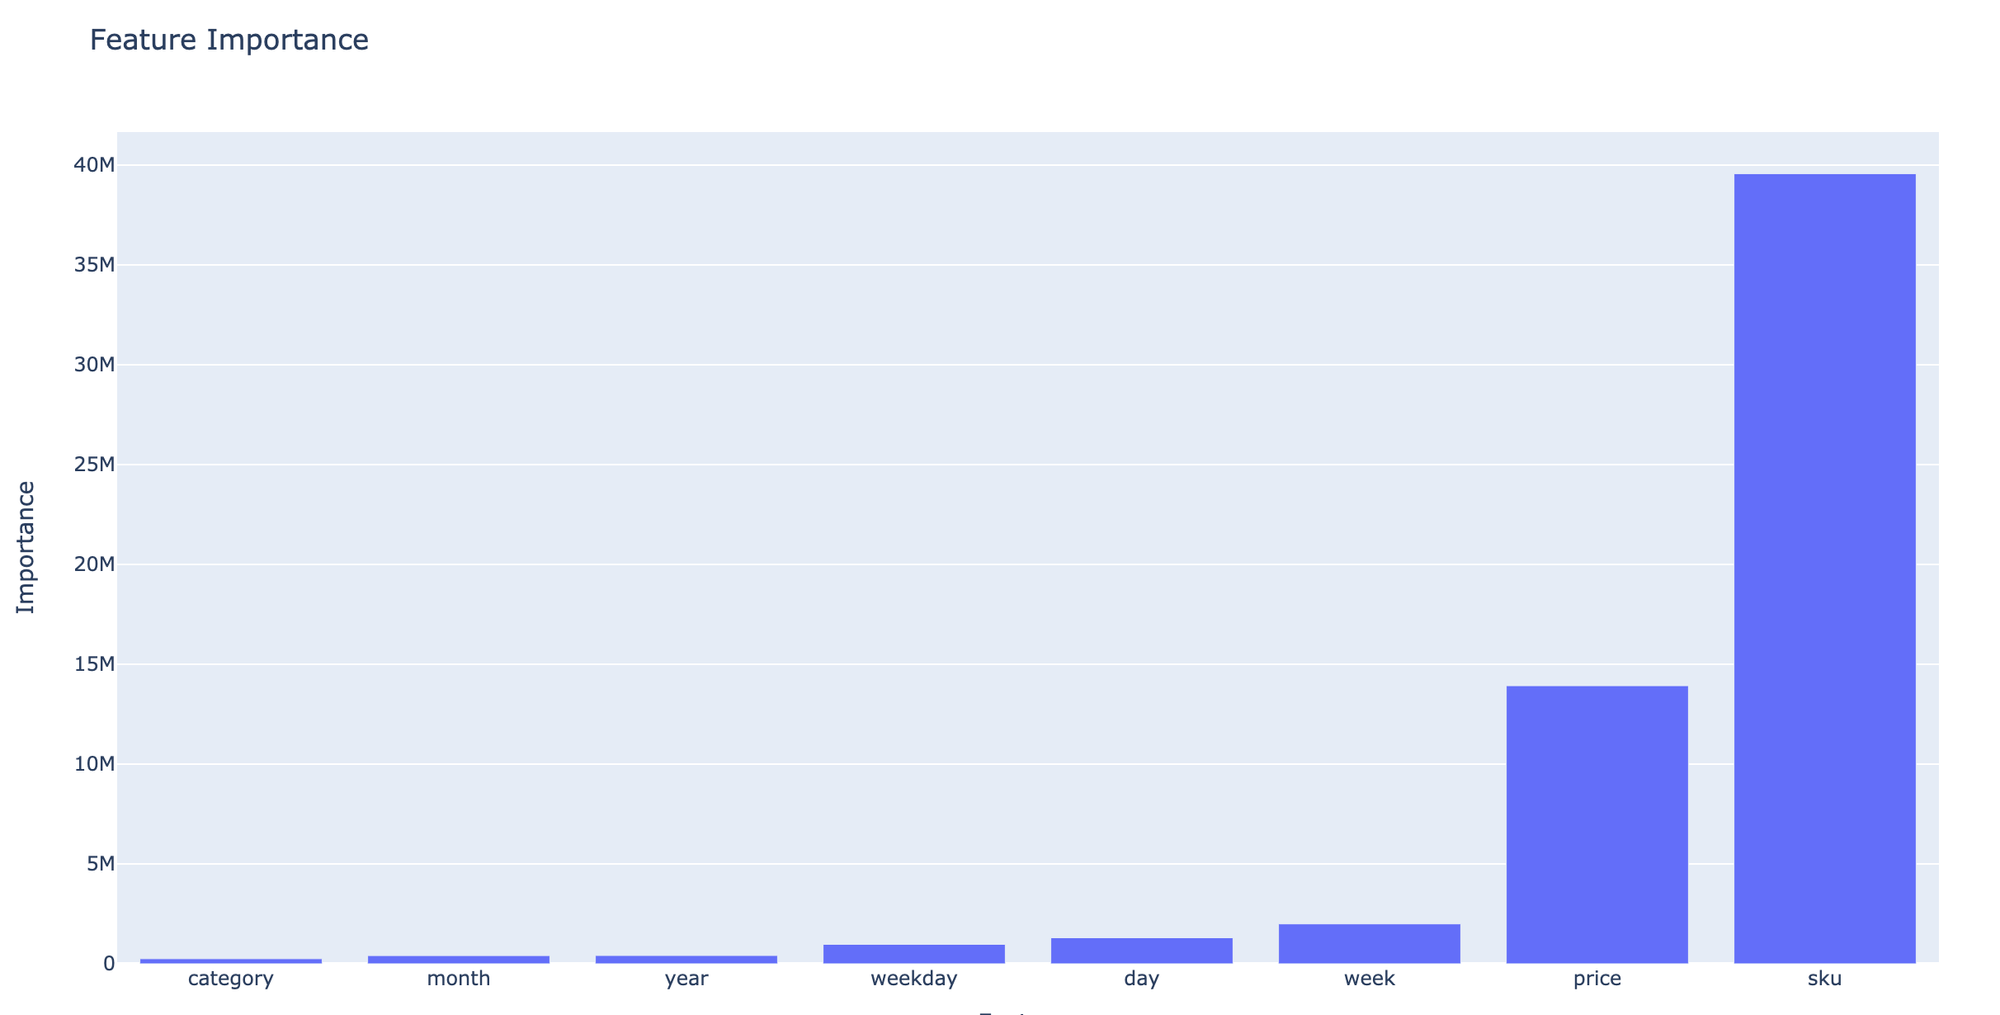
Feature Importance
The predictive importance of the input features for the assessment target variable can be reached via Train Brick→ Model Performance dashboard. The most important features are Overall Quality and Above grade (ground) living area square feet.
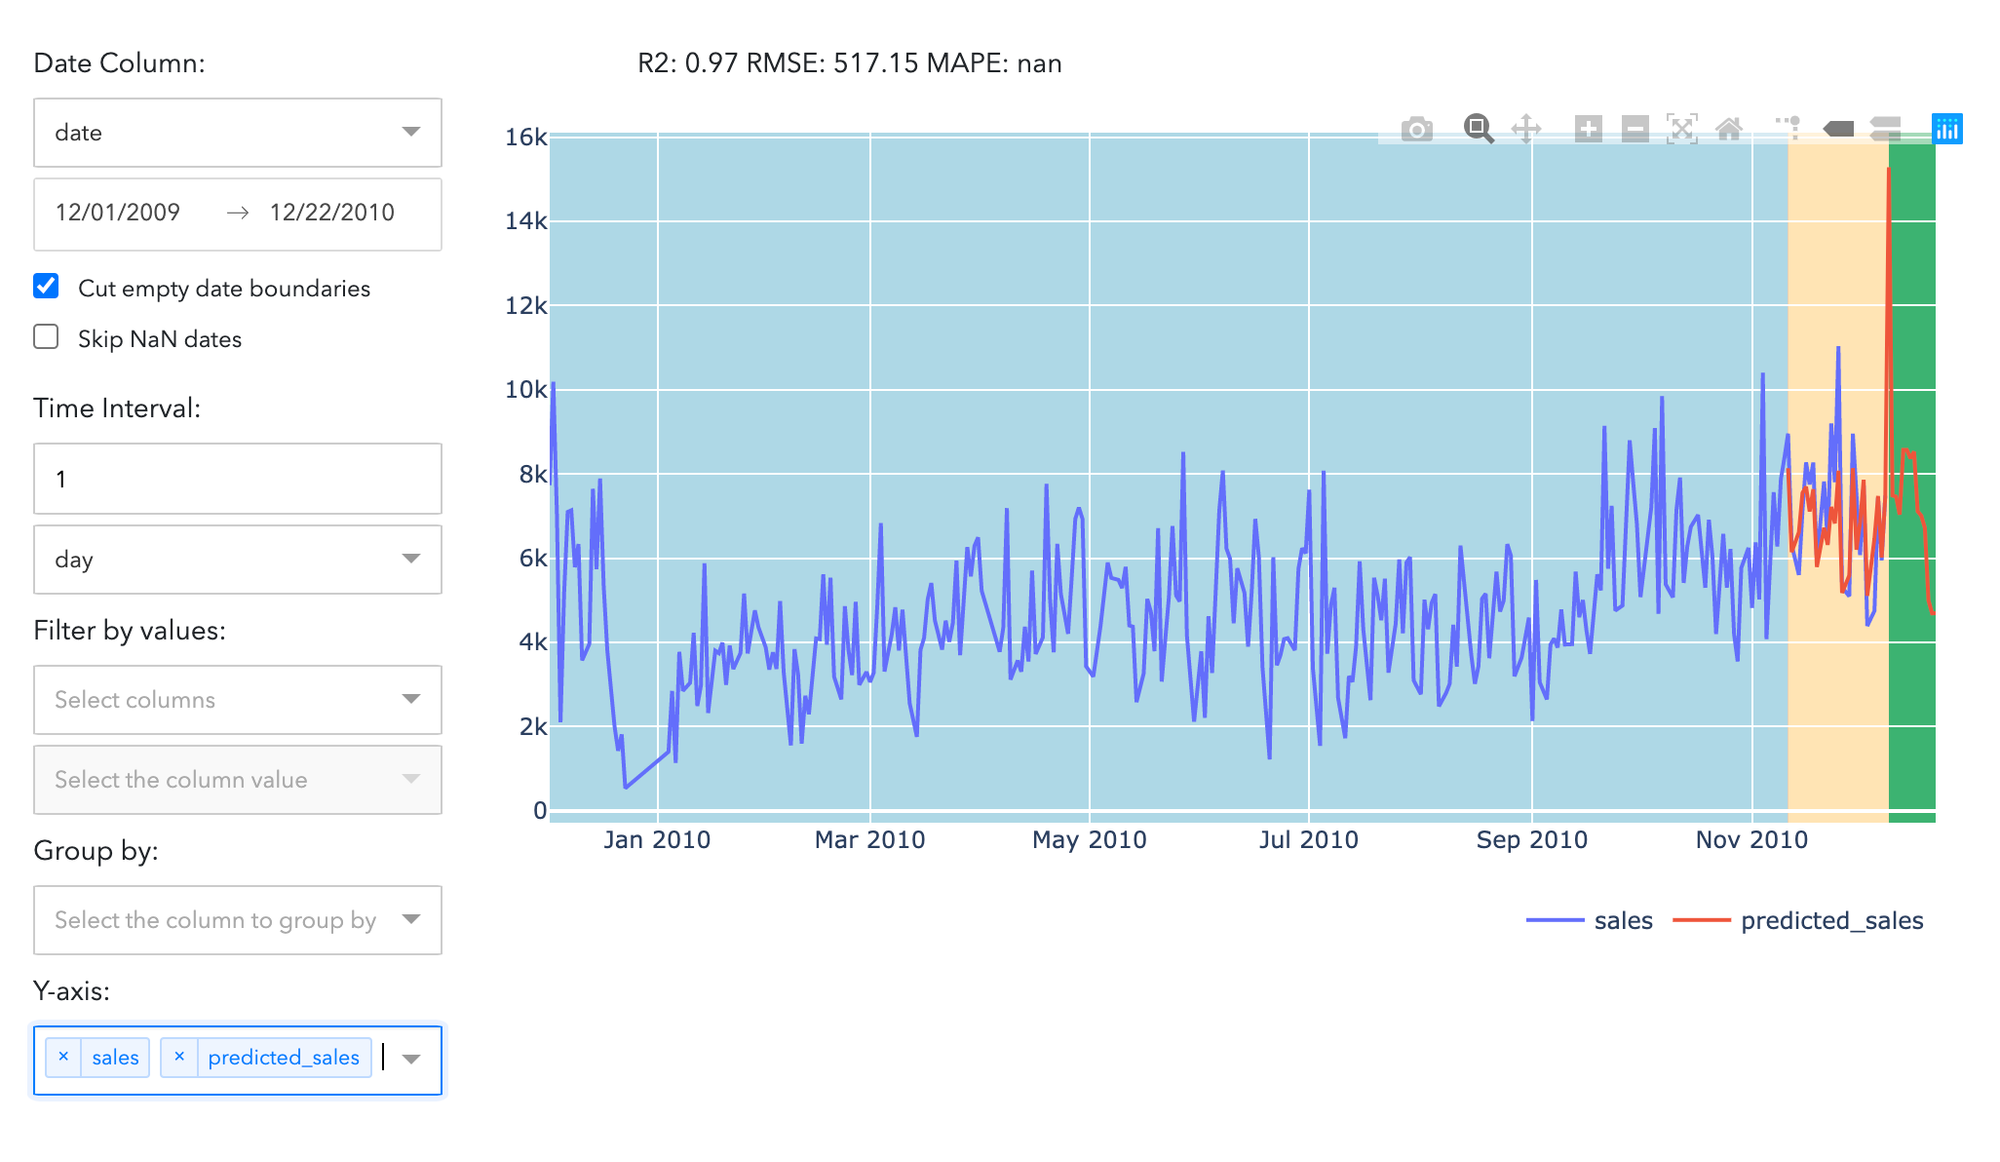
Prediction Results
Model prediction results can be reviewed and analyzed in Forecasting Dashboard. The Blue zone relates to the train set, yellow - validation, and green - to the newest period correspondingly.