General information
The Excel Automation brick allows users to automate the process of populating Excel files with data and retrieving output from Excel calculations. This feature streamlines the interaction with Excel files, enhancing efficiency by reducing manual data entry and extraction.
Description
Brick Locations
Bricks → Featured → Excel Automation
Brick Parameters
- Excel file
A file that should be recalculated. Supported formats: xlsx, xls.
- Input cells
- Sheet Name: Dropdown to select the specific sheet within the Excel file.
- Input Cells: The cell references in the Excel sheet where data will be entered. The range should be the same as the selected input data
- Input Data: Dropdown to select the data source.
- Input Data Column: Dropdown to match the column from the data source to the input cell. This field is not mandatory. If you are leaving the value empty, the full dataset will be used as input.
In this section, users can define the input cells in the Excel file that will be populated with data. Users can specify the sheet name, input cells, input connector, and the corresponding column in the input connector. This setup ensures that the correct data is sent to the specified cells in the Excel file.
- Output cells
- Sheet Name: Dropdown to select the specific sheet within the Excel file.
- Output Cells: The cell range in the Excel sheet from where data will be extracted.
- Output Connector: Field to define the name of the output connector for the extracted data.
This area allows users to specify the cells from which data will be retrieved after the Excel file processes it.
Brick Inputs/Outputs
- Inputs
Brick takes at least one dataset
- Outputs
Brick produces datasets
Limitations
Excel automation brick does not support:
- Pivot table
- VBA
- Charts
- List of formulas
Example of usage
To illustrate the potential usage of the Excel Automation in Datrics, let’s go through the example of the Revenue calculation for the SaaS product.
We have the business model described in xlsx file.
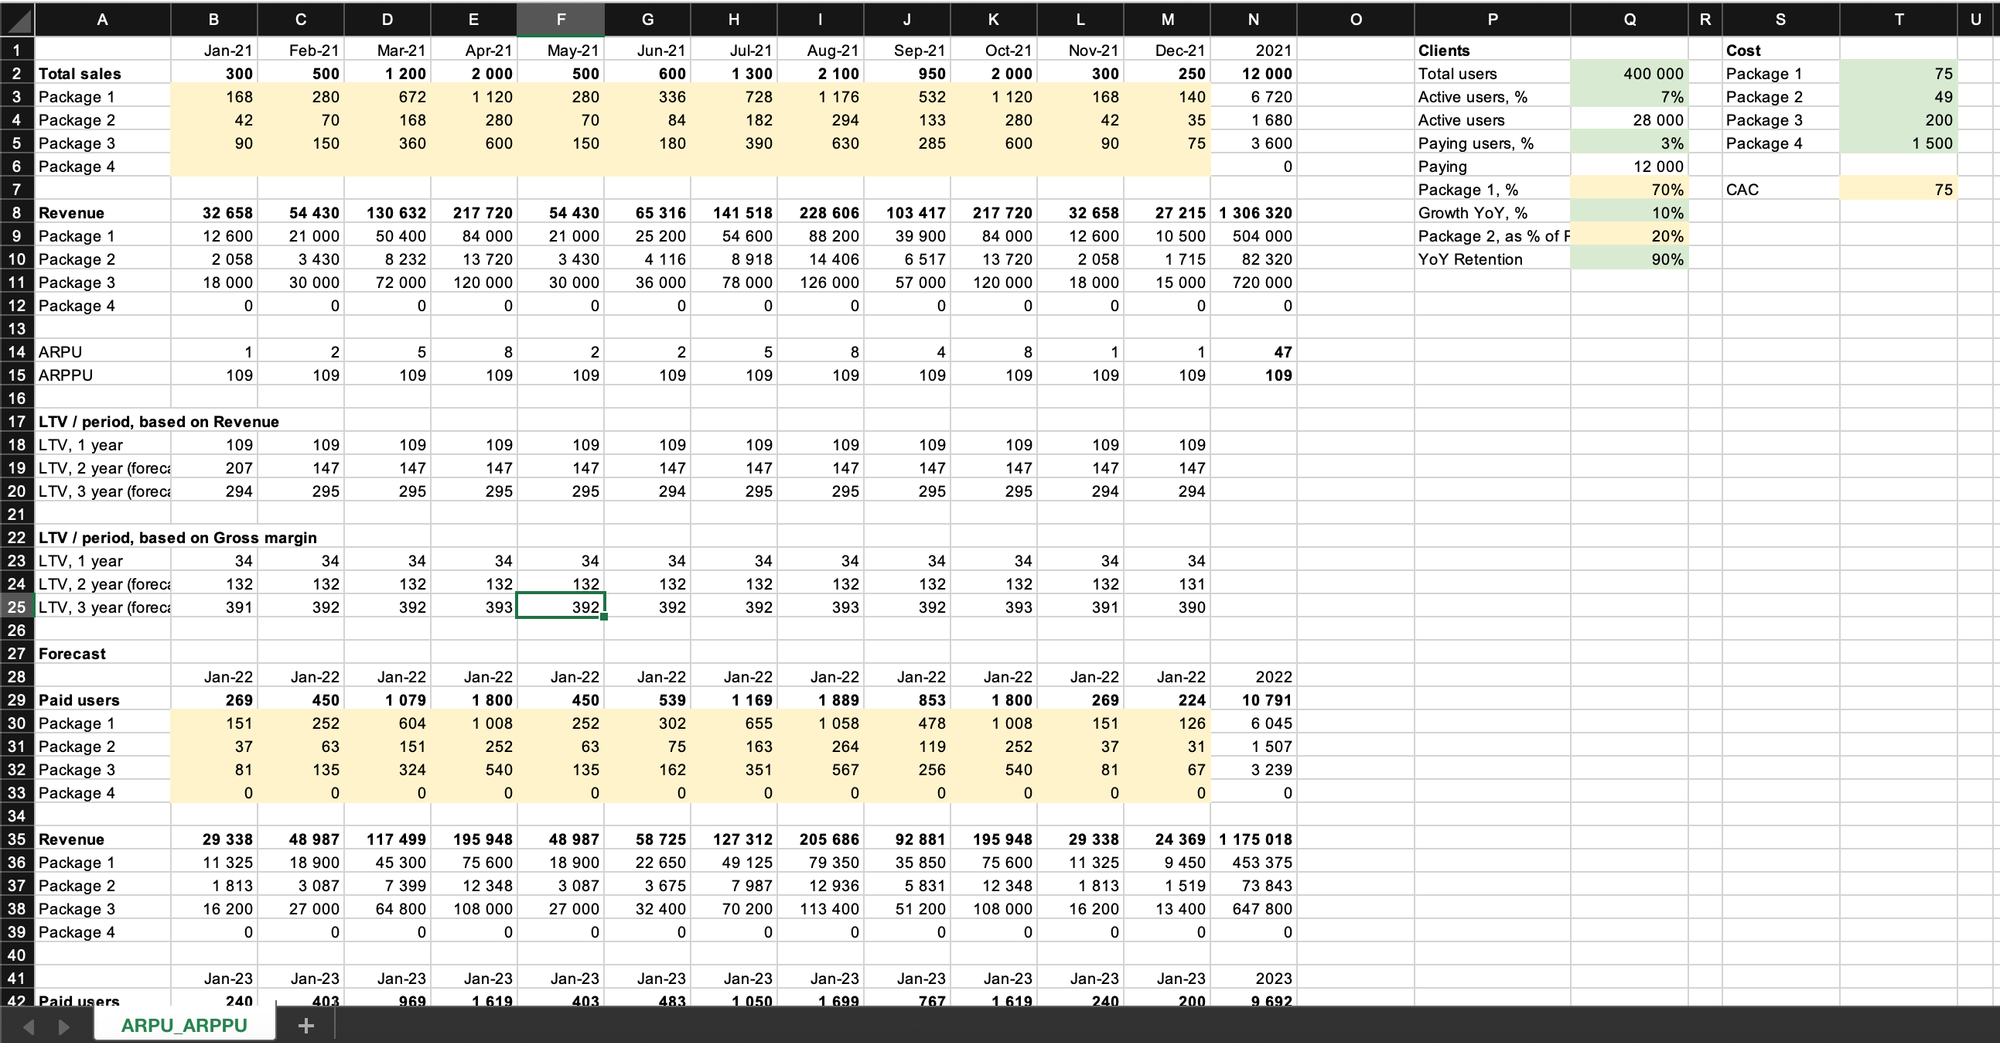
Input values in the model are
- Clients: total users, active users, %, paying users,%, growth YoY,%, YoT retention
- and Cost - Package prices and CAC
Depending on the changing input variables expected revenue will vary.
Let’s create the Data app in Datrics to support the calculation of the various scenarios of the Business model for the SaaS company.
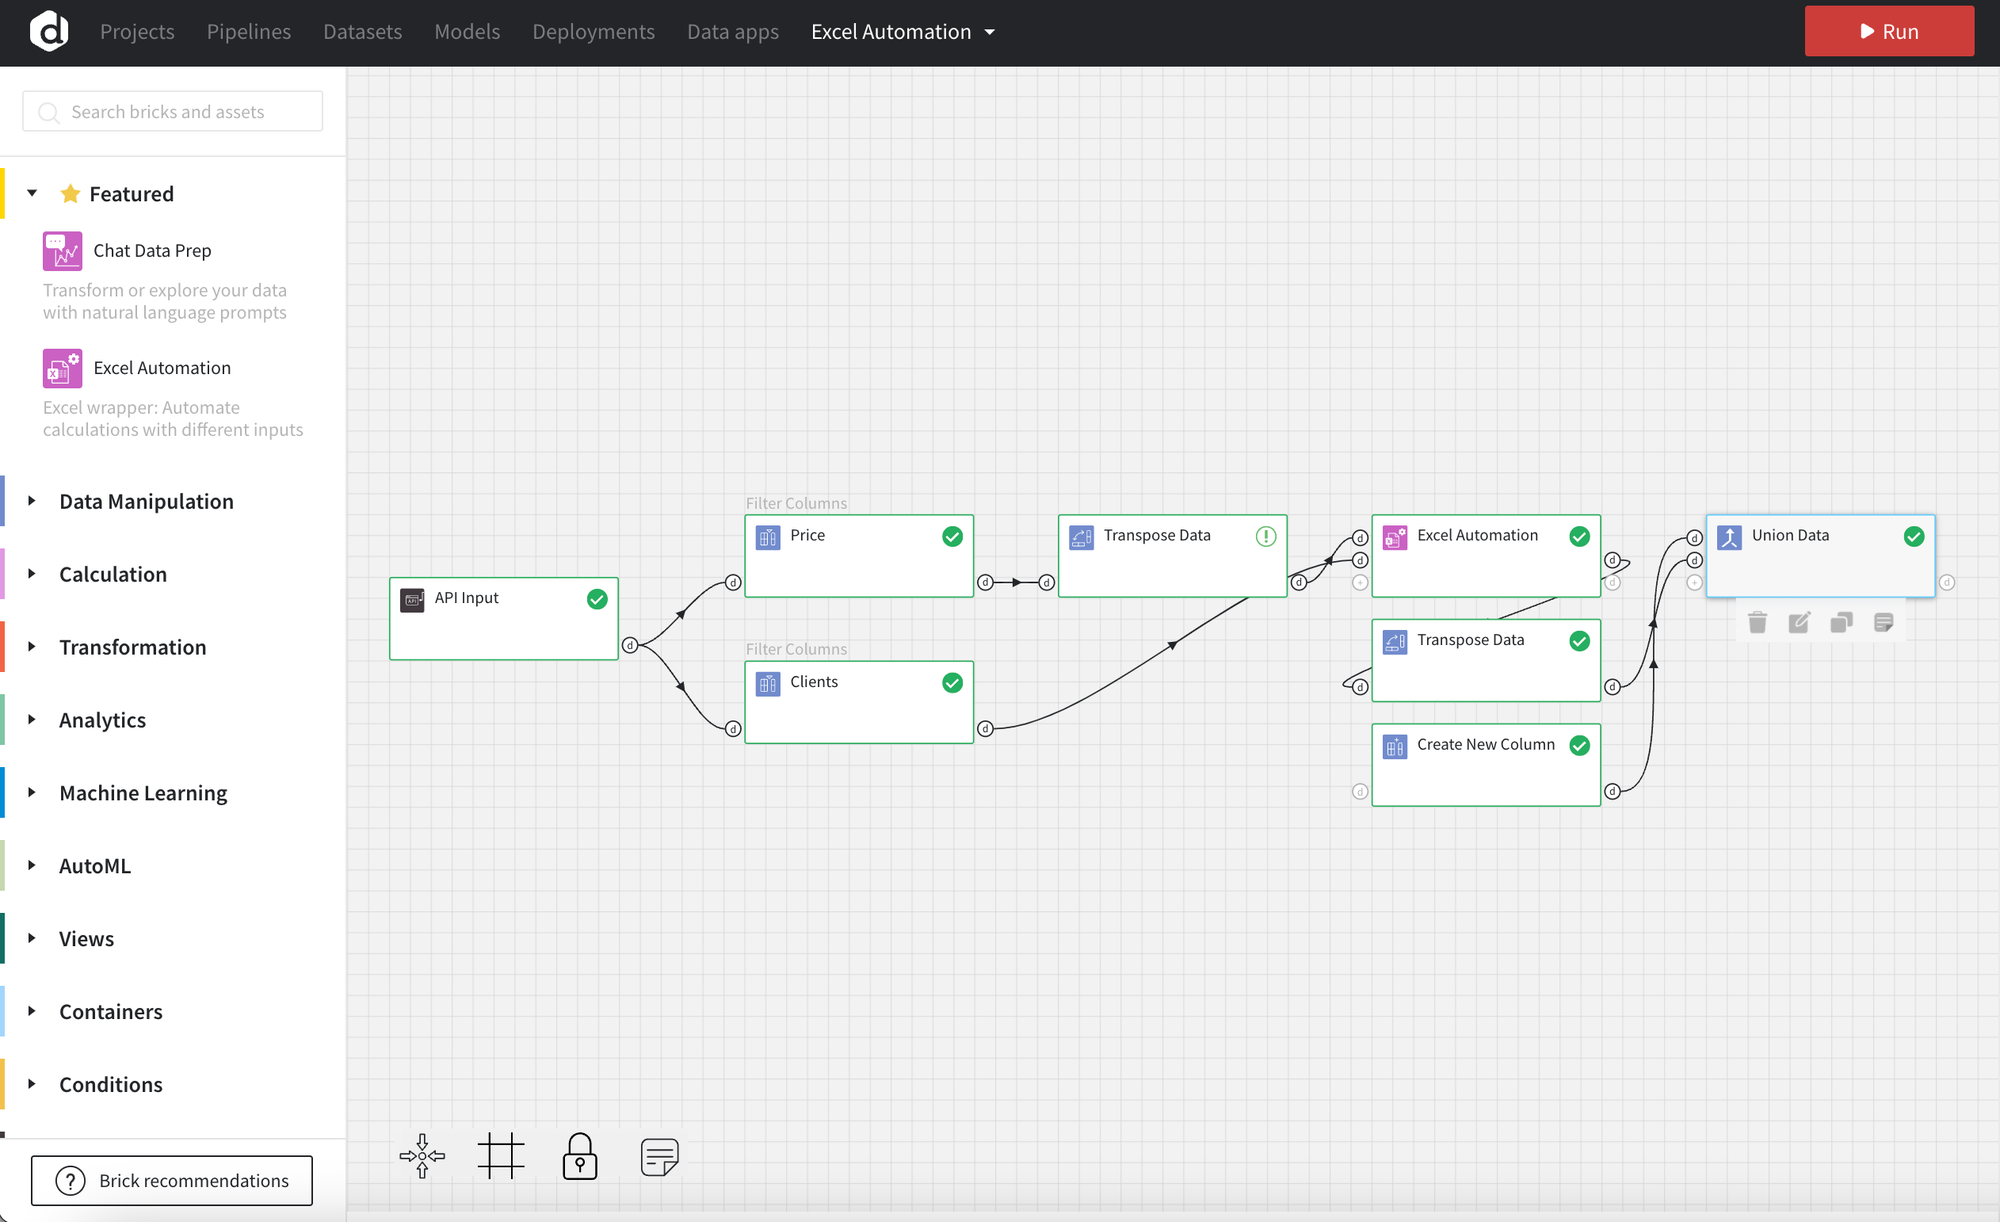
Creating the pipeline
Here’s the illustration of the full pipeline, let’s go step by step to create it.
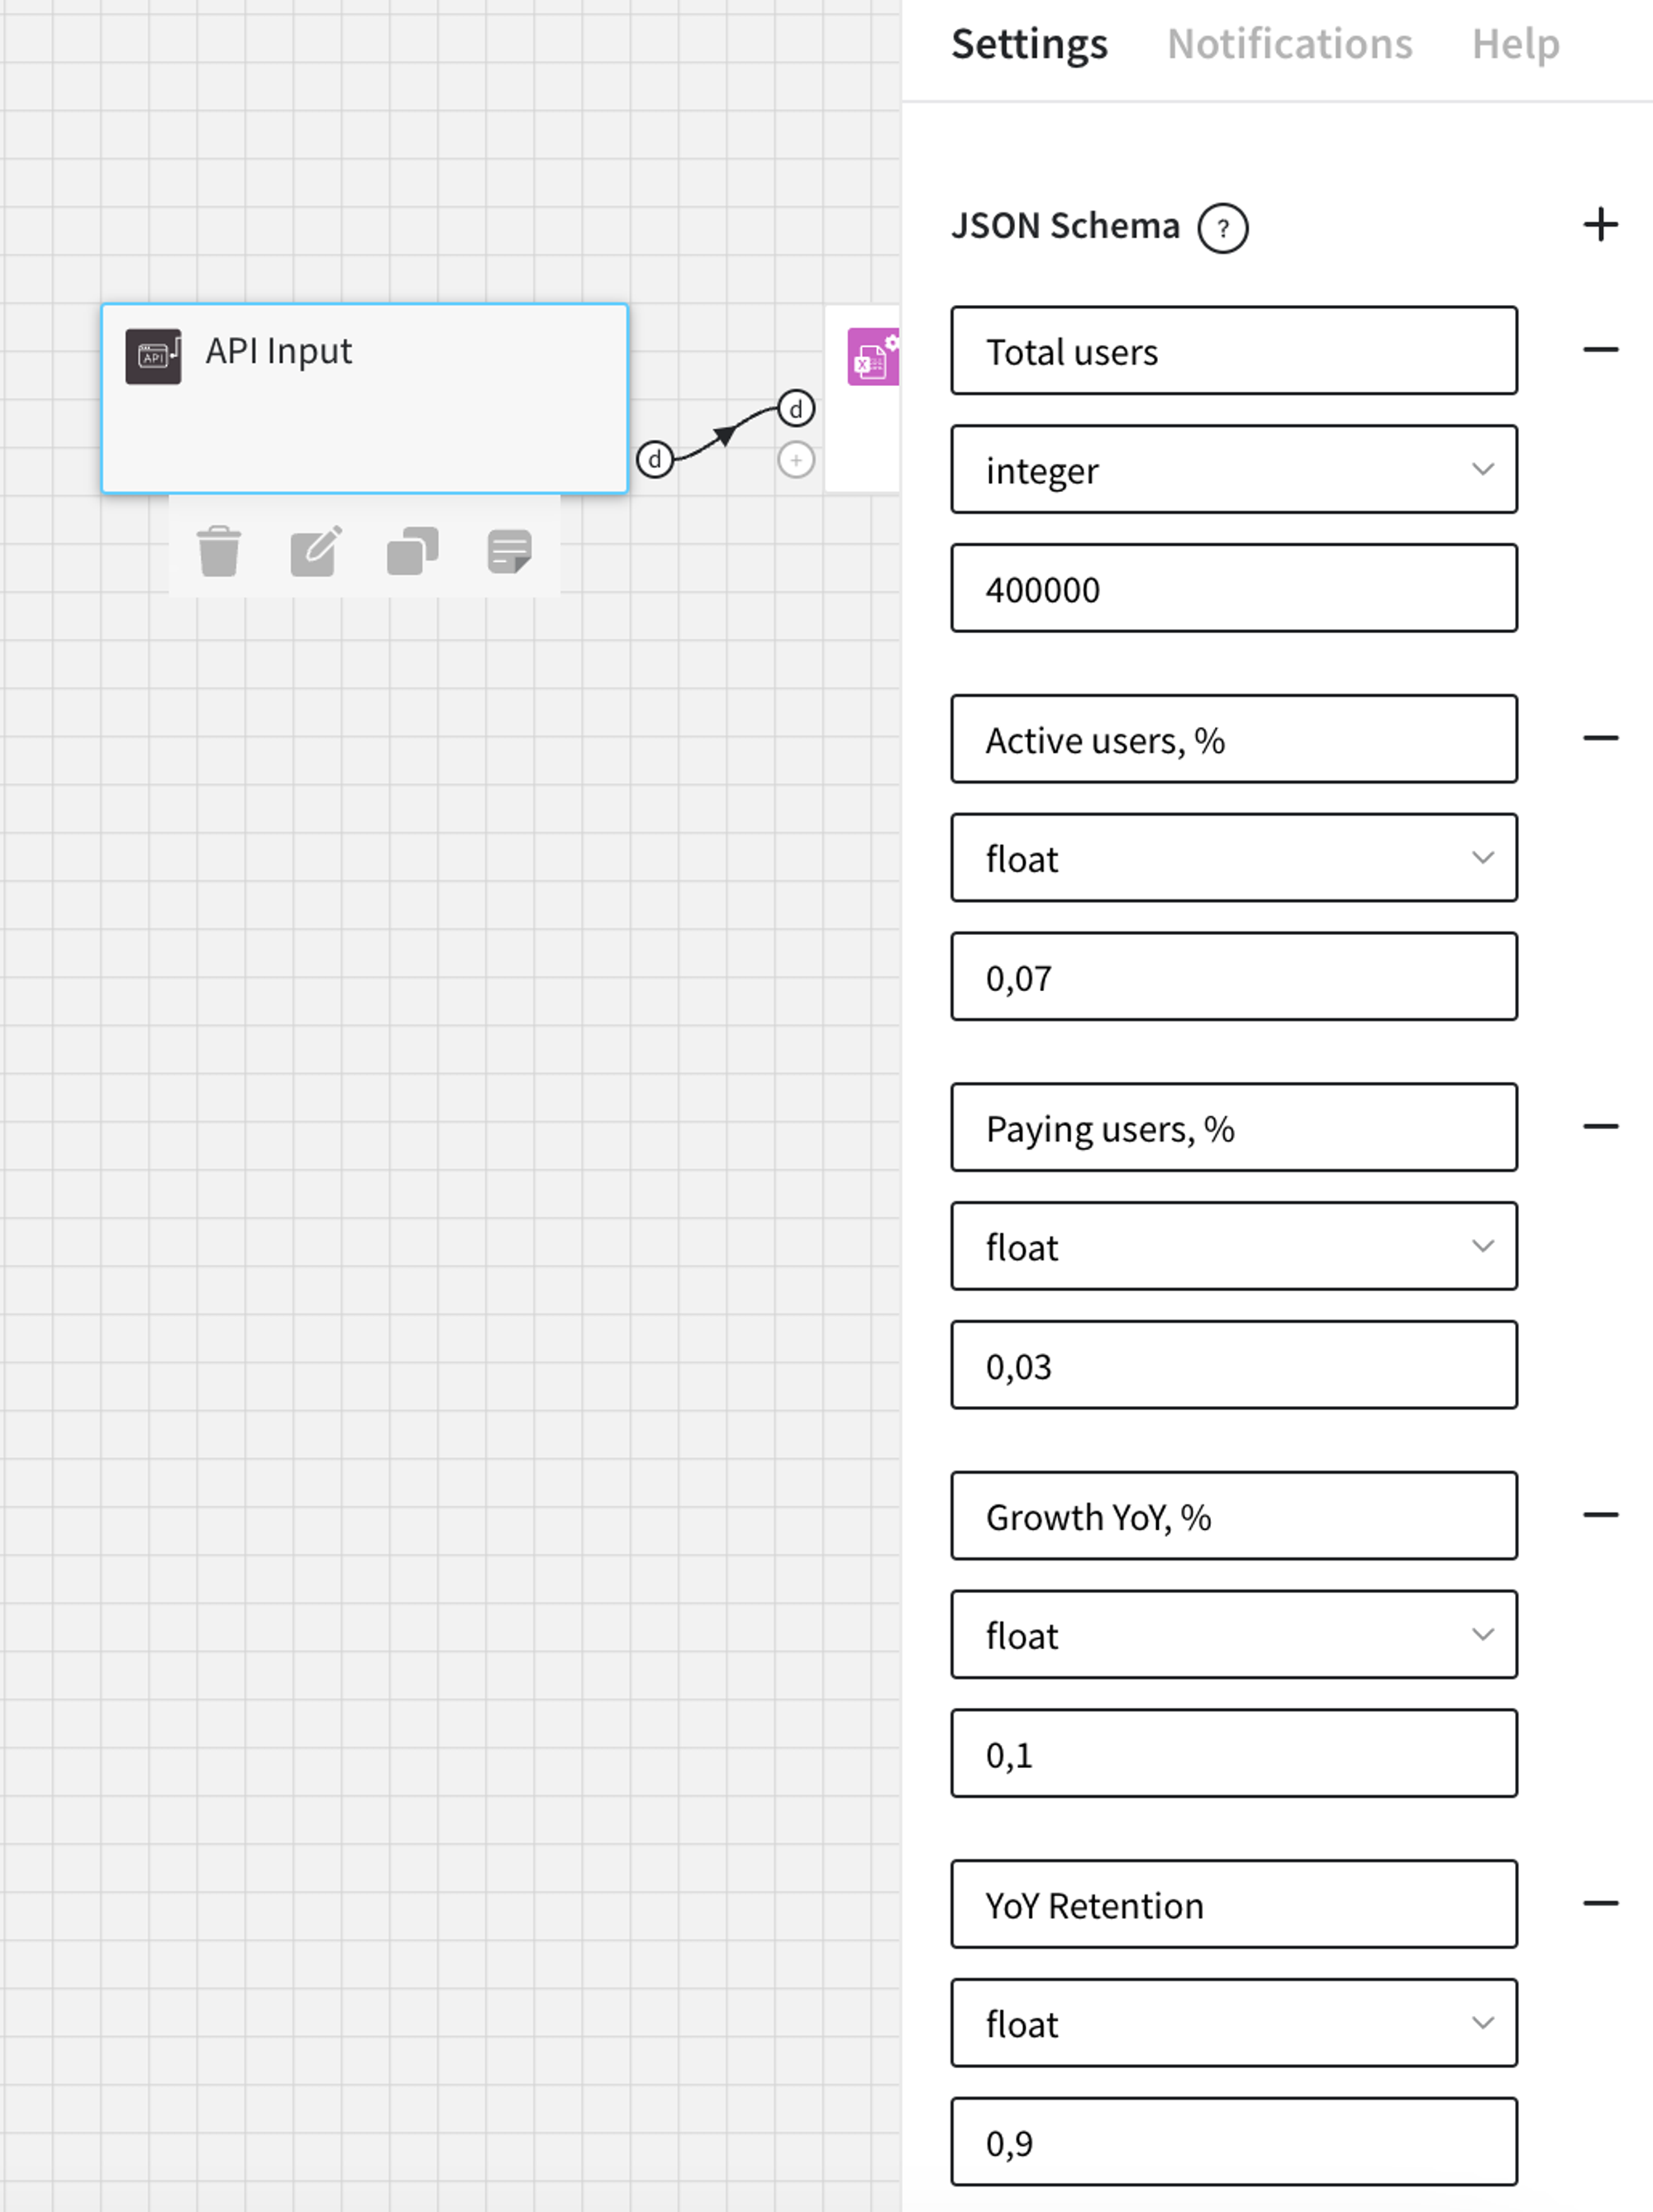
1. Defining Input Values
Using API input brick to create the dataset with all of the variables of the model.
For convenience, we are separating the dataset into two:
- Price - one column with all the package prices,
- Clients - variables representing all the other variables.
We may do that using Filter columns brick.
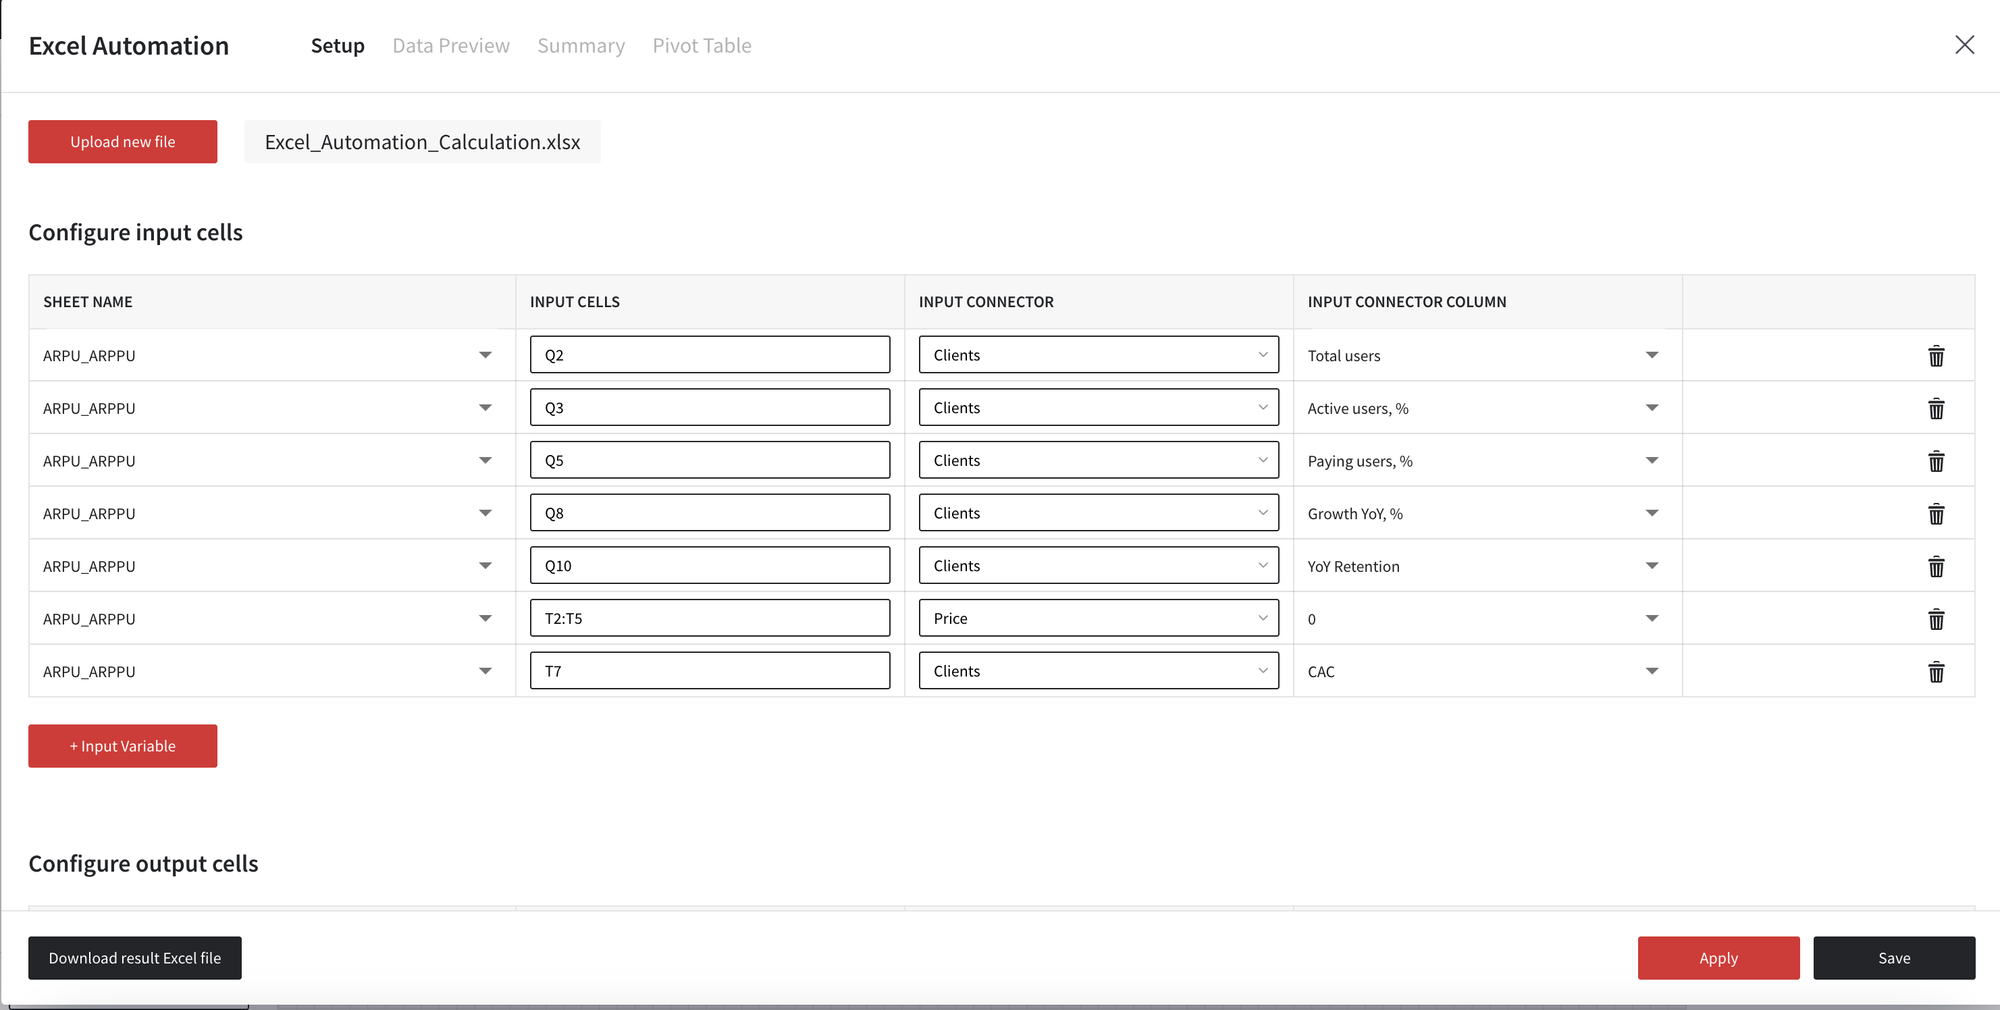
2. Configure Excel Automation Brick
- Upload Excel File: Begin by uploading the Excel file you wish to automate.
- Configure Inputs: Set up the input cells with the appropriate data connections and cell references.
We are mapping the cell address in Excel to the input dataset columns.
- Configure Outputs: Define the output cells where the automated results will be collected.
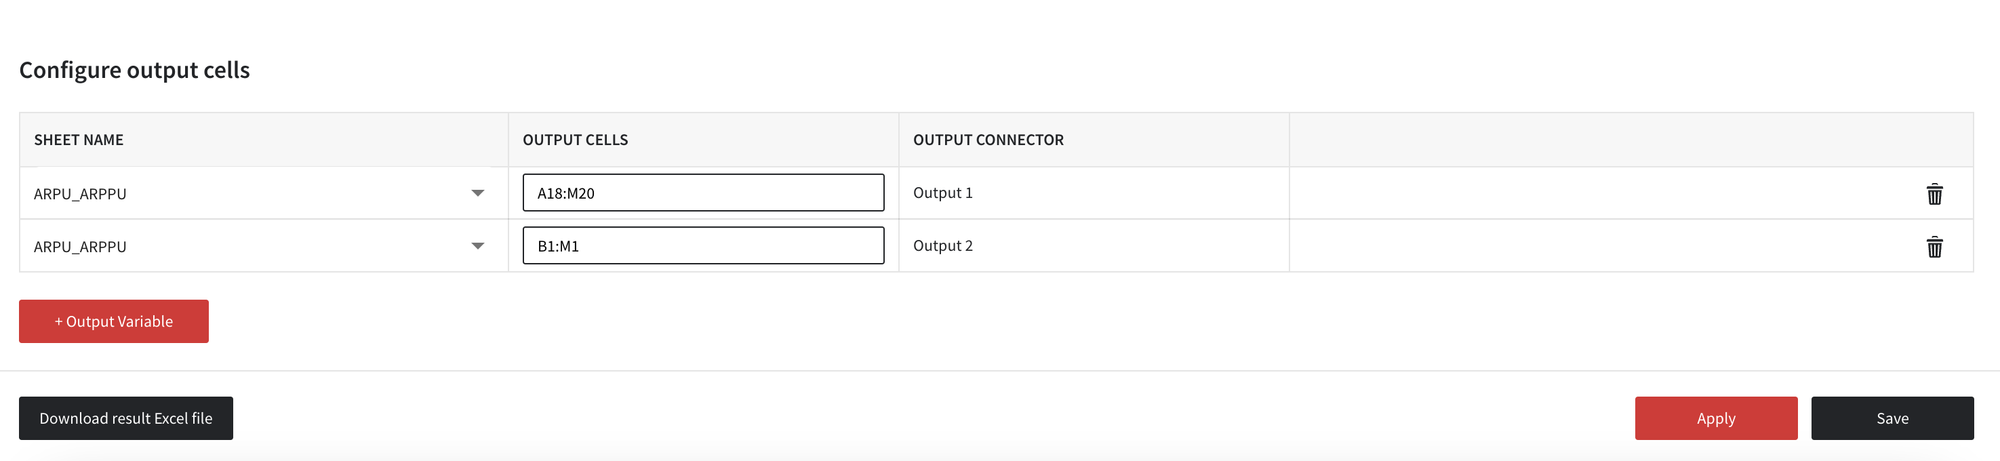
- Apply Configuration: Once the input and output cells are configured, click 'Apply' to set the automation in motion.
- Save Configuration: Save the current configuration to be used in future automation tasks.
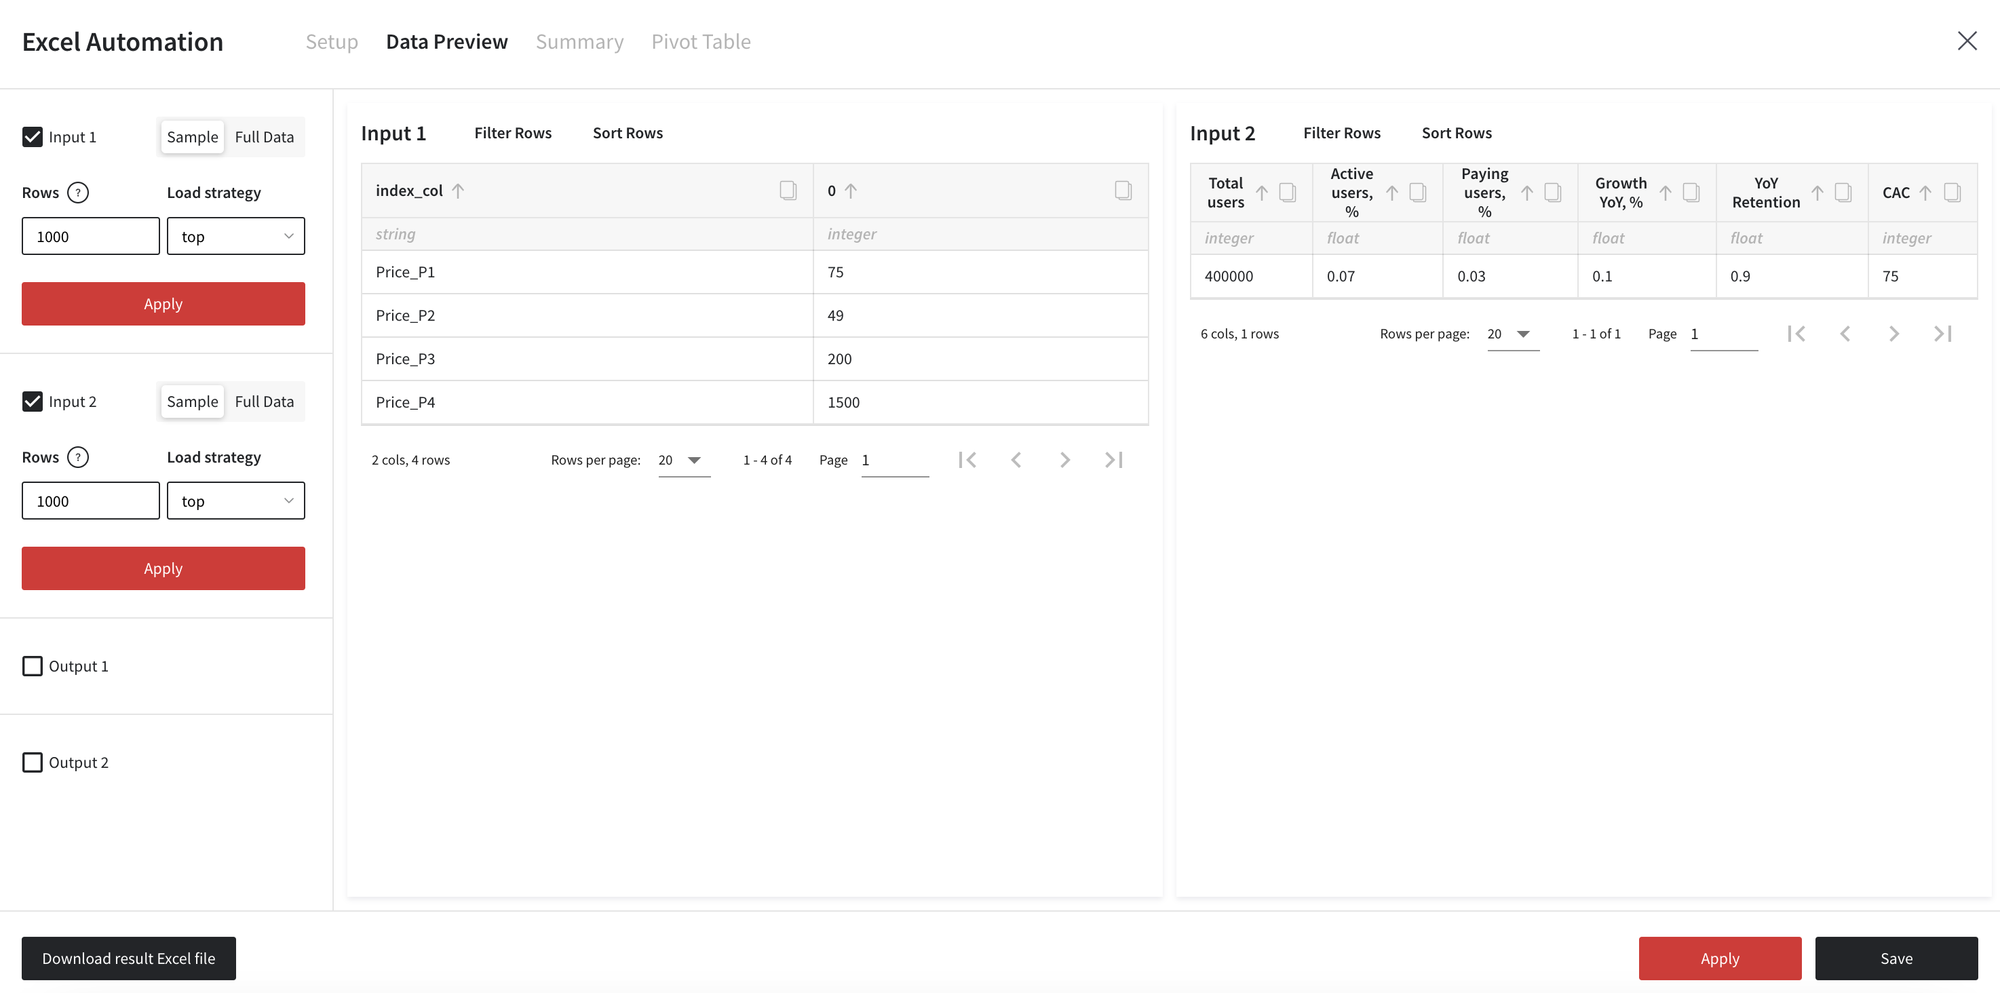
Run the pipeline to see the calculated revenue.
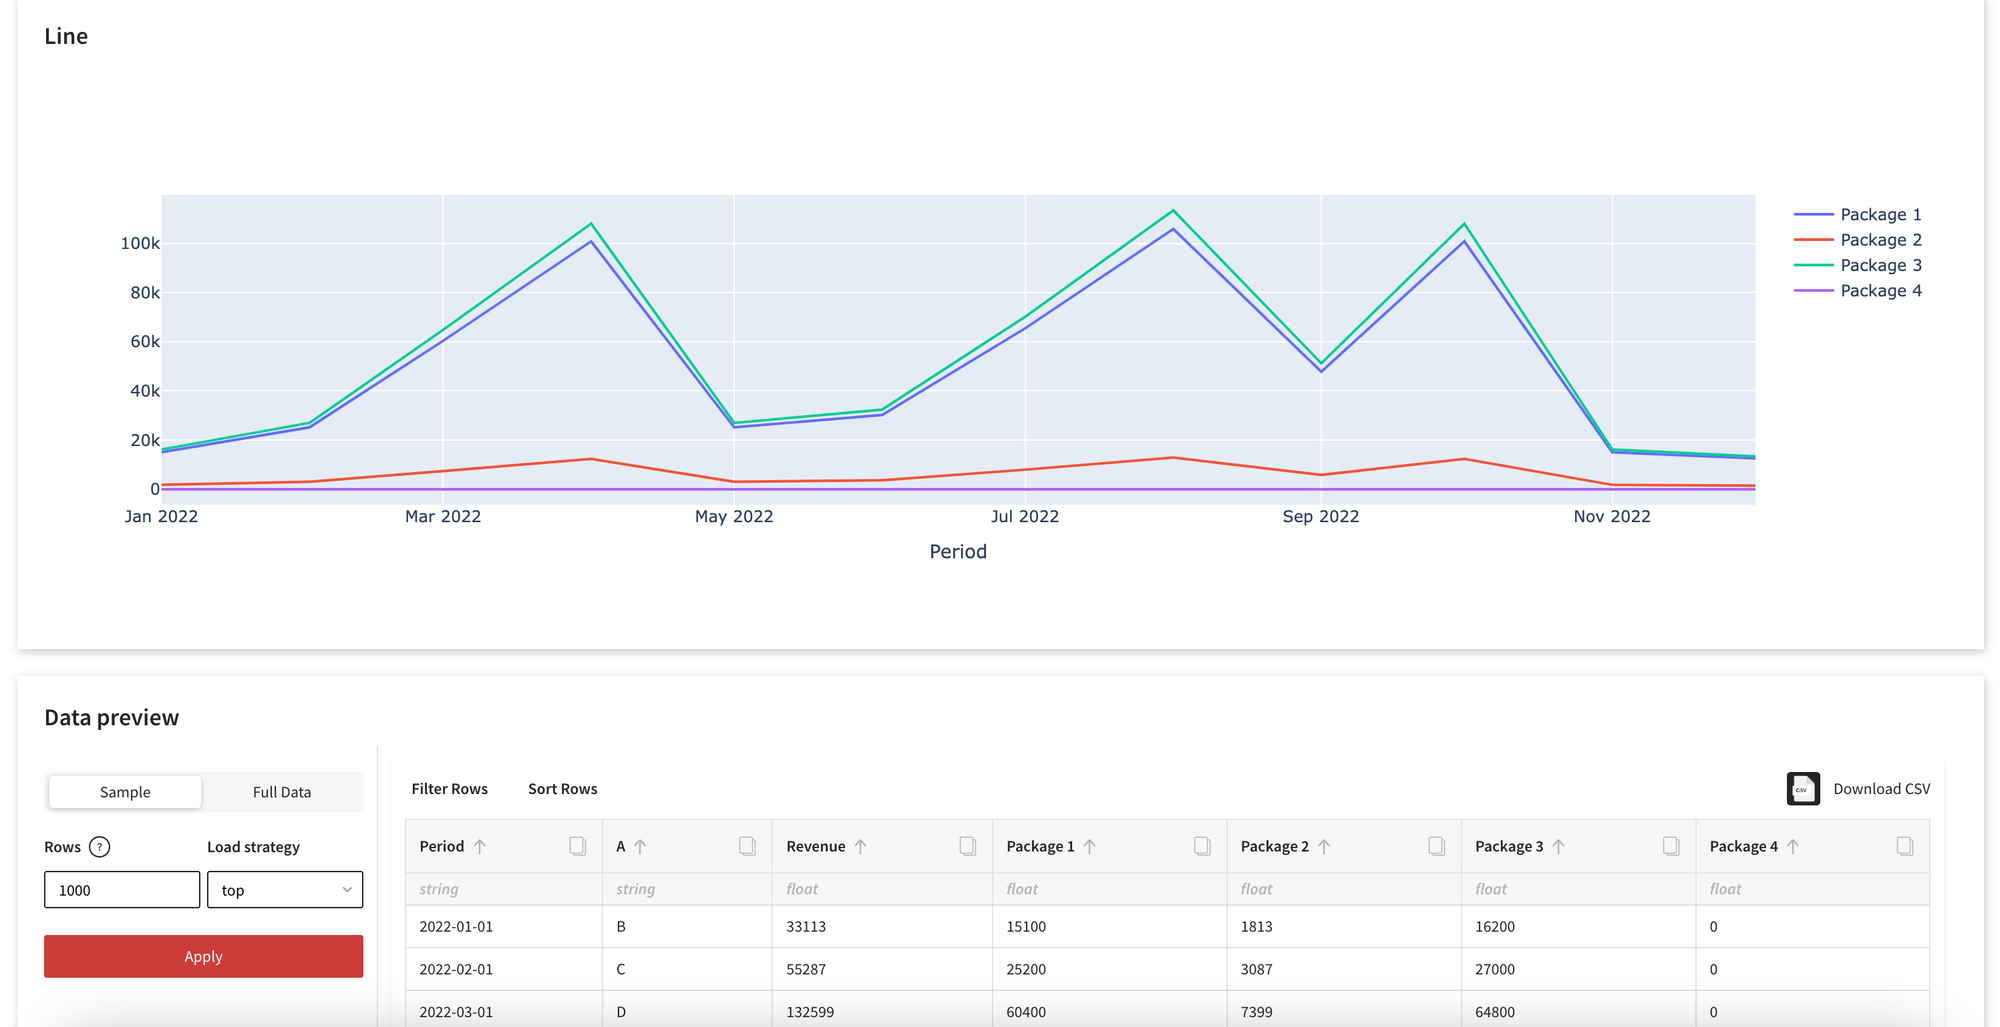
3. Visualize the Data
To visualize the output dataset we need to transpose the table using Transpose Data brick.
Visualize the revenue via Charts brick with simple line chart and add to the pipeline API Output brick to use the output data in the data application.
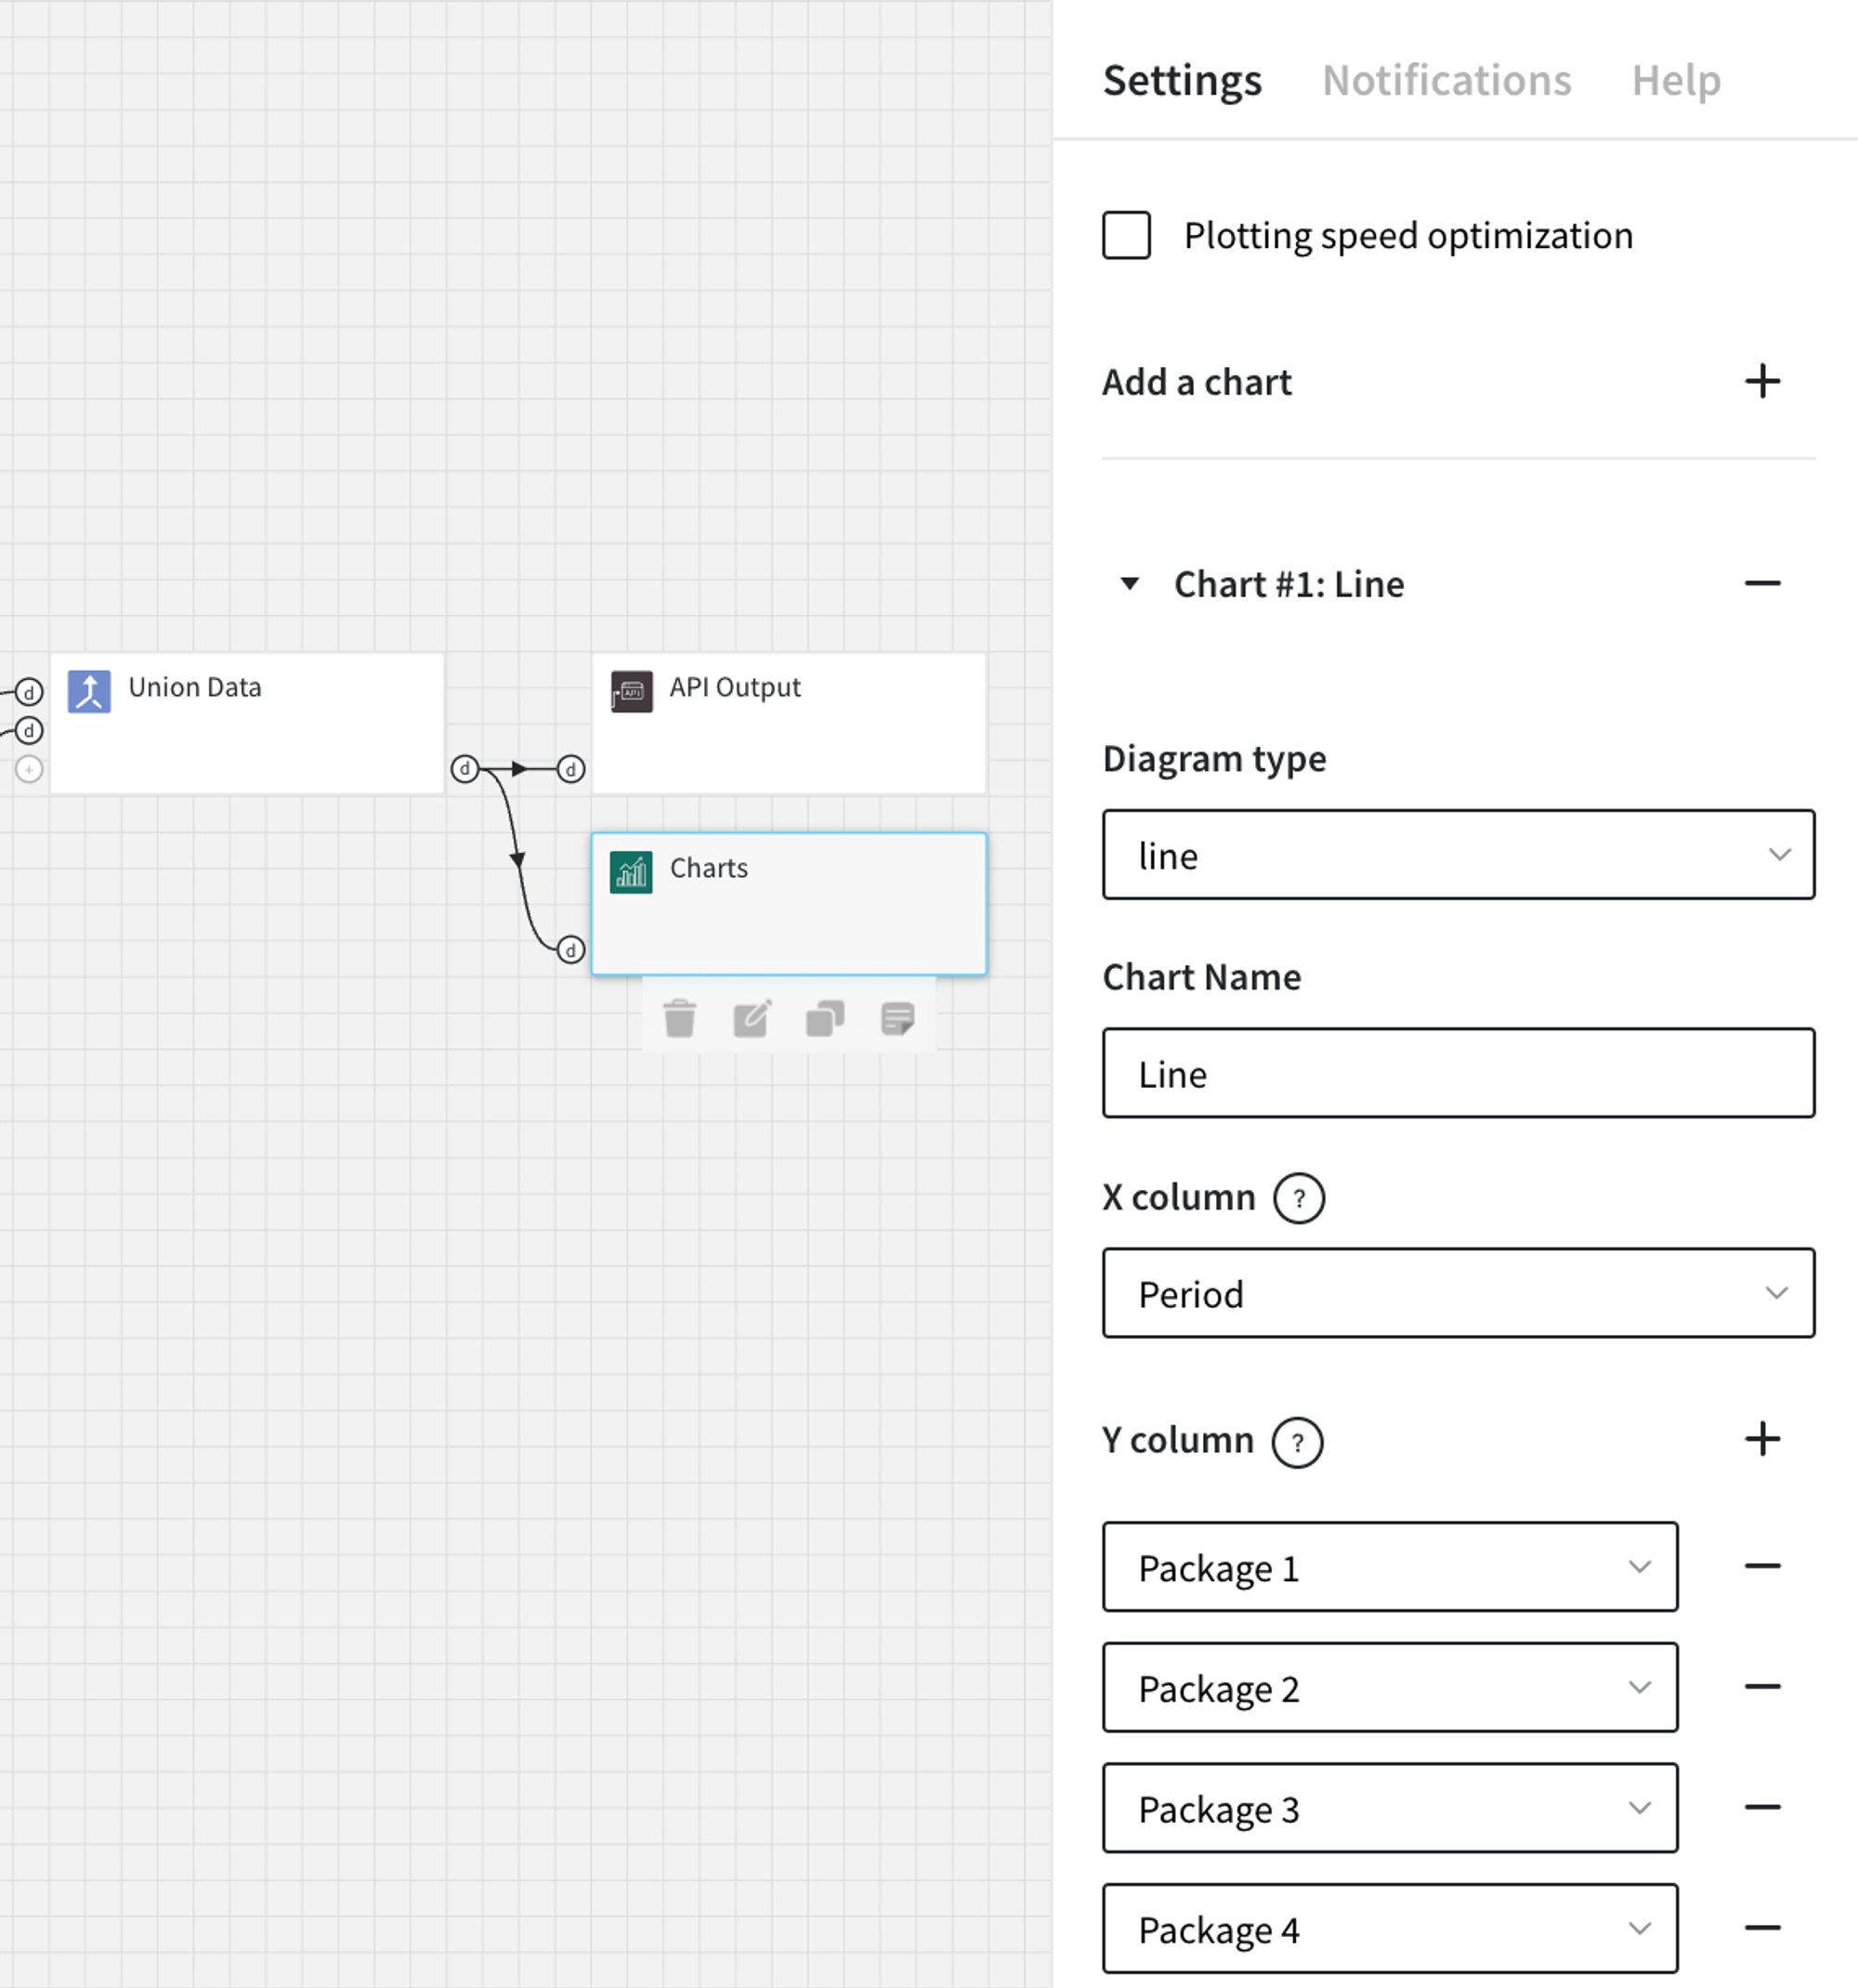
Now we are ready to run the business model in various scenarios changing the values in the input!
4. Build Data Application
Last step to present the results and share with the team - create the data application for our business model.
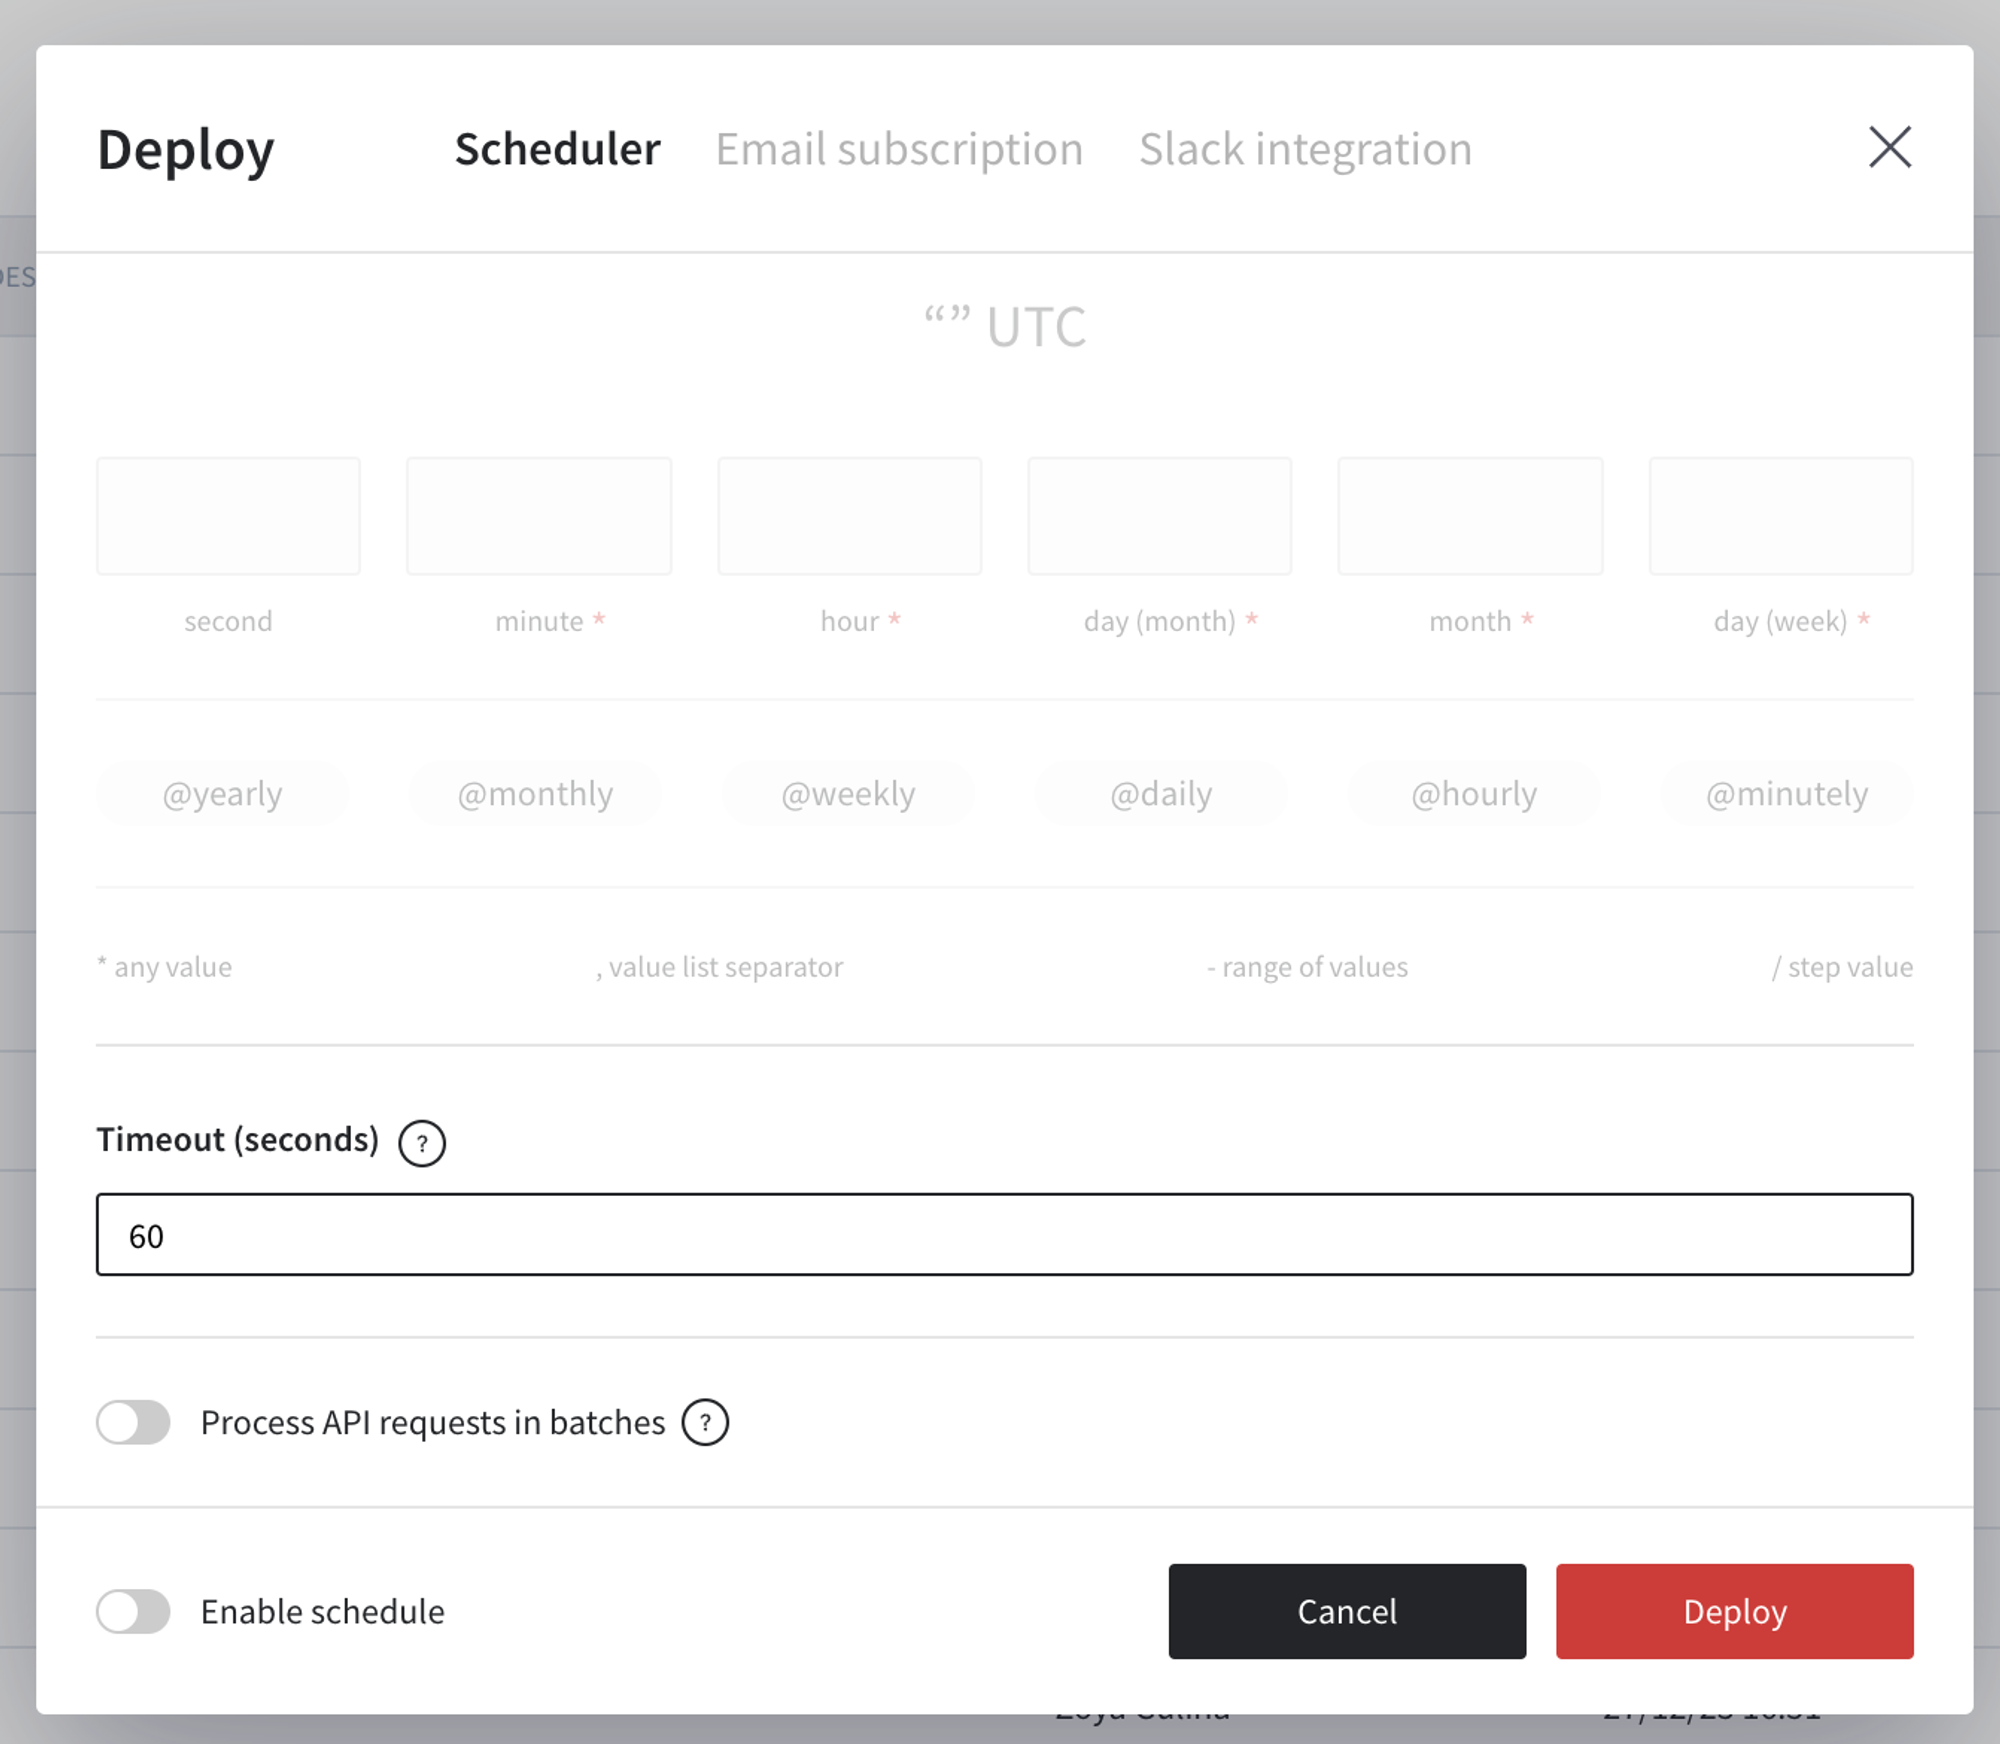
- Deploy the pipeline. We do not need to set the schedule.
- Create the Data App out of the deployed pipeline
- Select the widgets to be displayed - pipeline trigger, chart and output data.
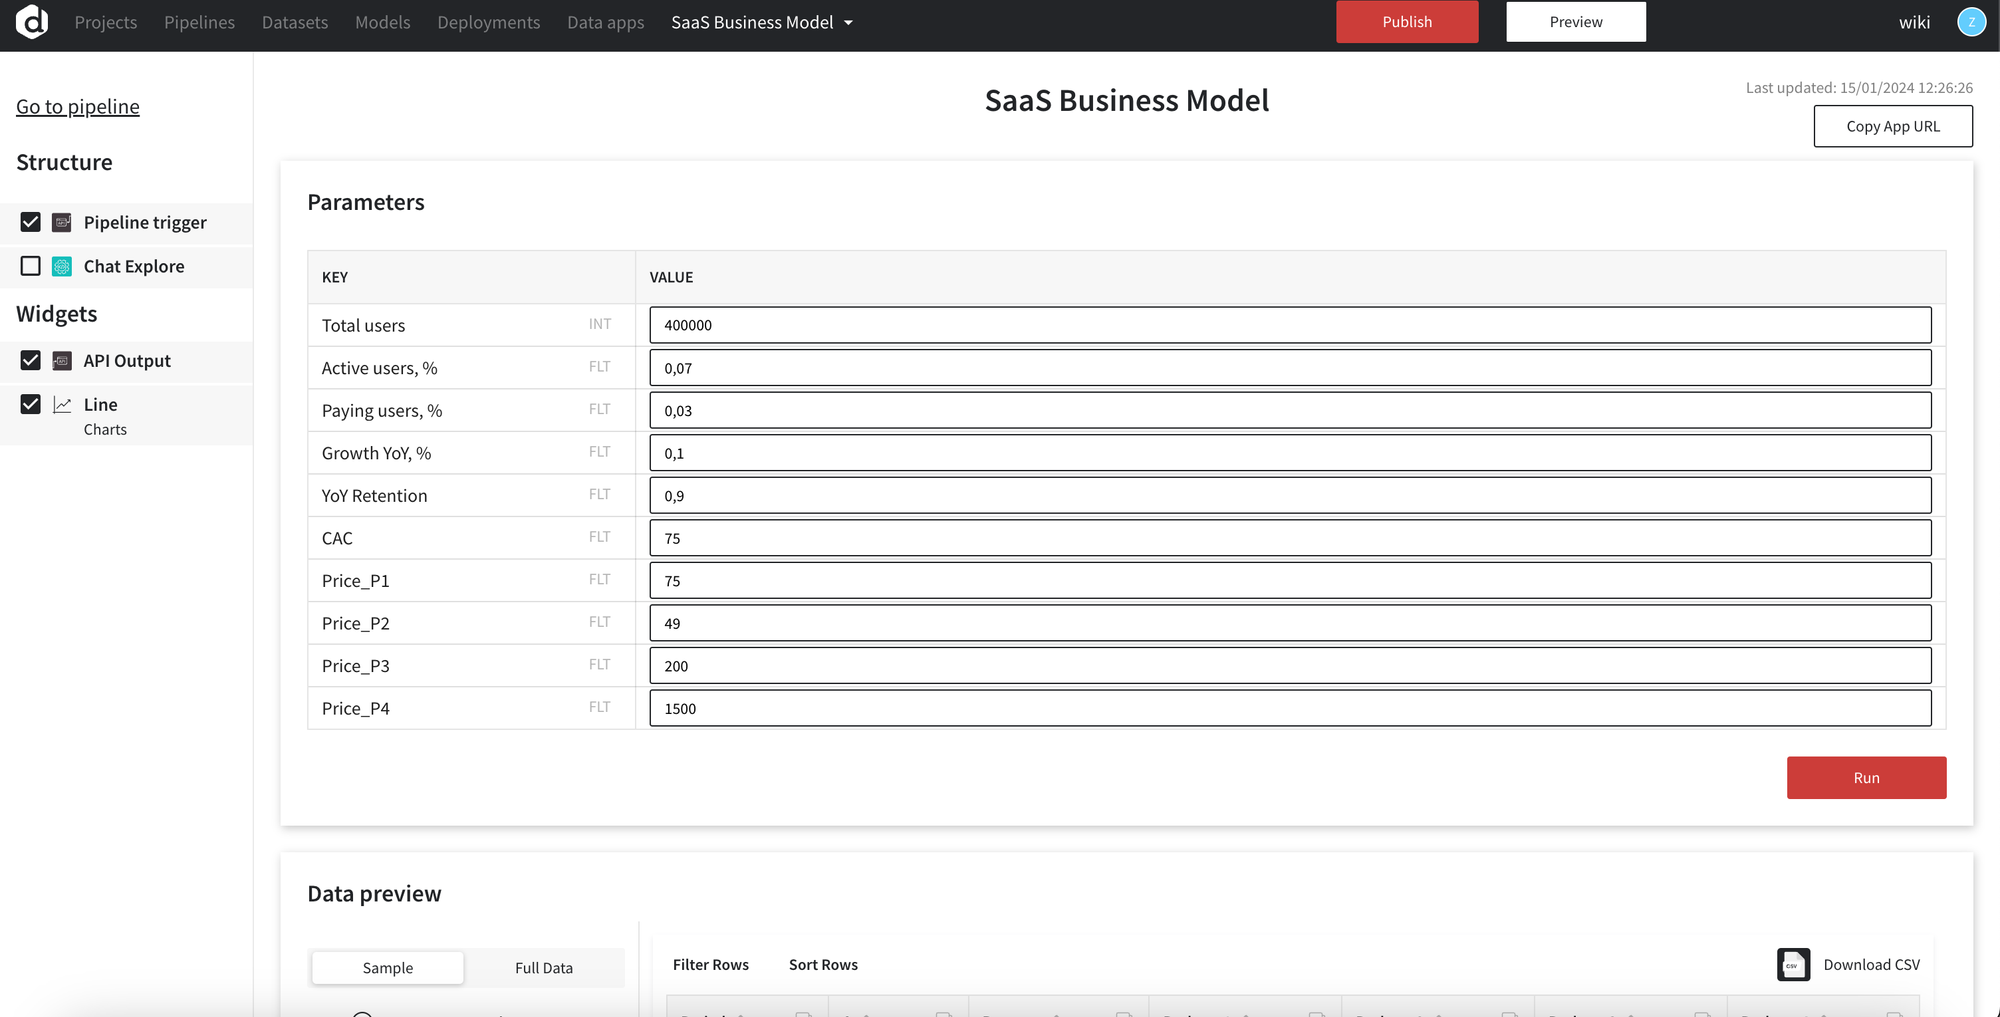
- Publish the App and share with the team!