Description
Pipeline for the demonstration of Datrics' abilities to preprocess and aggregate historical data from different files related to different departments' store sales. The main goal is to align data and create one united dataset on a store level for further processing.
Problem Statement
As an input, we have 4 CSV files appr. 50k of rows each with historical data from 4 different countries with data from stores within each of them. All files contain the same data with alike column names and mixed data types.
Data Processing Scenario
Each file contains data related to the store, department, regional activity for the given dates, and total weekly sales. After aligning column names each file contains the following fields:
- Country - the country id
- Store - the store number
- StoreSize - the store size
- Department - the department number
- Date - the first day of the week
- Temperature - average temperature in the region
- FuelPrice - cost of fuel in the region
- MarkDown1-5 - anonymized data related to promotional markdowns that the store is running. MarkDown data is only available after Nov 2011 and is not available for all stores all the time. Any missing value is marked with an NA.
- CPI - the consumer price index
- UnemploymentRate - the unemployment rate
- IsHoliday - whether the week is a special holiday week
- WeeklySales - total amount of sales
The second step is to filter columns that are needed for further union and aggregation. As we want to have sales data on a store level, columns such as MarkDown1-5 are filtered.
The next step is to unite all the data in one dataset and align the data types within it, and aggregate the dataset to get weekly data for each store.
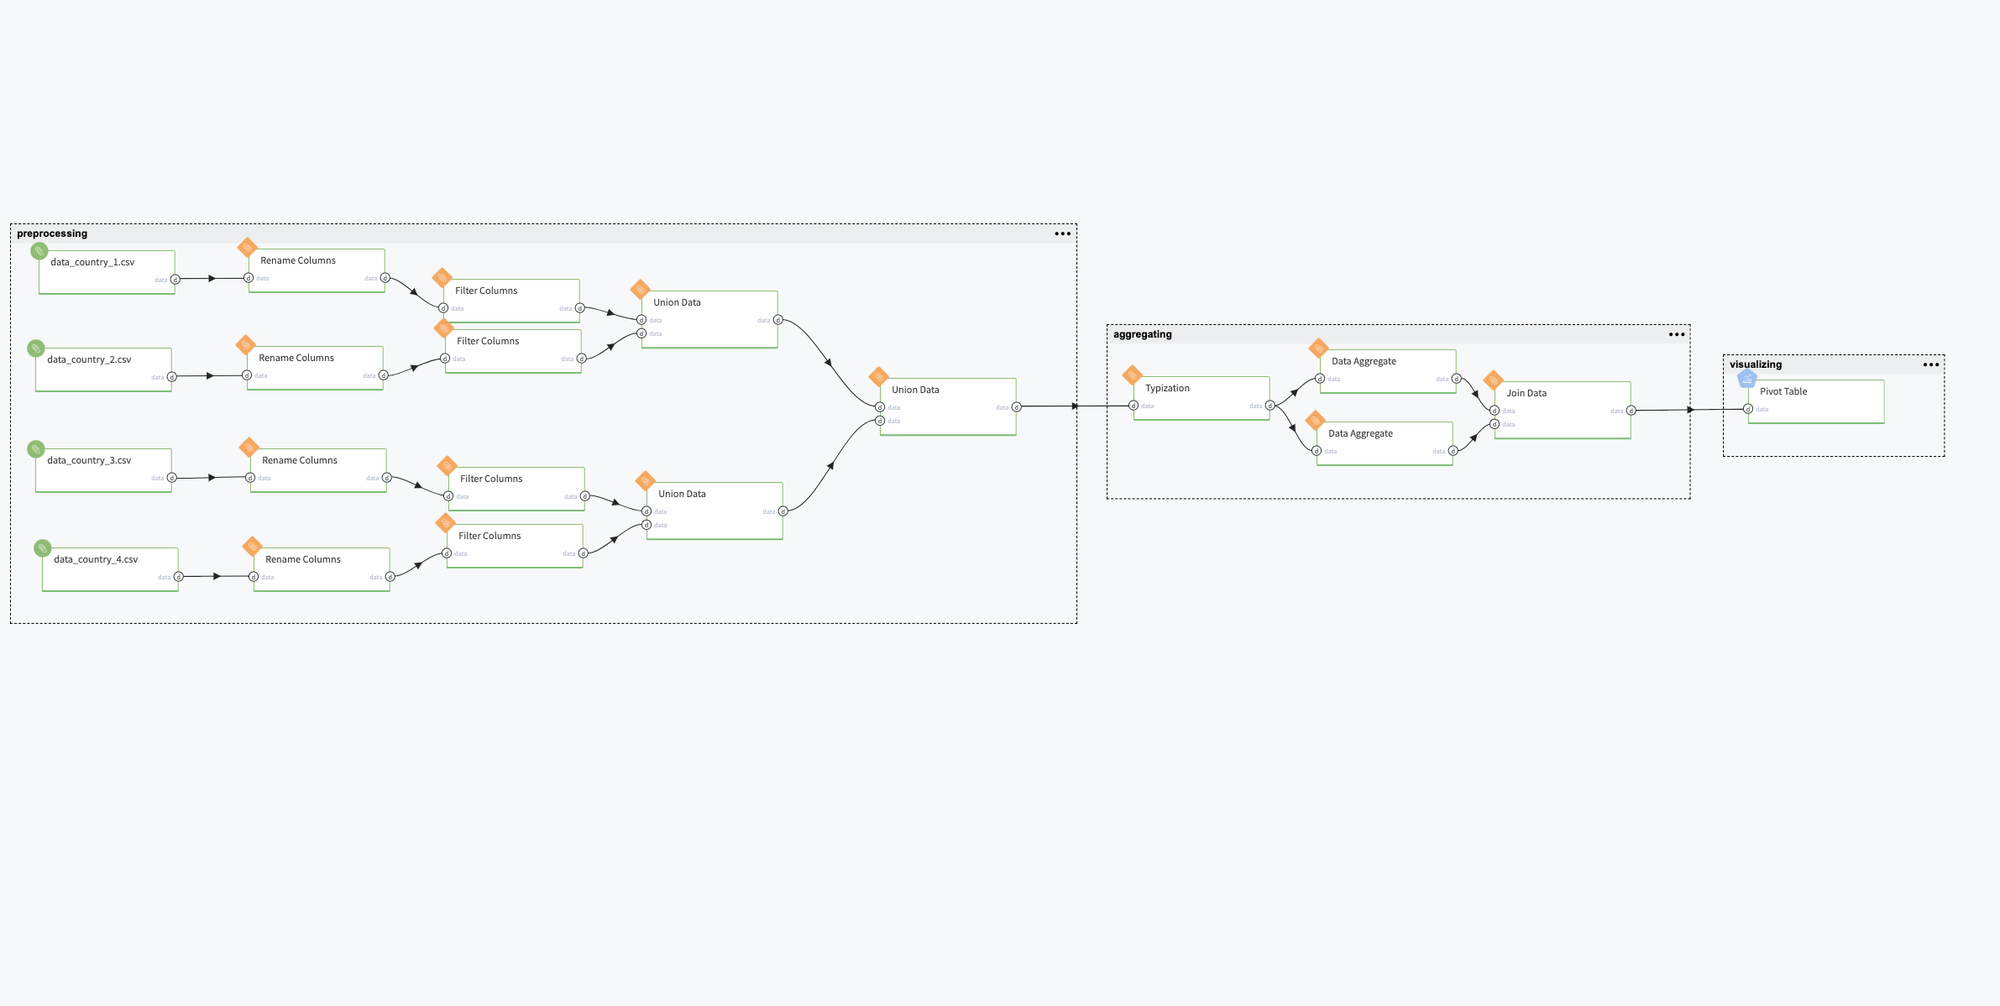
Pipeline
All bricks are logically gathered into three sub-groups: preprocessing, aggregating, and visualizing data.
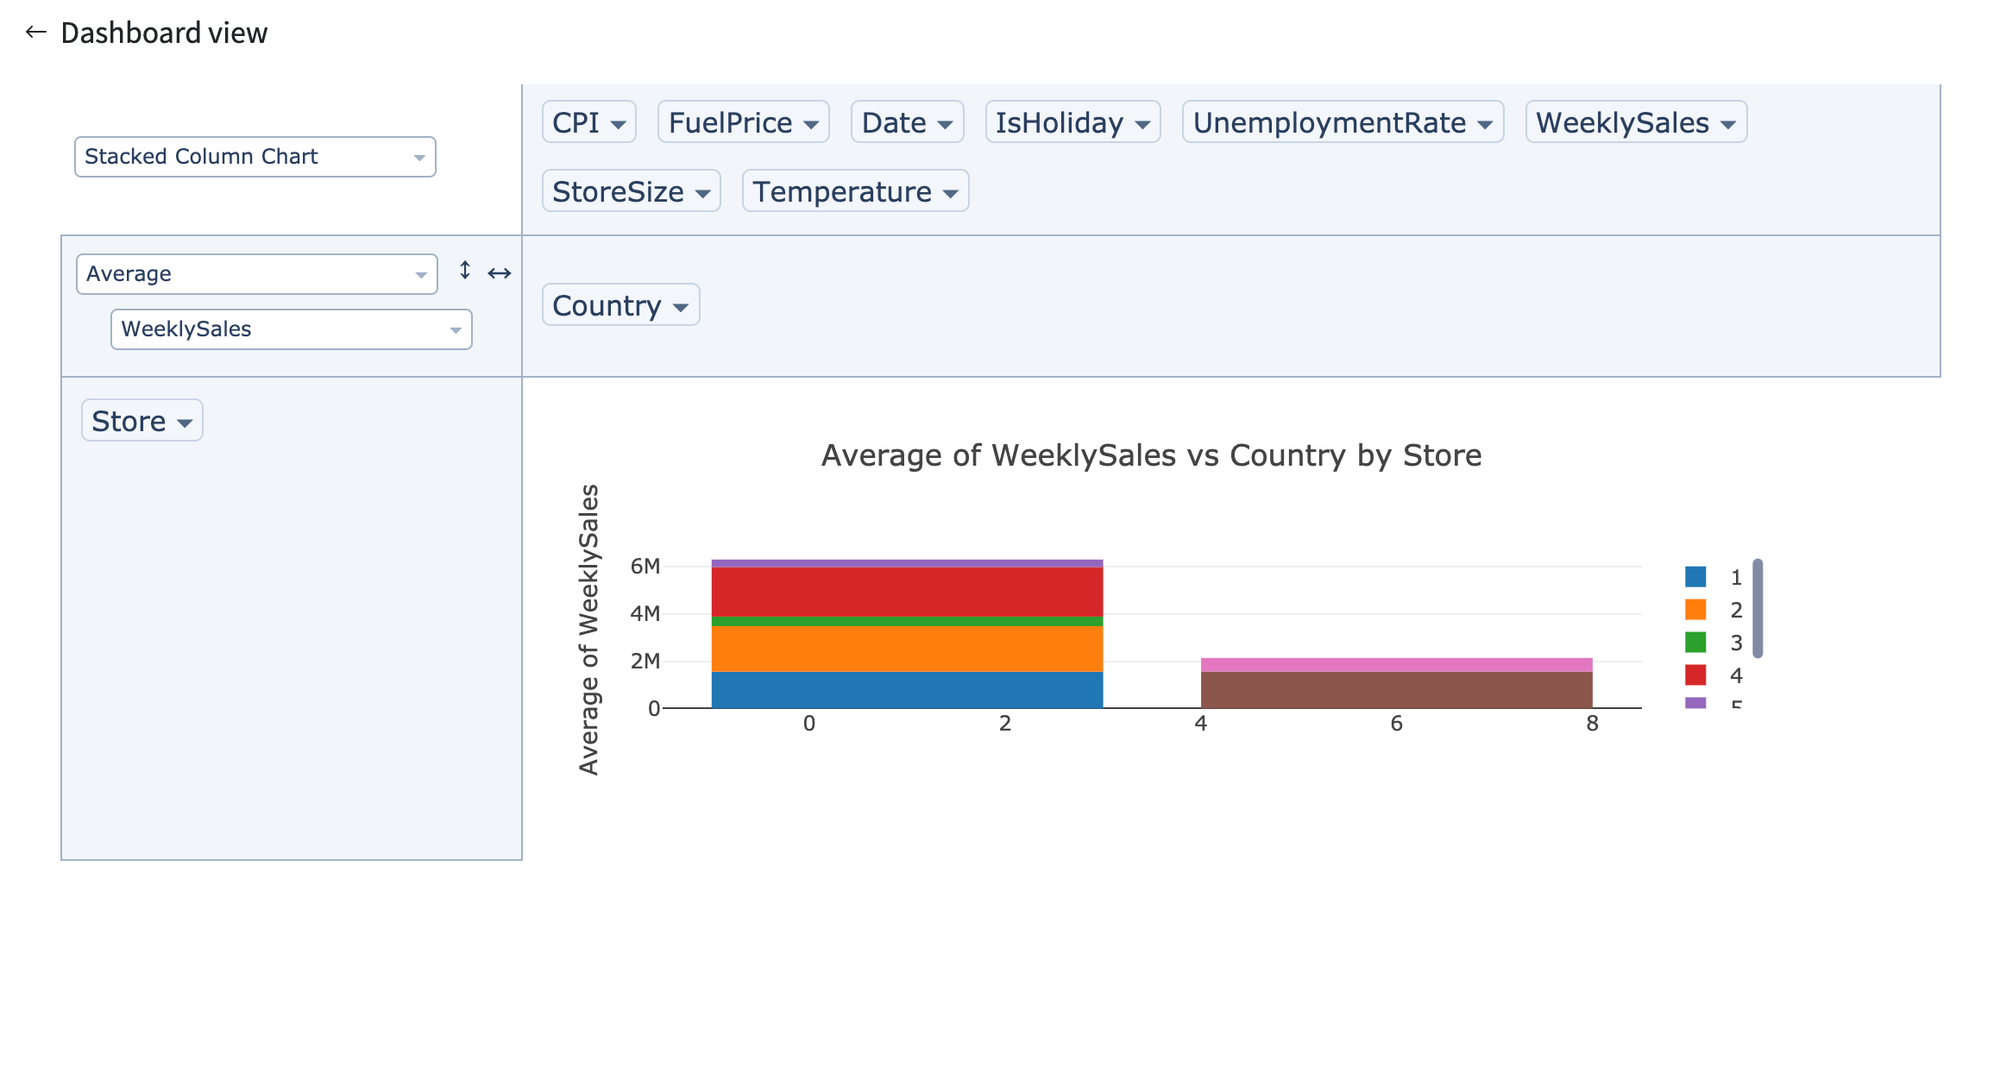
Final dataset can be visualised using Pivot Table.