General Information
This brick provide a tool to make a non-visual exploratory data analysis (EDA).
EDA is highly used as one of the first step of analysis. It helps in discovering patterns, finding anomalies, understanding the nature of data and formulating hypotheses.
The main metrics that data analyst looks at are mean, median, quartiles, maximum and minimum, kurtosis, skewness, dispersion and correlation.
Mean calculates as a division of sum to count.

Median is the middle element of the data sample. If the difference between mean and median is significant, it may say that the data sample contains outliers.
Percentiles are used to divide data sample into equal parts and analyze how far they are from each other. Usually quartiles are used. Quartiles divide data sample into 4 parts. Second quartile is the same as median. If the difference between quartiles is huge, then there are significant outliers in the sample.
Kurtosis and skewness describe the shape of the distribution. Kurtosis tells about tailedness of the variable, while skewness shows if the distribution is symmetrical or not. Negative skew means that variable is asymmetrical with a left-sided tail, positive skew means right-sided tail.
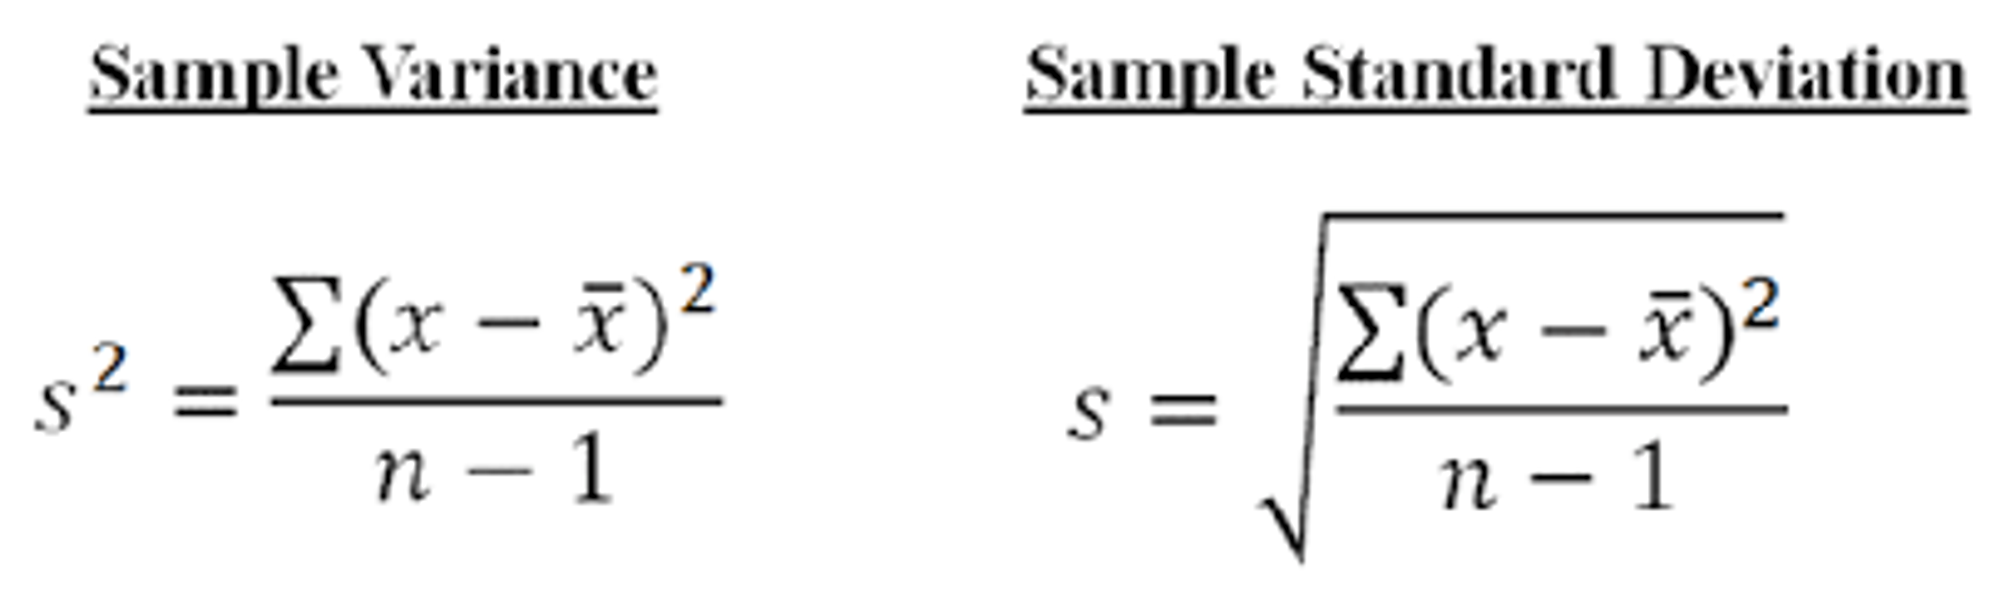
For analyzing dispersion several metrics can be used. Variance shows how far values spread out from the mean and it is calculated as squared difference between values and mean. Standard deviation is a square root of variance.
Correlation is an important part of EDA because it helps in analyzing the relationship between variables. The closer a correlation coefficient is to 0 the lower relationship between the two variables. If the correlation coefficient is greater than 0, there is a positive relationship. If the correlation coefficient is lower than 0, it says about the negative relationship.
Description
Brick Location
Bricks → Analytics → Exploratory Data Analysis
Brick Parameters
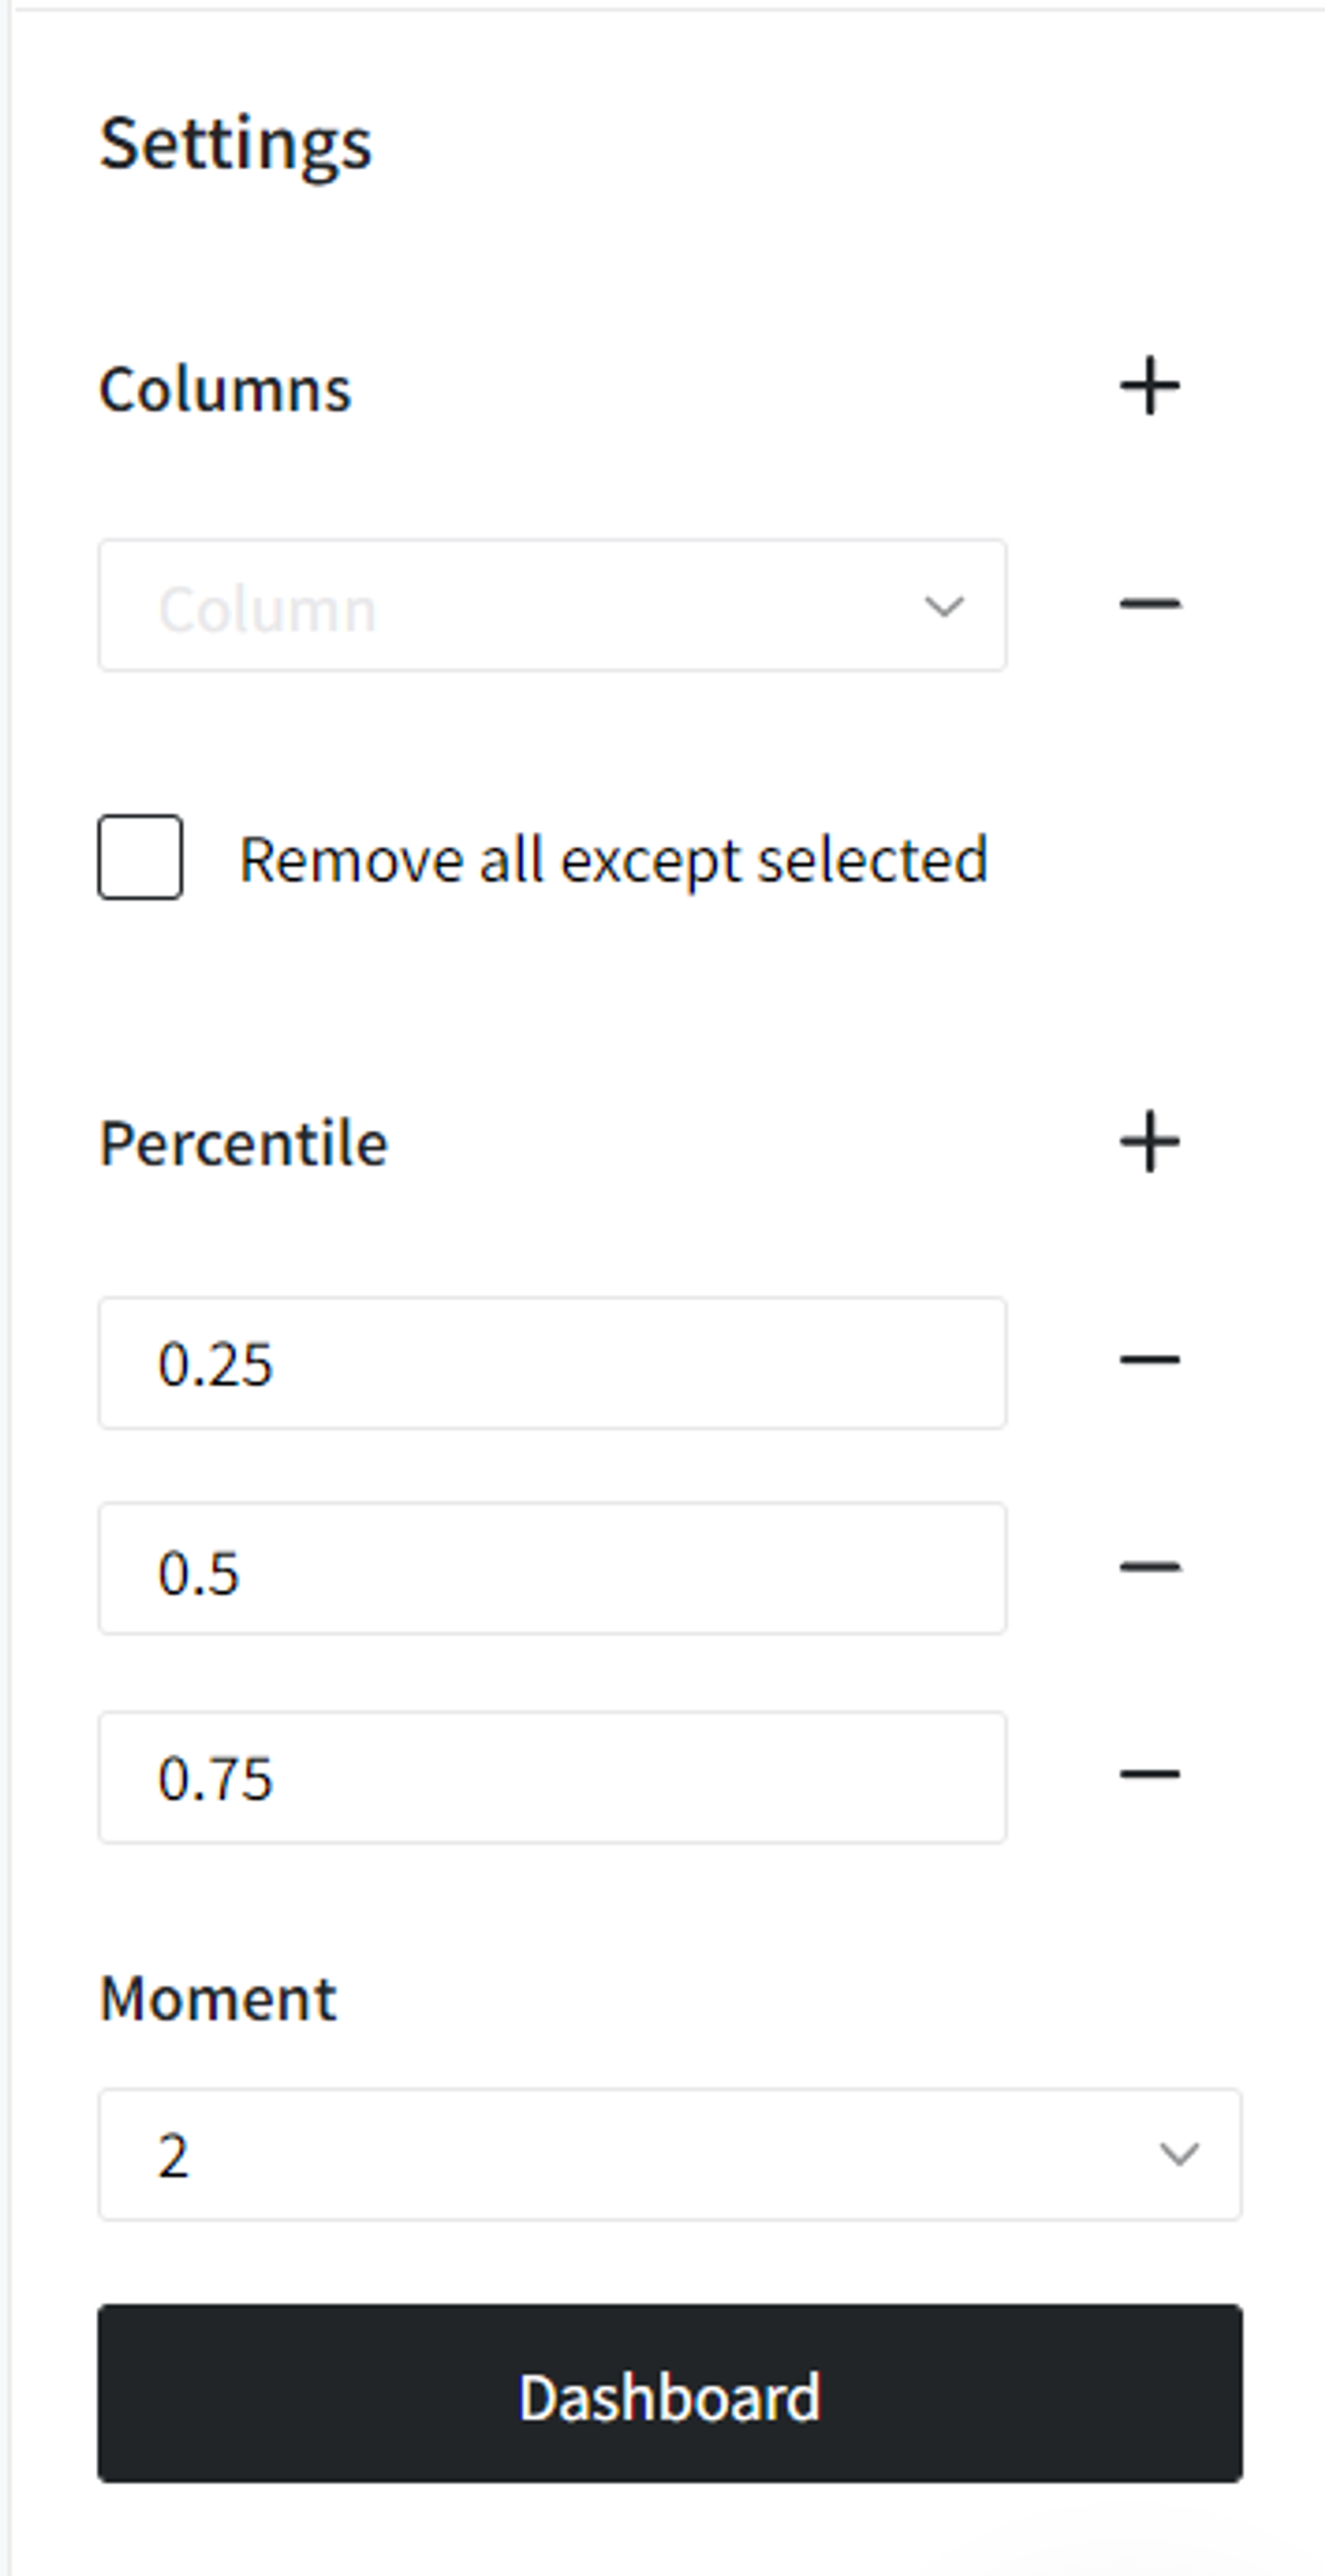
- Columns
If you have columns in your data that need to be ignored and not be shown in the dashboard or in the output data, you should specify them in this parameter. To select multiple columns, click the '+' button in the brick settings.
In addition, you can ignore all columns except the ones you specified by enabling the "Remove all except selected" option. This may be useful if you have a large number of columns while needing just several of them to be analyzed.
- Percentile
You can specify which percentiles you want to include. As a default, there are written quartiles (0.25, 0.5, 0.75).
- Moment
If moment is 1, it will be equal to mean.
2nd moment shows variance (set as default).
3rd moment shows skewness.
4th is equal to kurtosis.
Brick Inputs/Outputs
- Inputs
Brick takes the dataset.
- Outputs
Brick generates a new data set that contains grouped information on central tendencies, percentiles, dispersions, distributions and outliers for each column that was not filtered out.
Example of Usage
Choose brick Exploratory Data Analysis and choose what percentiles and moment you want to be shown. Then, run the pipeline to activate Dashboard button.
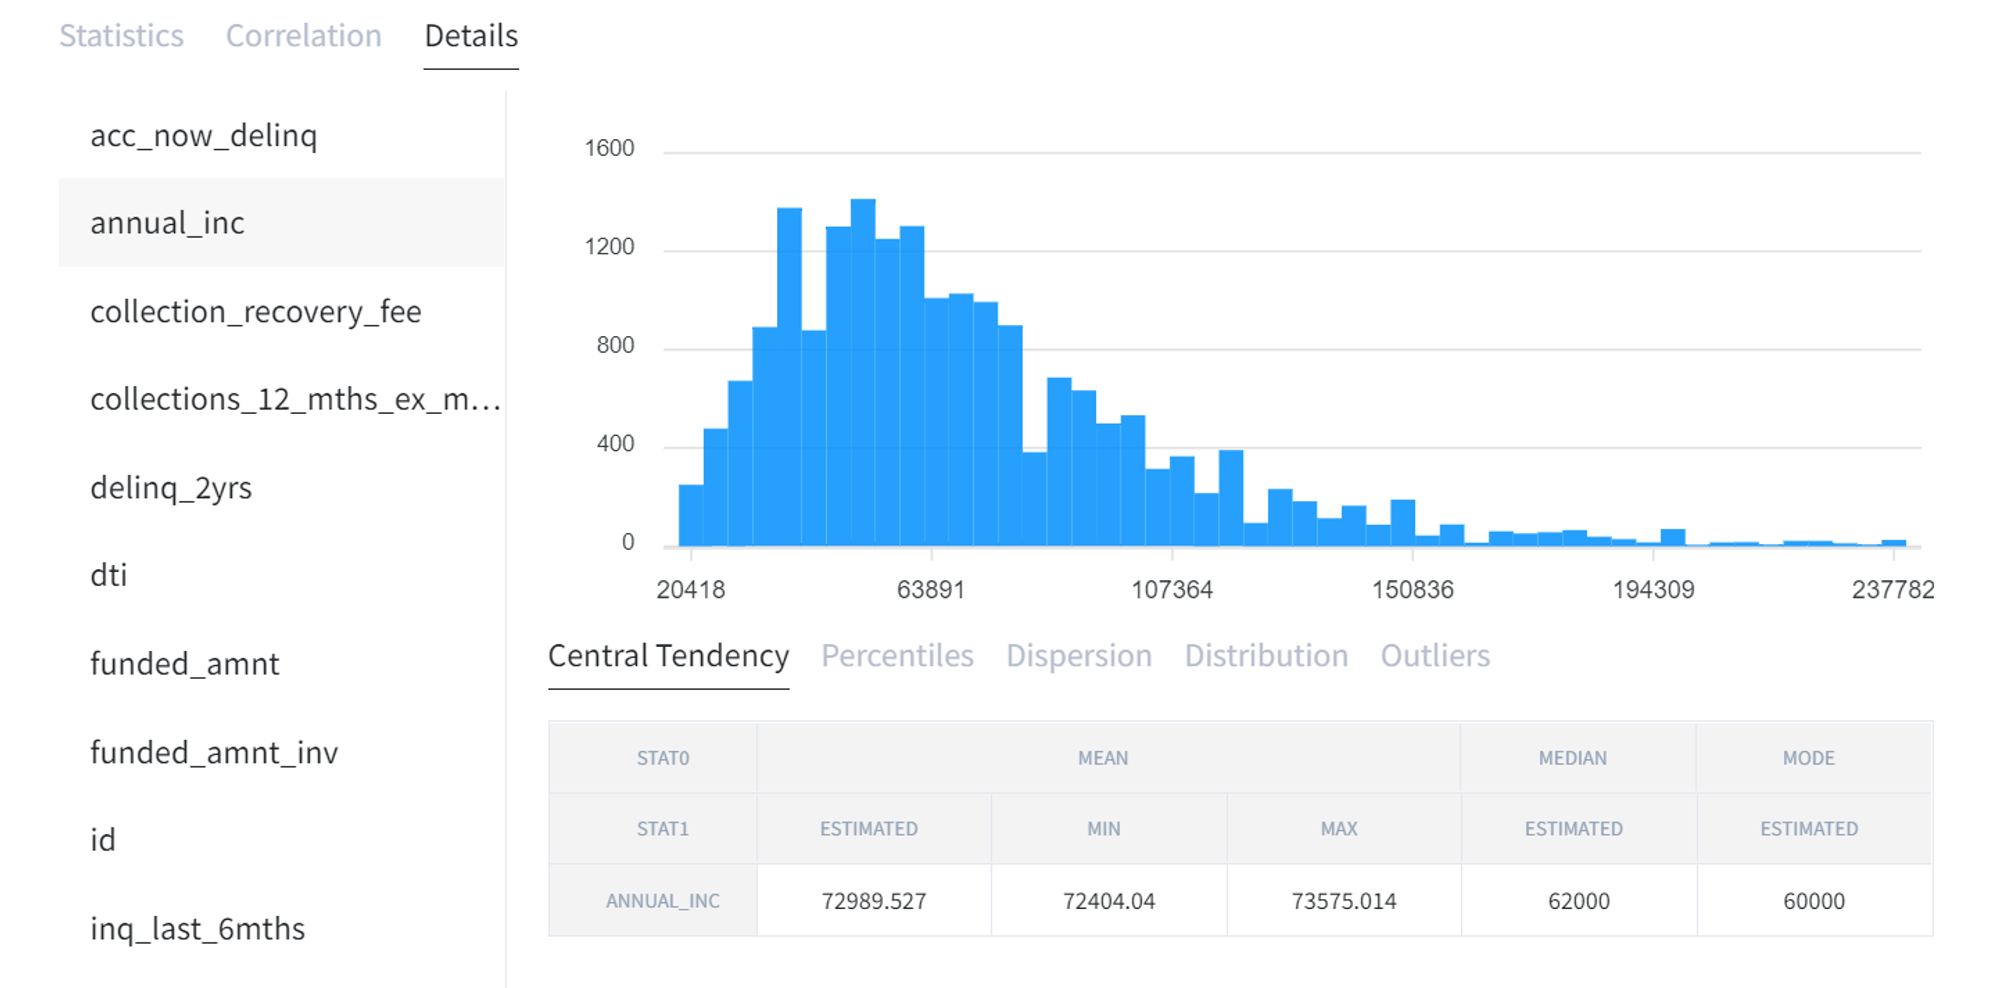
In Dashboard mode there are three main tabs: “Statistics” for summary statistics, “Correlation” shows correlation matrix and “Details” displays data for each column with histogram. Before using this brick, make sure all the columns have the right type.
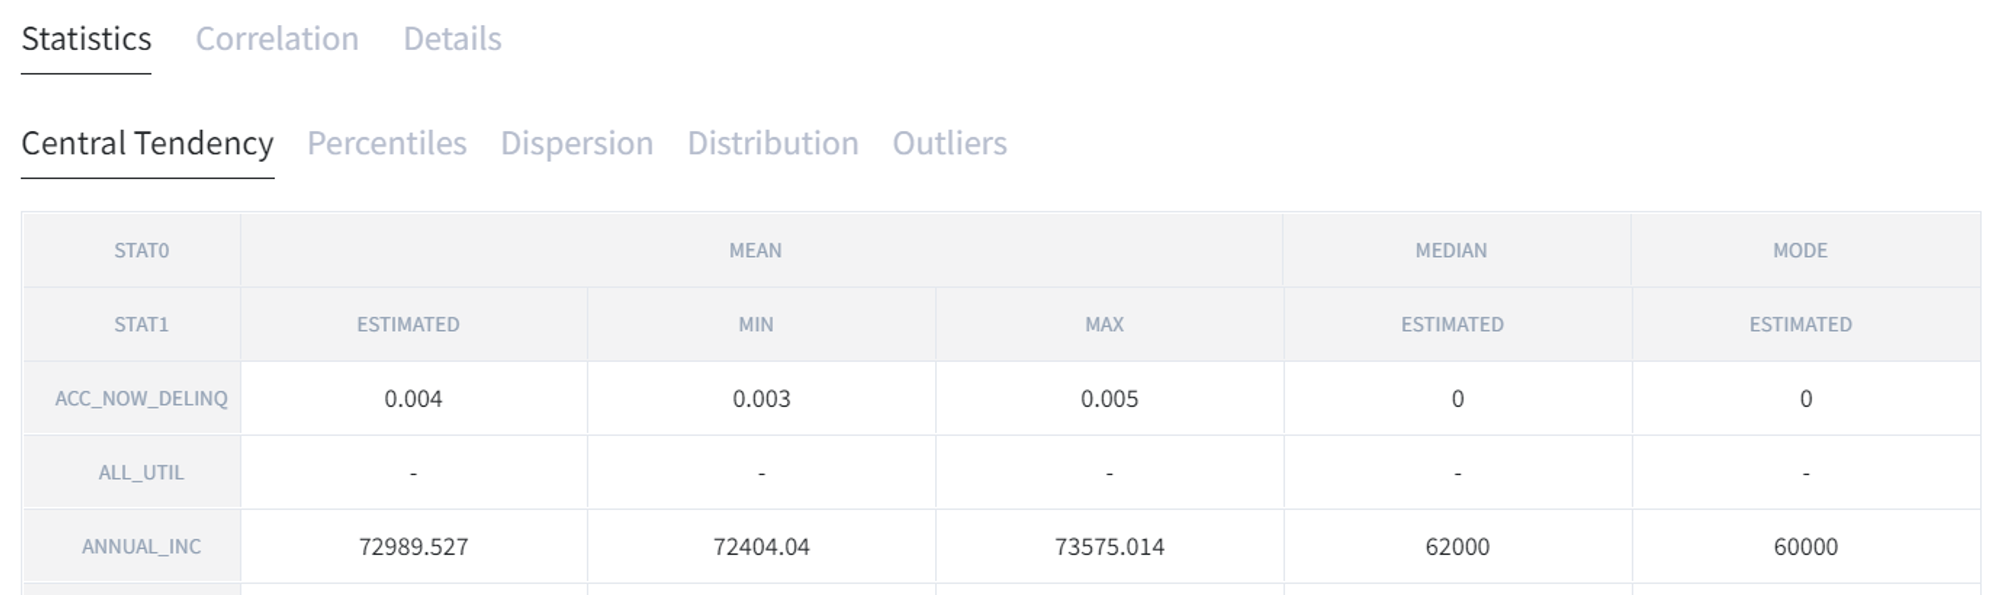
In Statistics tab you can see “Central Tendency” with calculated mean, median and mode for each column. The large difference between mean and median may say that there are outliers.
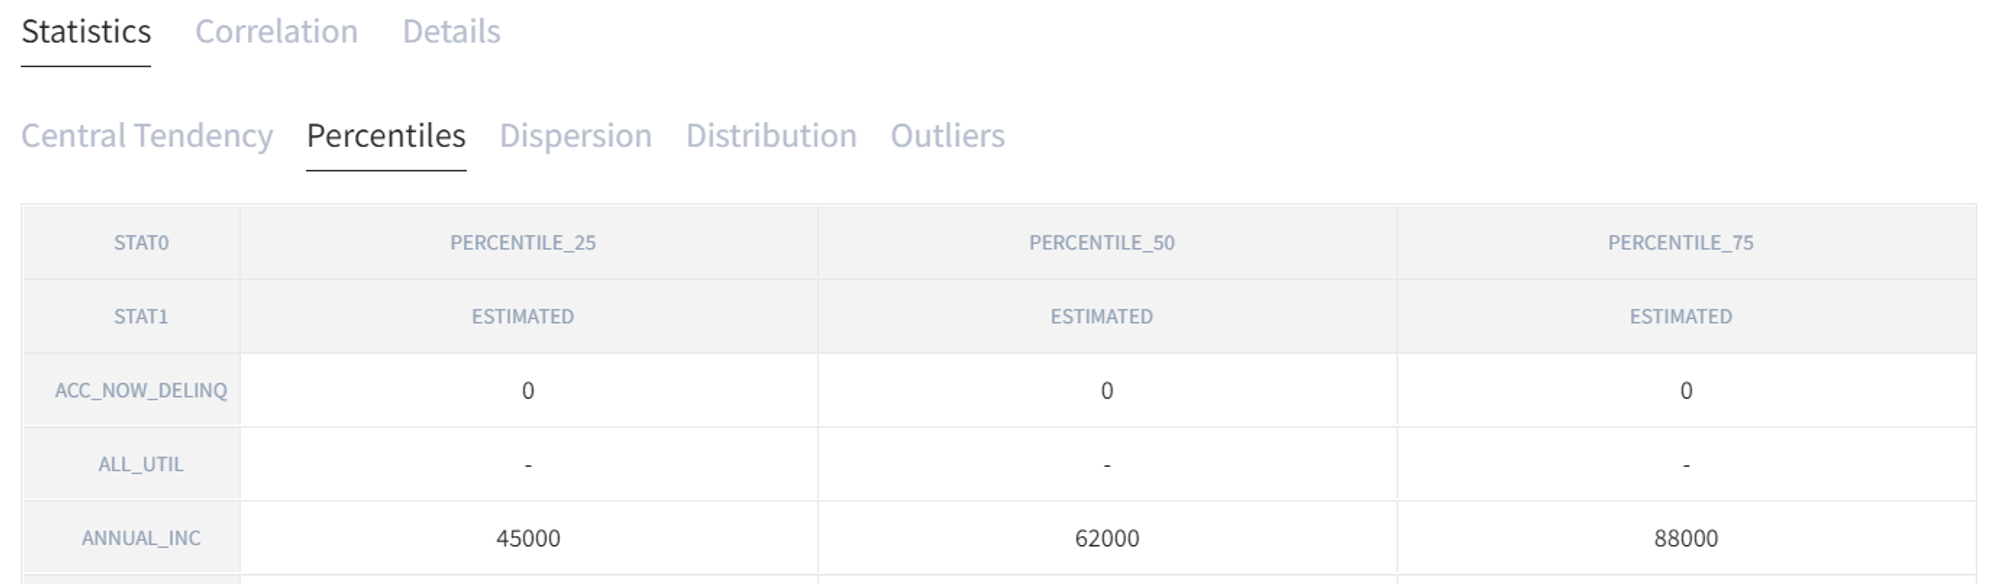
“Percentiles” displays estimated percentiles that have been chosen on the first step.
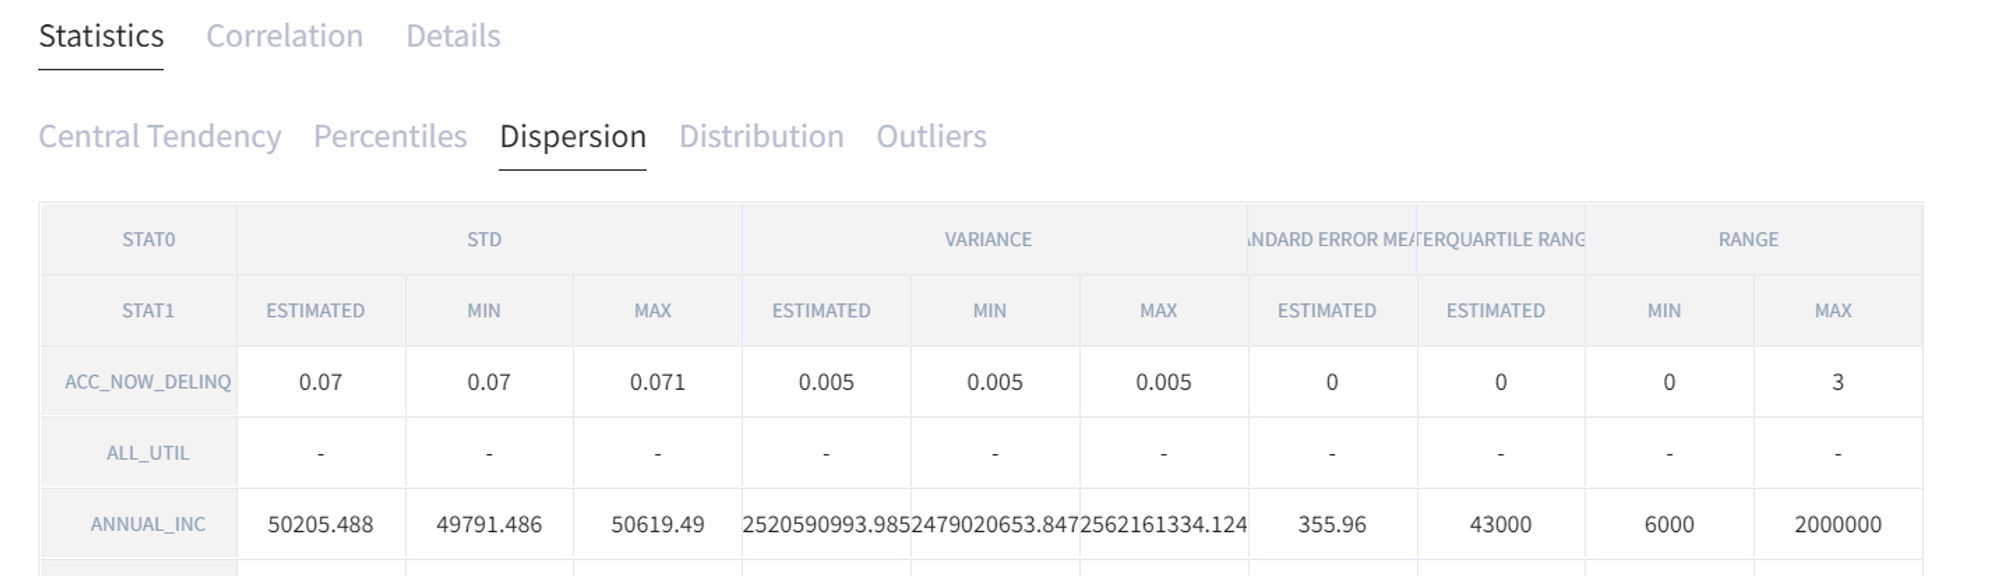
“Dispersion” includes standard deviation (STD), variance, standard error mean, interquartile range (IQR), range.
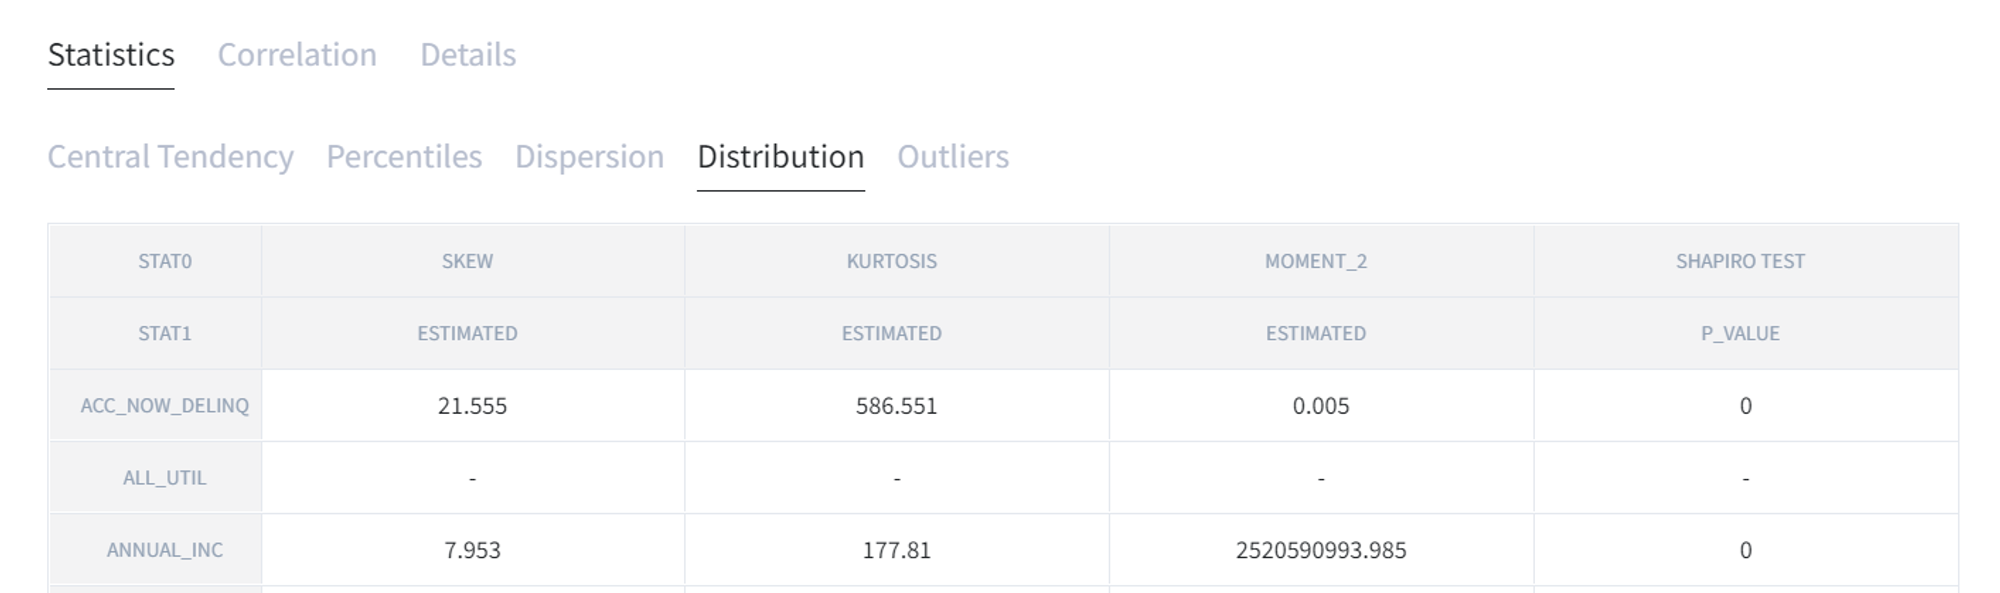
In “Distribution” tab there are skew, kurtosis, moment (that also was chosen in the beginning) and Shapiro test.
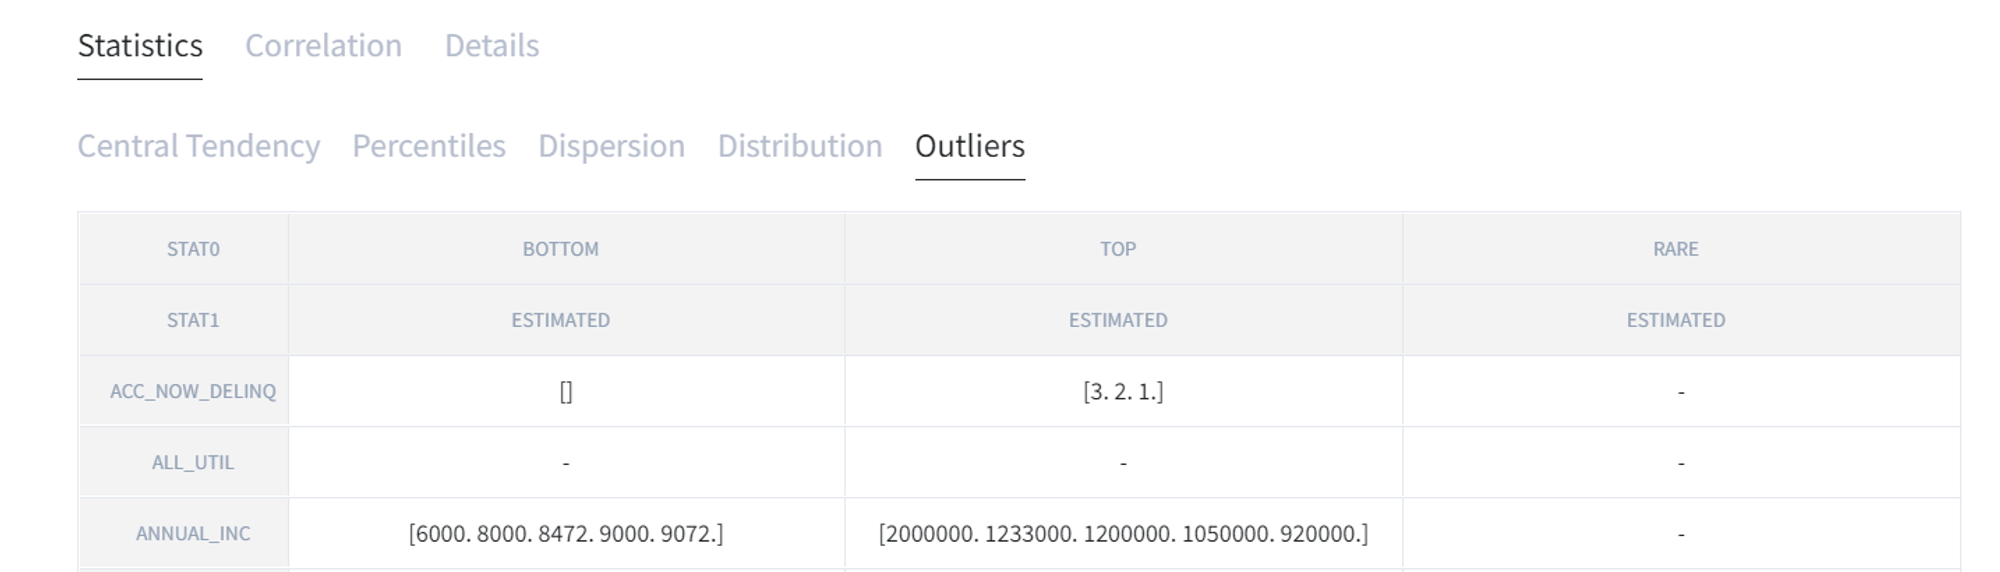
The last one is “Outliers” which displays data outside of the quartiles.
The same information is available in Details for each particular column.