General information
Brick applies a function to the selected column using exponential weighted and cumulative functions. Generally described as
Description
Brick Locations
Bricks → Calculations → Iterative Calculations
Brick Parameters
- Column
List of possible columns for selection. This field is obligatory for any setting selected. The parameter accepts only columns with integer/float data types.
- Function
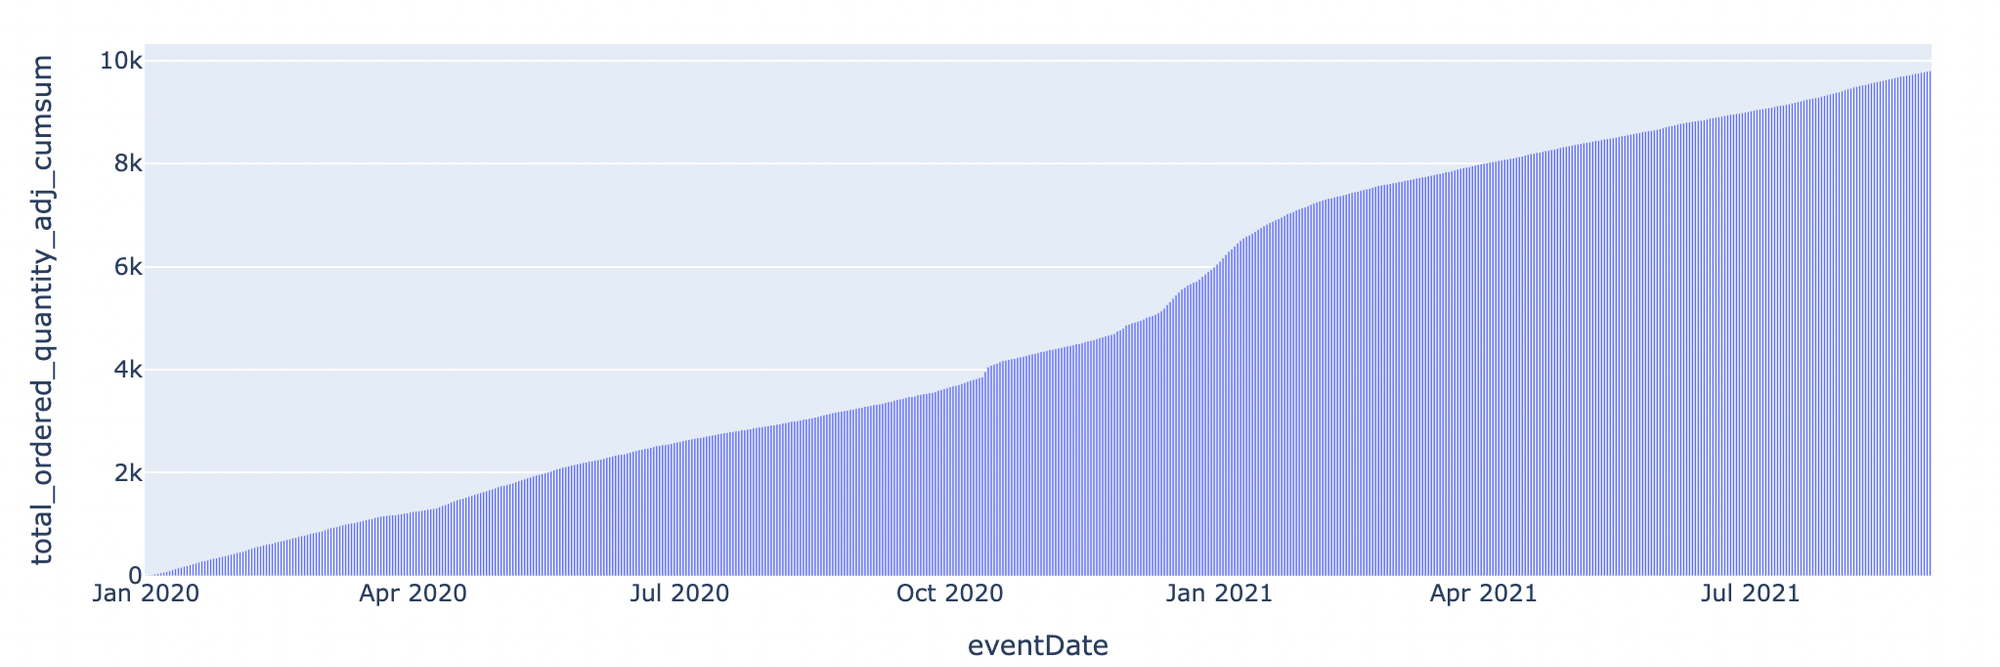
- Cumulative sum
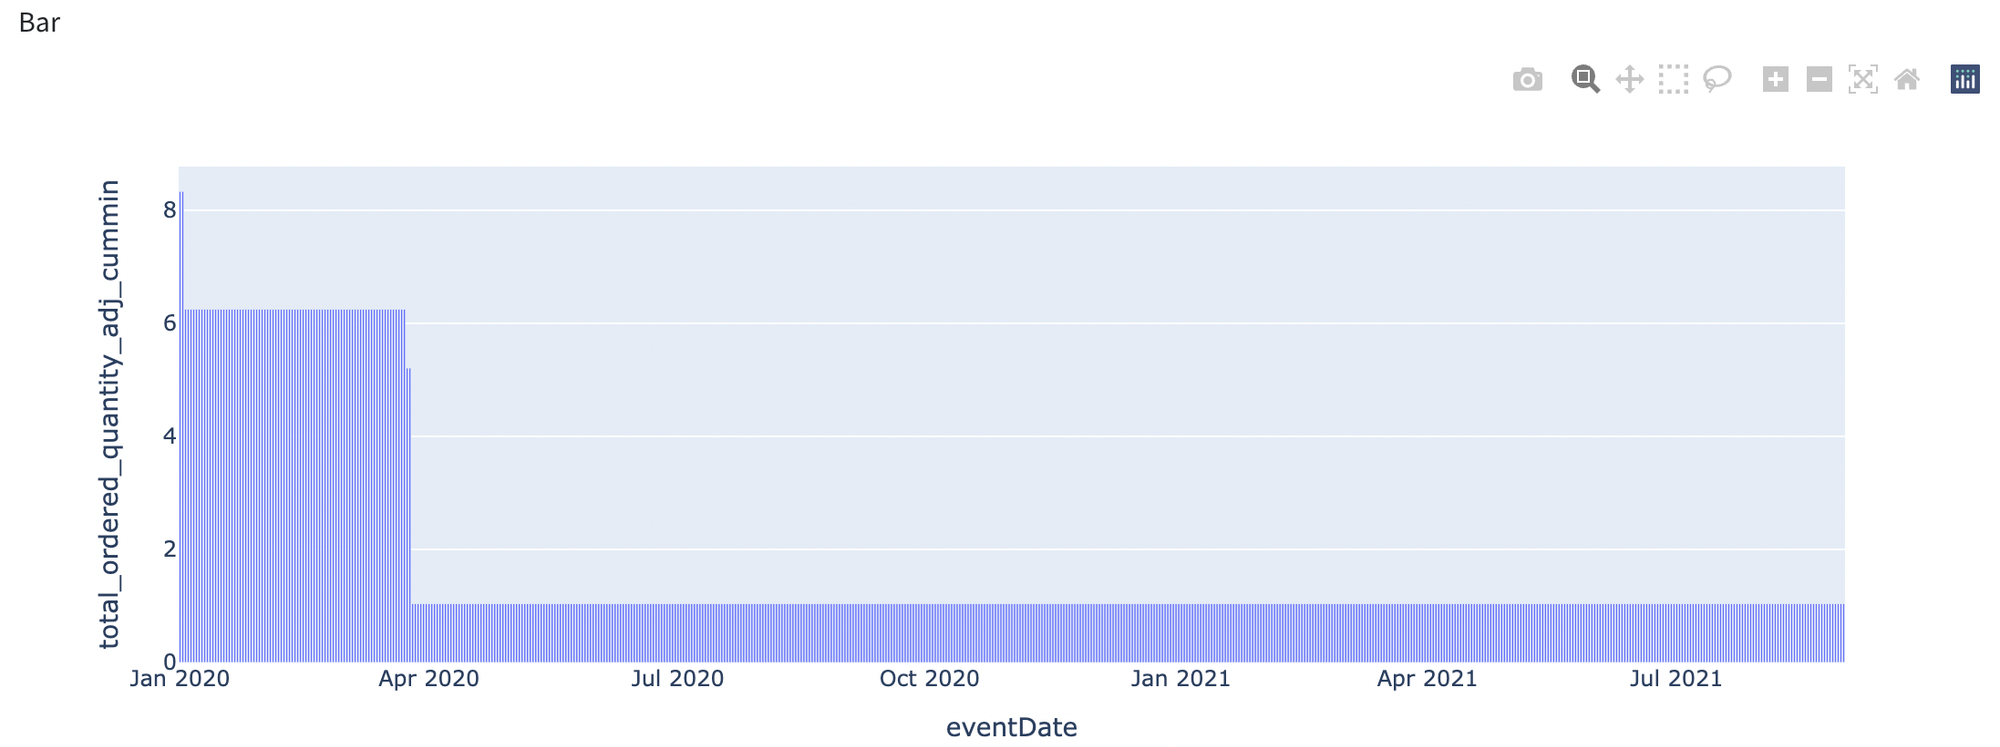
- Cumulative min
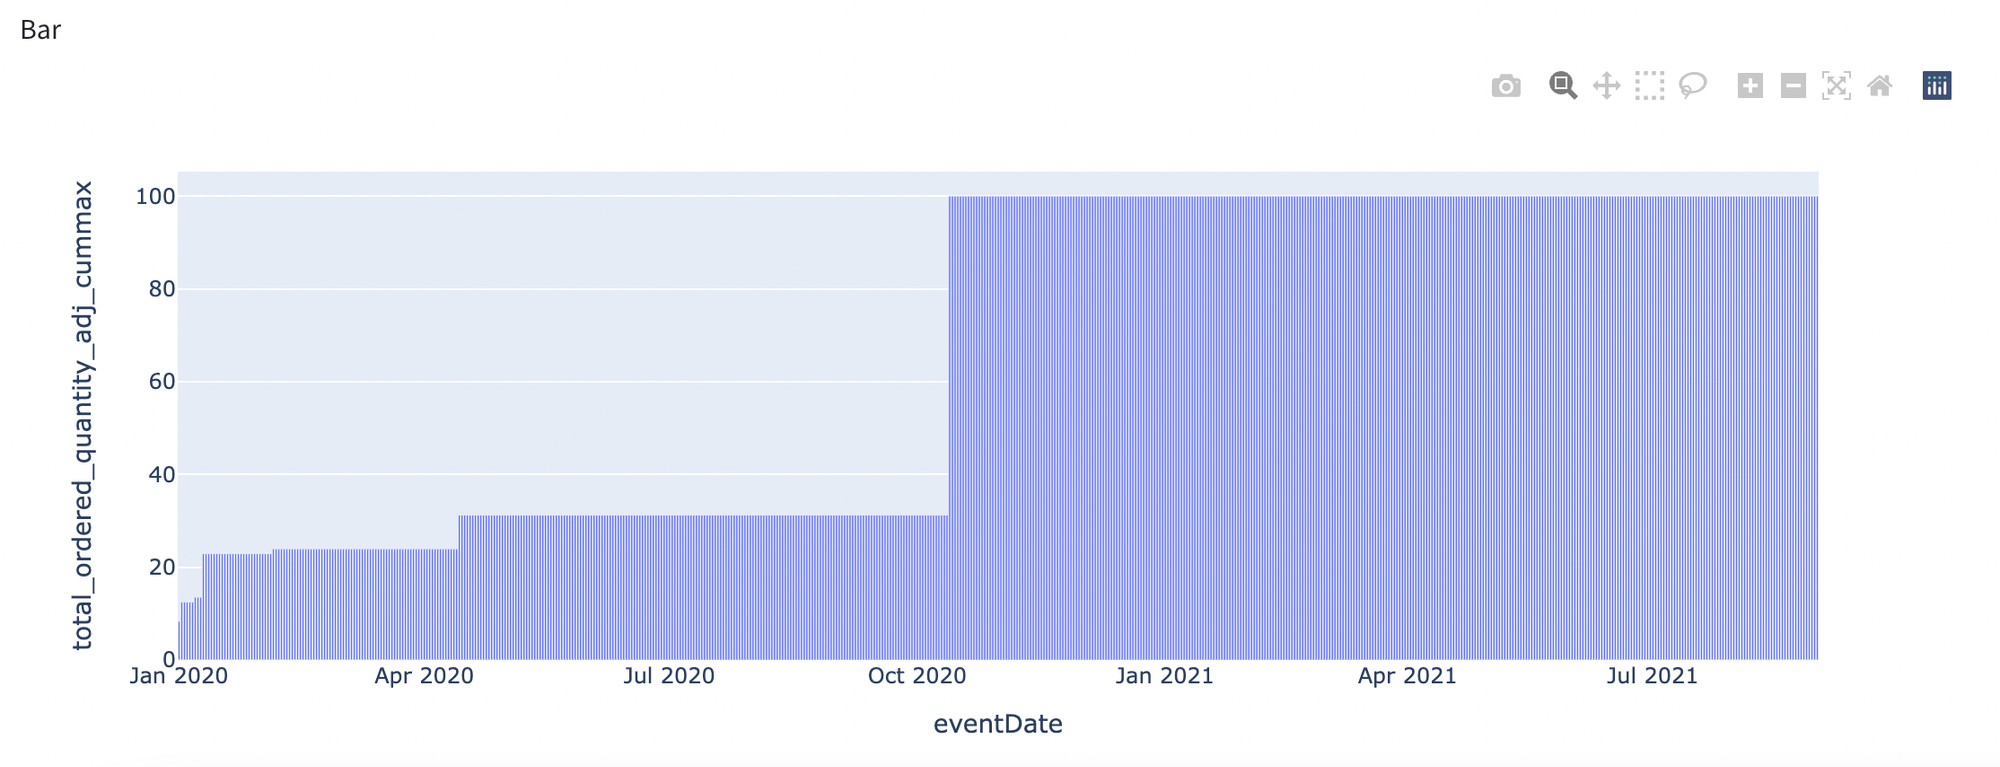
- Cumulative max
- Cumulative product
- Exponentially weighted average
- Exponentially weighted standard deviation
- Exponentially weighted variance
List of possible functions to apply. This field is obligatory for any setting selected.
This function uses the sum function for values in a specified column with accumulation

- is an index of column selected for cumulative sum;
- is a number of elements for i-th column
This function uses the min function for values in a specified column with accumulation
This function uses the max function for values in a specified column with accumulation
This function uses the product function for values in a specified column with accumulation.
Perform exponentially weighted (EW) calculations with a mean aggregation function
Perform exponentially weighted (EW) calculations with a standard deviation aggregation function
Perform exponentially weighted (EW) calculations with a variance aggregation function
Rule how we calculate exponentially weighted (EW) calculations:

- Span
The integer parameter shows only while one of the exponentially weighted functions is chosen. It is interpreted as the number of days for which the n-day moving average is calculated.
Brick Inputs/Outputs
- Inputs
Brick takes the dataset.
- Outputs
Brick produces a dataset with new columns created, with the short name of the operation performed. For example, if you have an “age” column and want to calculate exponential weighted moving variance, the new column “age_var” will be created.
Example of usage
Let's use this brick on the custom dataset that contains information about orders count per day. The general information about the dataset is represented below:
- id - ID of customer
- eventDate (datetime) - date
- Total_ordered_quantity (float) - Total amount of orders per day
Let’s move to the brick usage, we will use all presented functions above on different numerical columns:
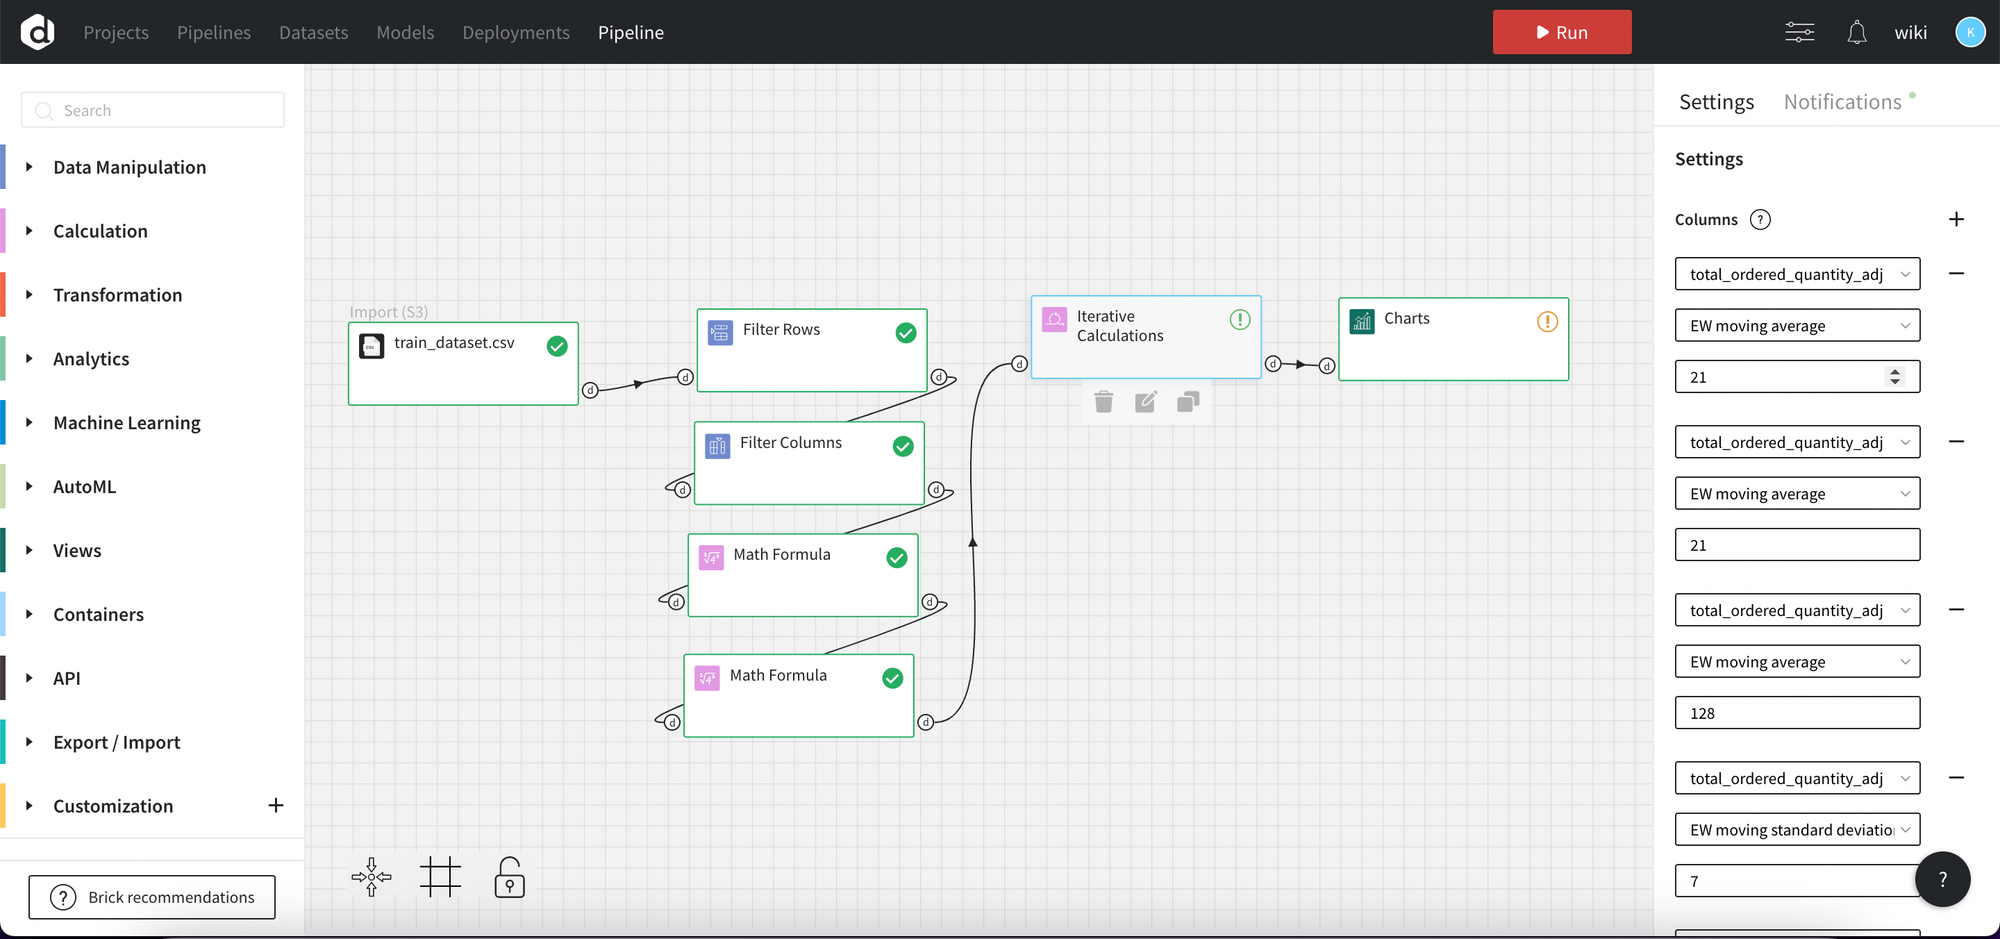
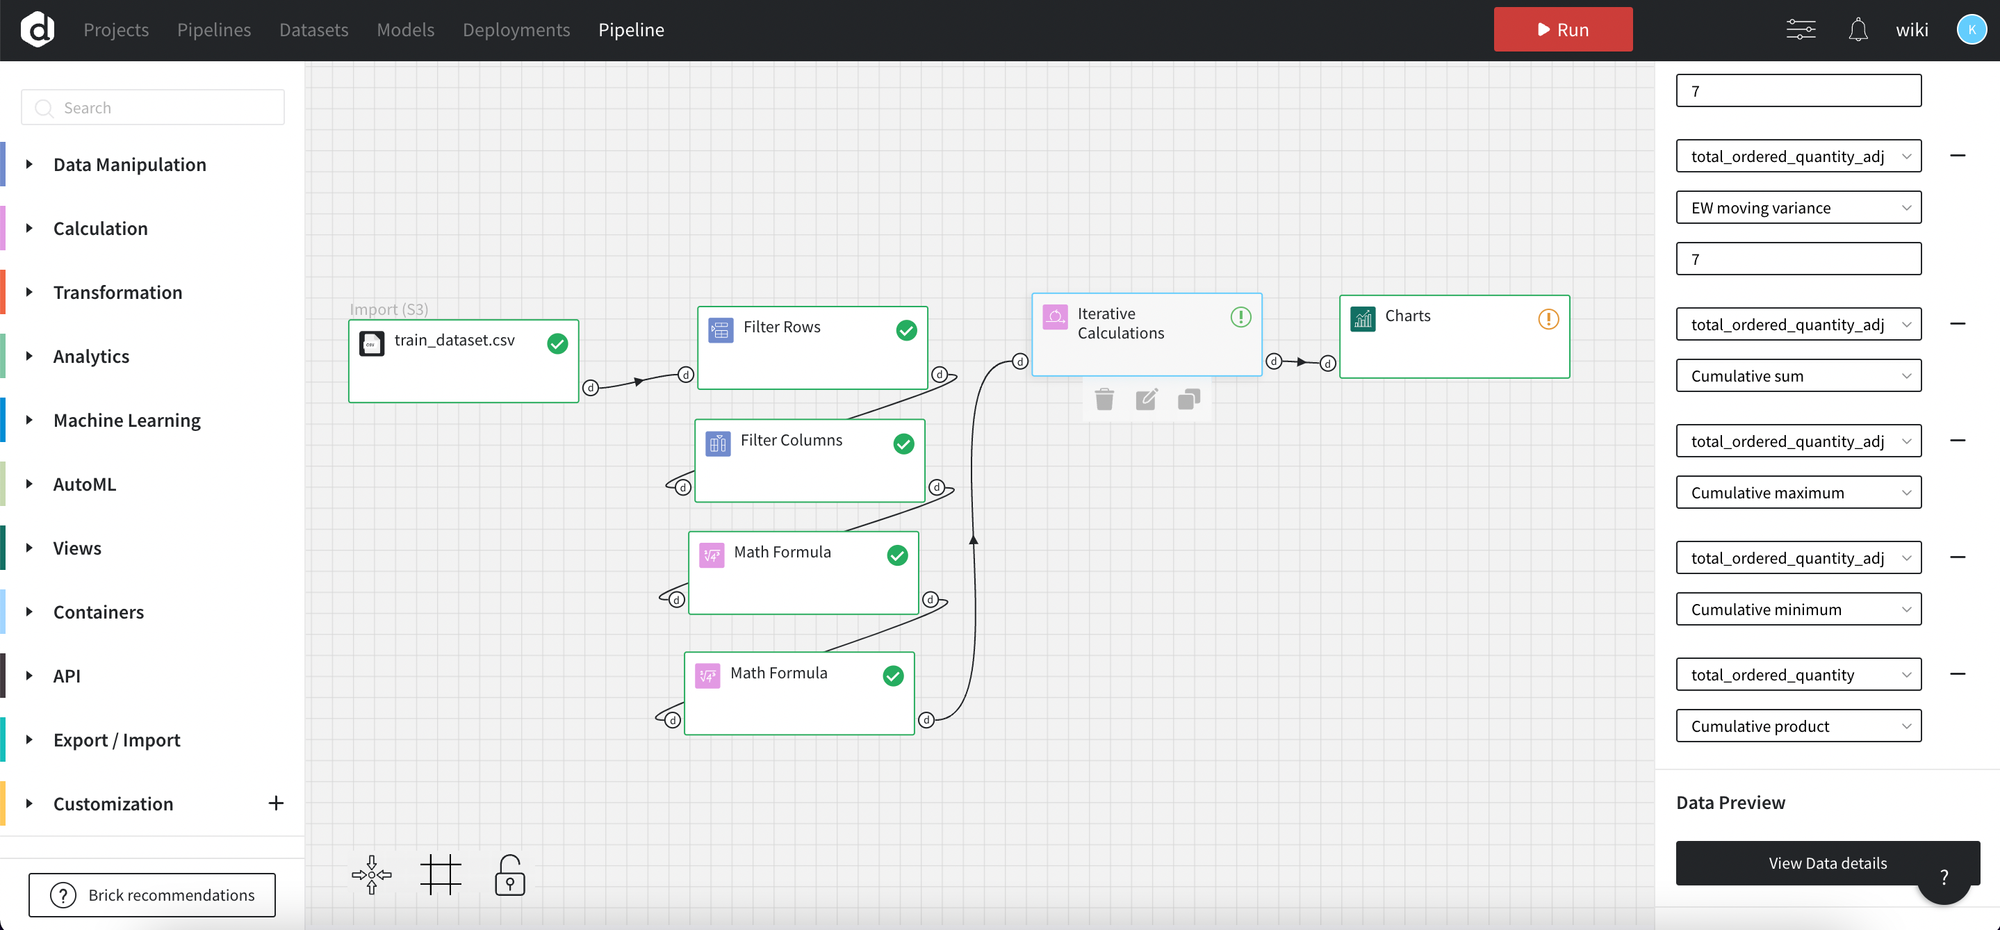
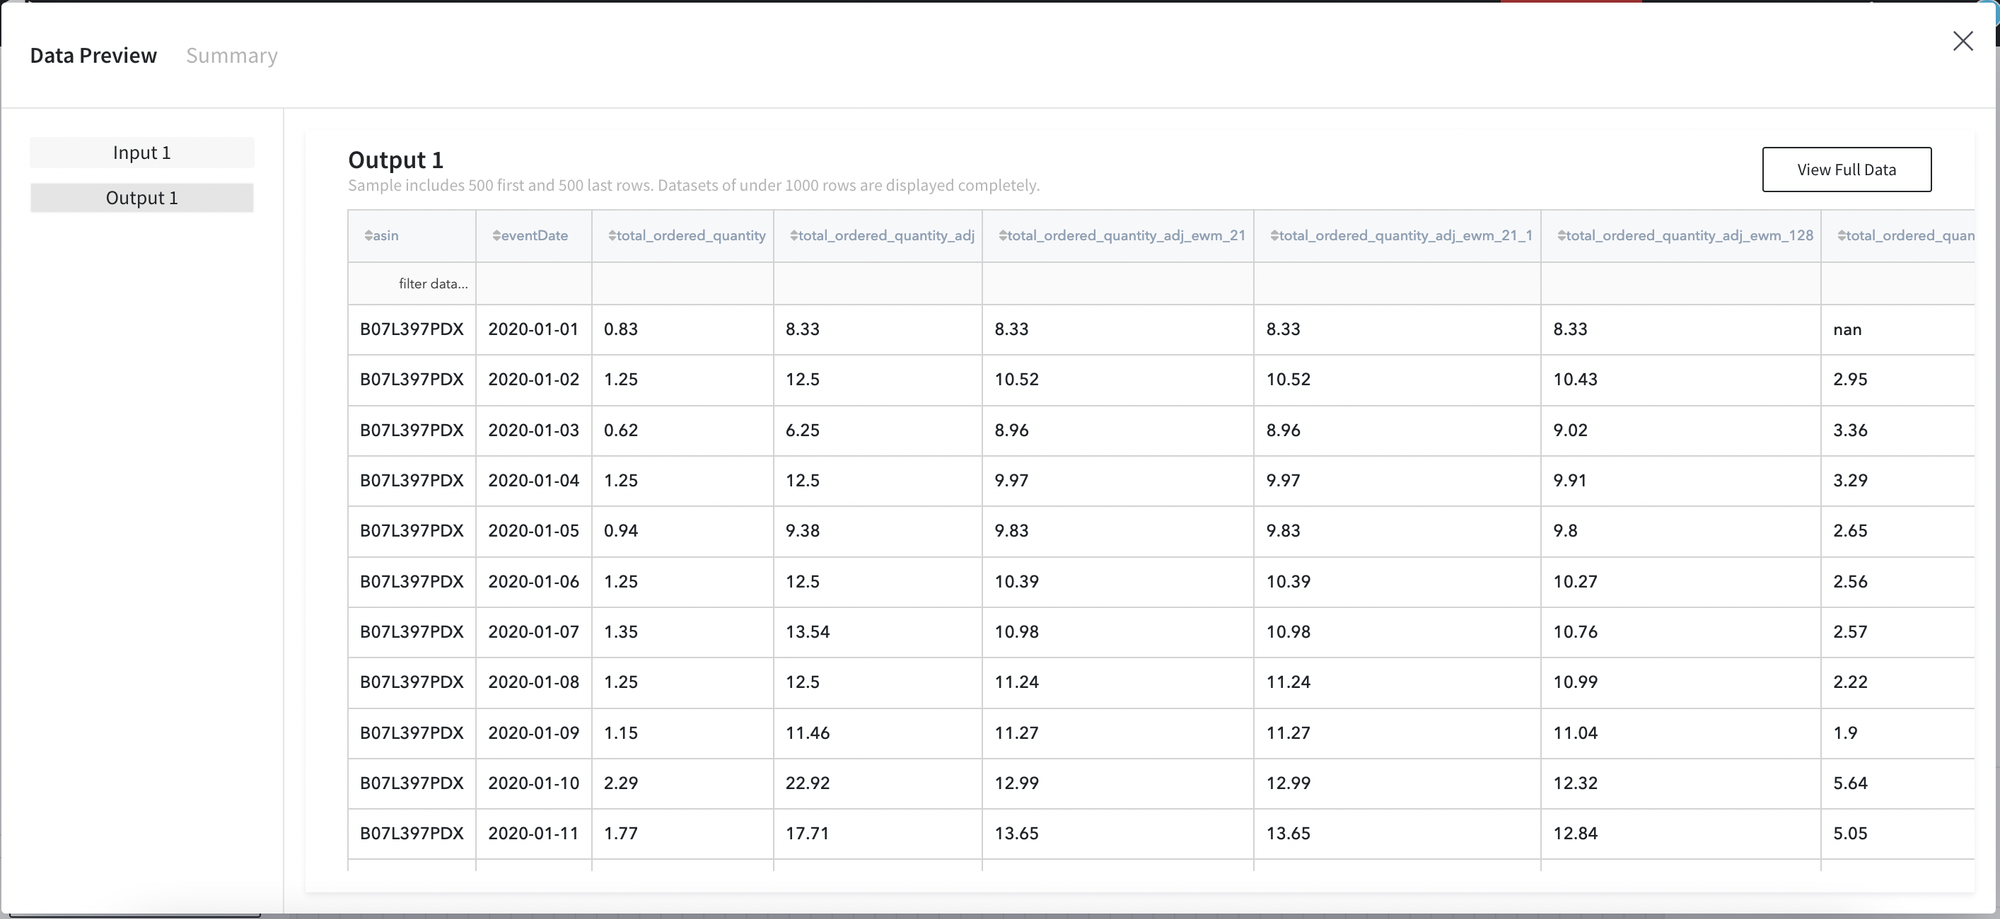
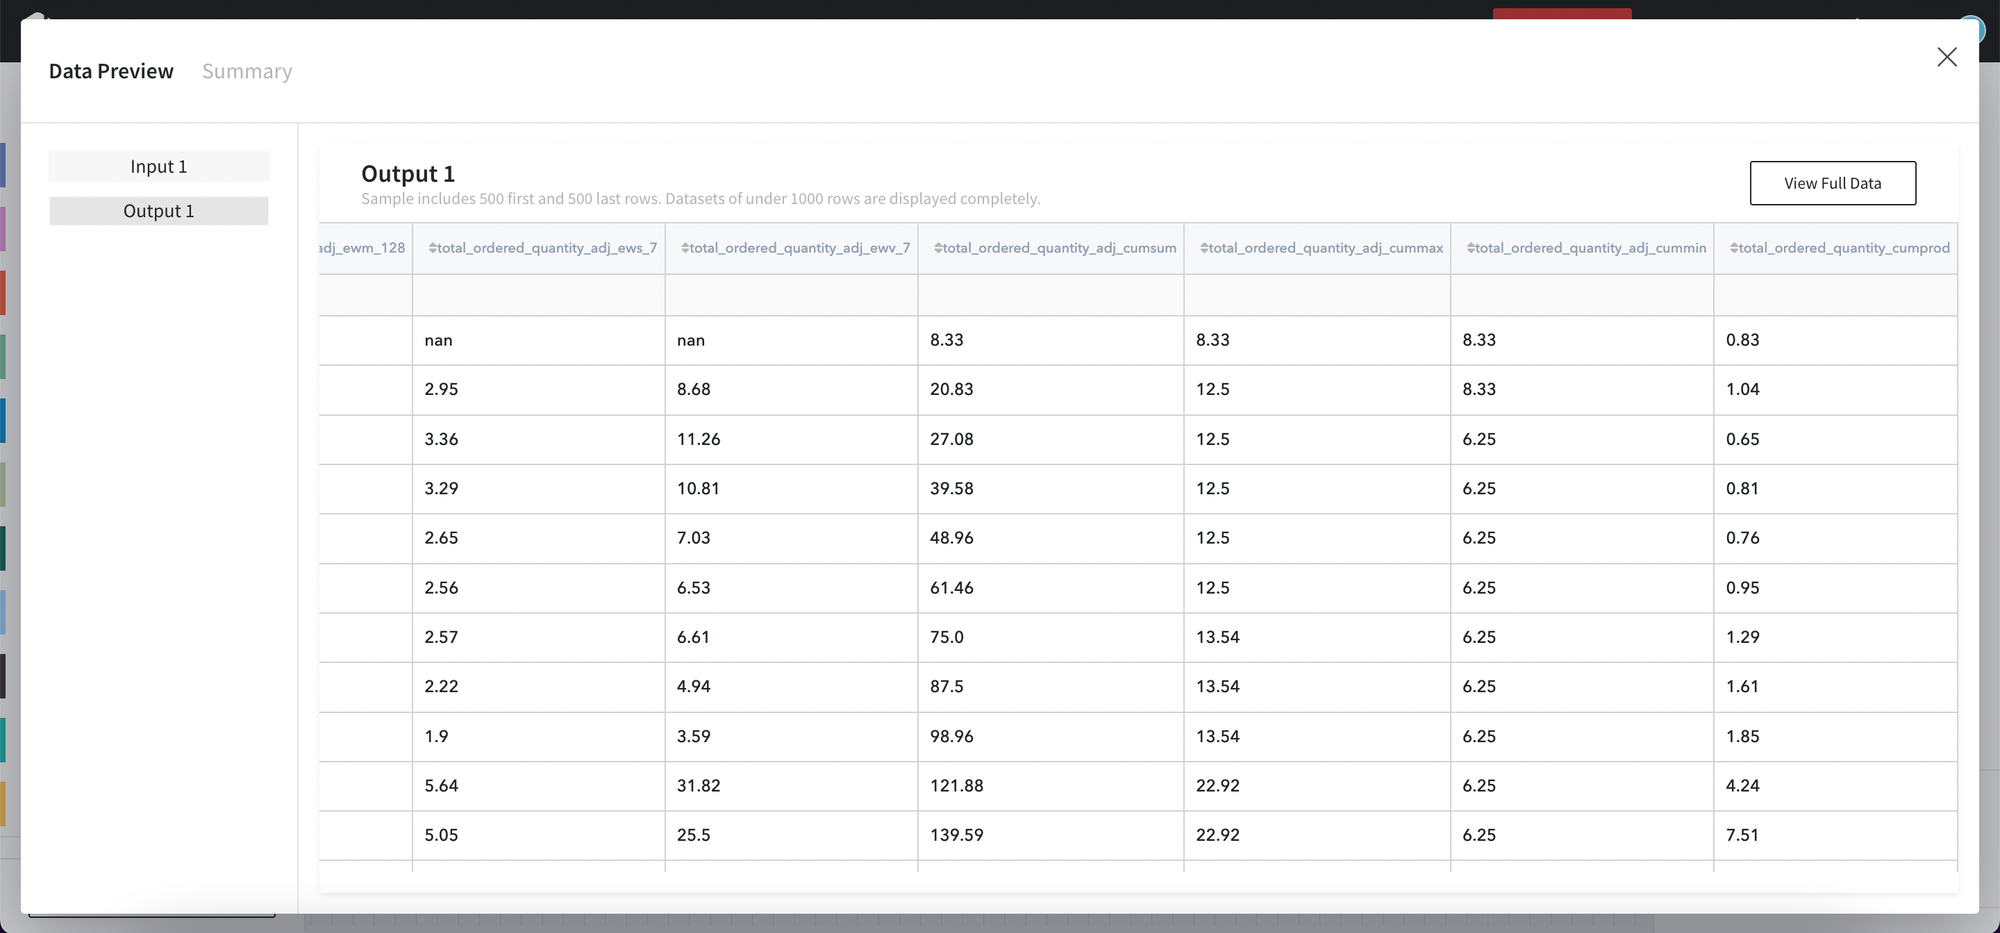
The resulted dataset with new columns total_ordered_quantity_adj_ewm_21, total_ordered_quantity_adj_ewm_21_1, total_ordered_quantity_adj_ewm_128, total_ordered_quantity_adj_ews_7, total_ordered_quantity_adj_ewv_7, total_ordered_quantity_adj_cumsum, total_ordered_quantity_adj_cummin, total_ordered_quantity_adj_cummax, total_ordered_quantity_adj_cumprod is shown below:
Then we want also demonstarte some charts to give more wide understanding of performed calculations
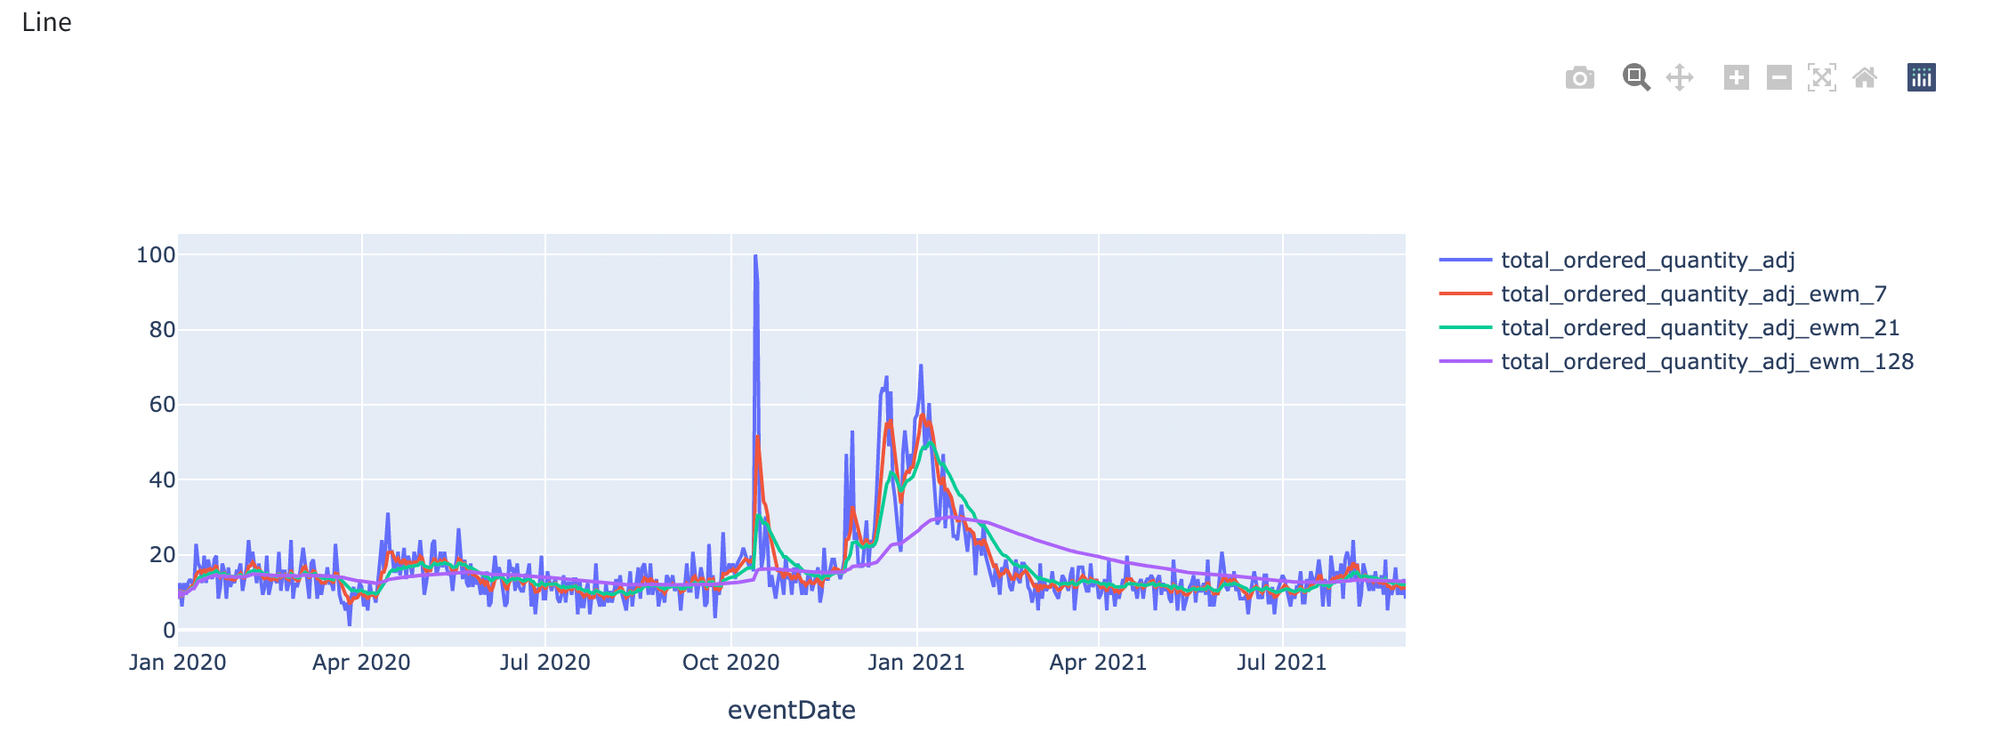
As we can see the more value for span parameter is specified the more smoothing will be applied to the our data.
