General information
Brick performs approximation for a selected column with specified trend type returning approximated values.
Description
Brick Locations
Bricks → Analytics → Local Approximation
Brick Parameters
- Column
List of possible columns for selection. This field is obligatory for any setting selected. The parameter accepts only columns with integer/float data types.
- Trendlines
List of possible functions to make approximation, This field is obligatory for any setting selected. User can choose one of presented:
- Linear
- Exponential
- Logarithmic
- Polynomial
- Power
Default value is “linear”.
- Power
Integer. The argument appears only when the Polynomial option is chosen for the Trendlines parameter, it means a degree of a polynomial function, in other words, the highest power of the variable that occurs in a polynomial.
- Window size
Integer. Argument defines the step size for sliding windows and then approximates with chosen trendlines. Default value is 5.
Brick Inputs/Outputs
- Inputs
Brick takes the dataset.
- Outputs
Brick produces a dataset with new column created, that is approximated by chosen trendline. For example, we want to use Local Approximation brick for column “age” with “linear” trendline after brick execution we will get output dataset with new column: “age_approximated”.
Example of usage
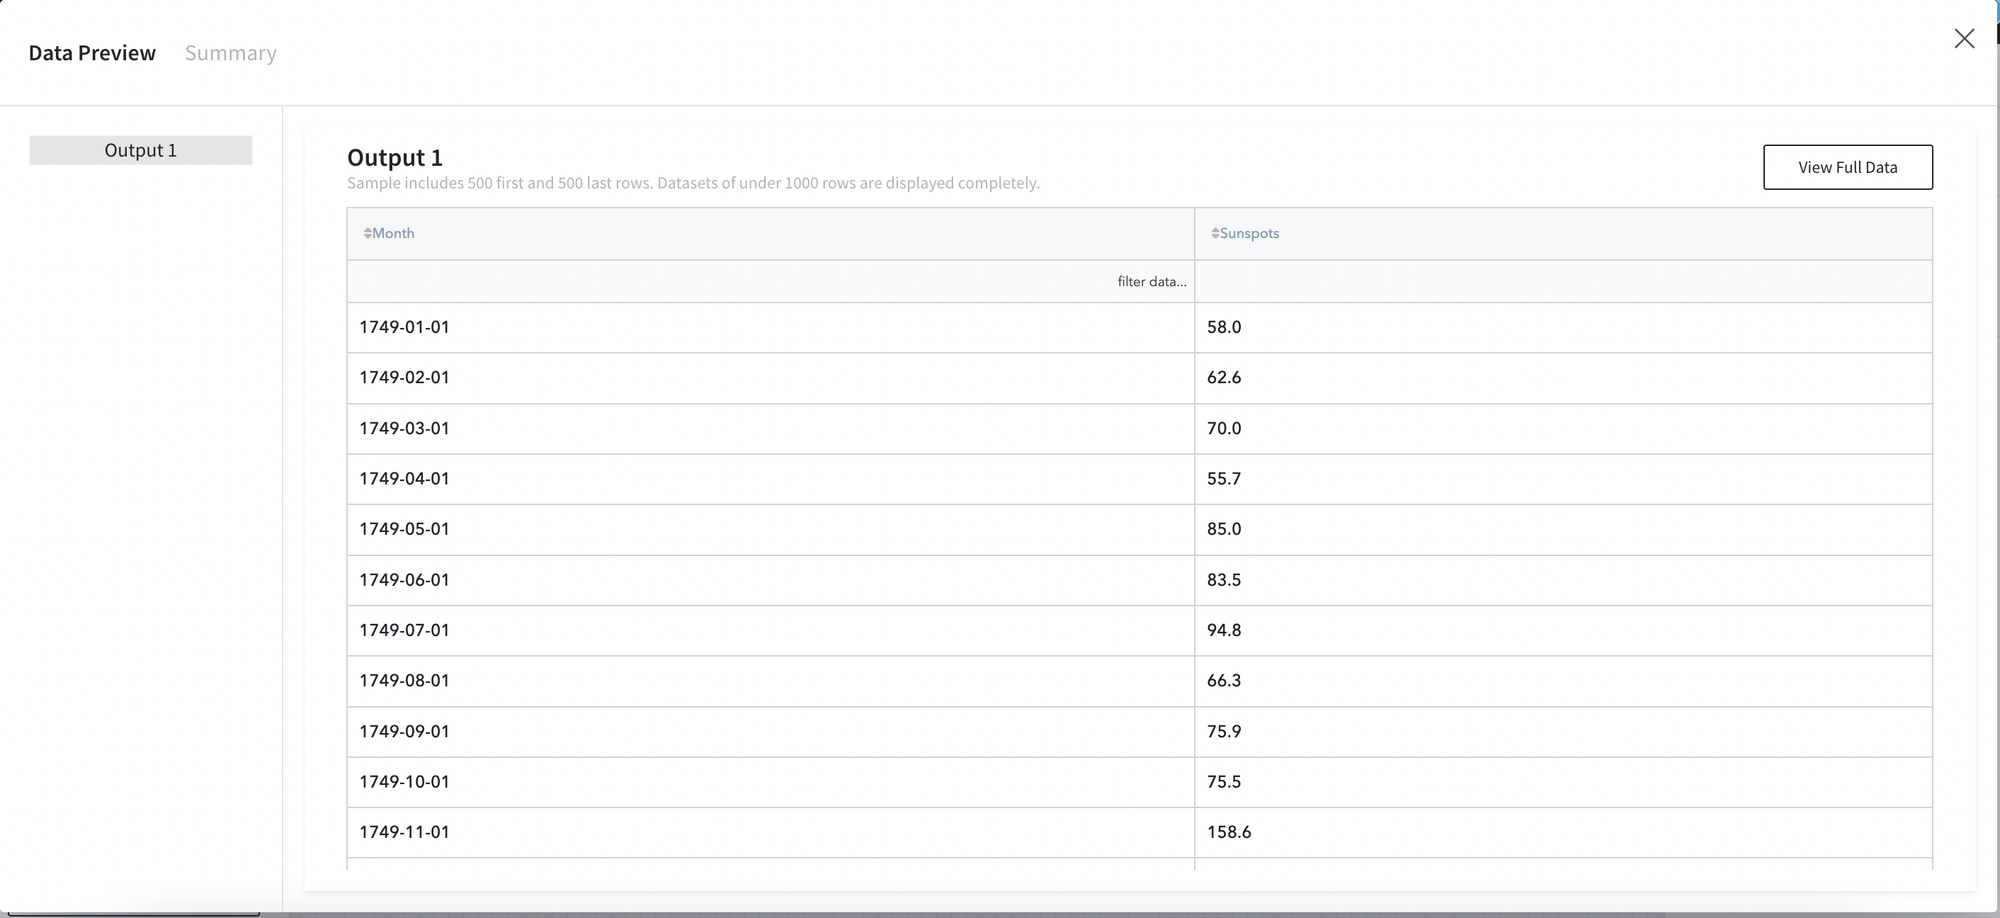
Lets use this brick on sunflowers dataset. The general information about the dataset is represented below:
- Month (datetime) - month of the observation
- Sunspots (float) - count of sunspots observed
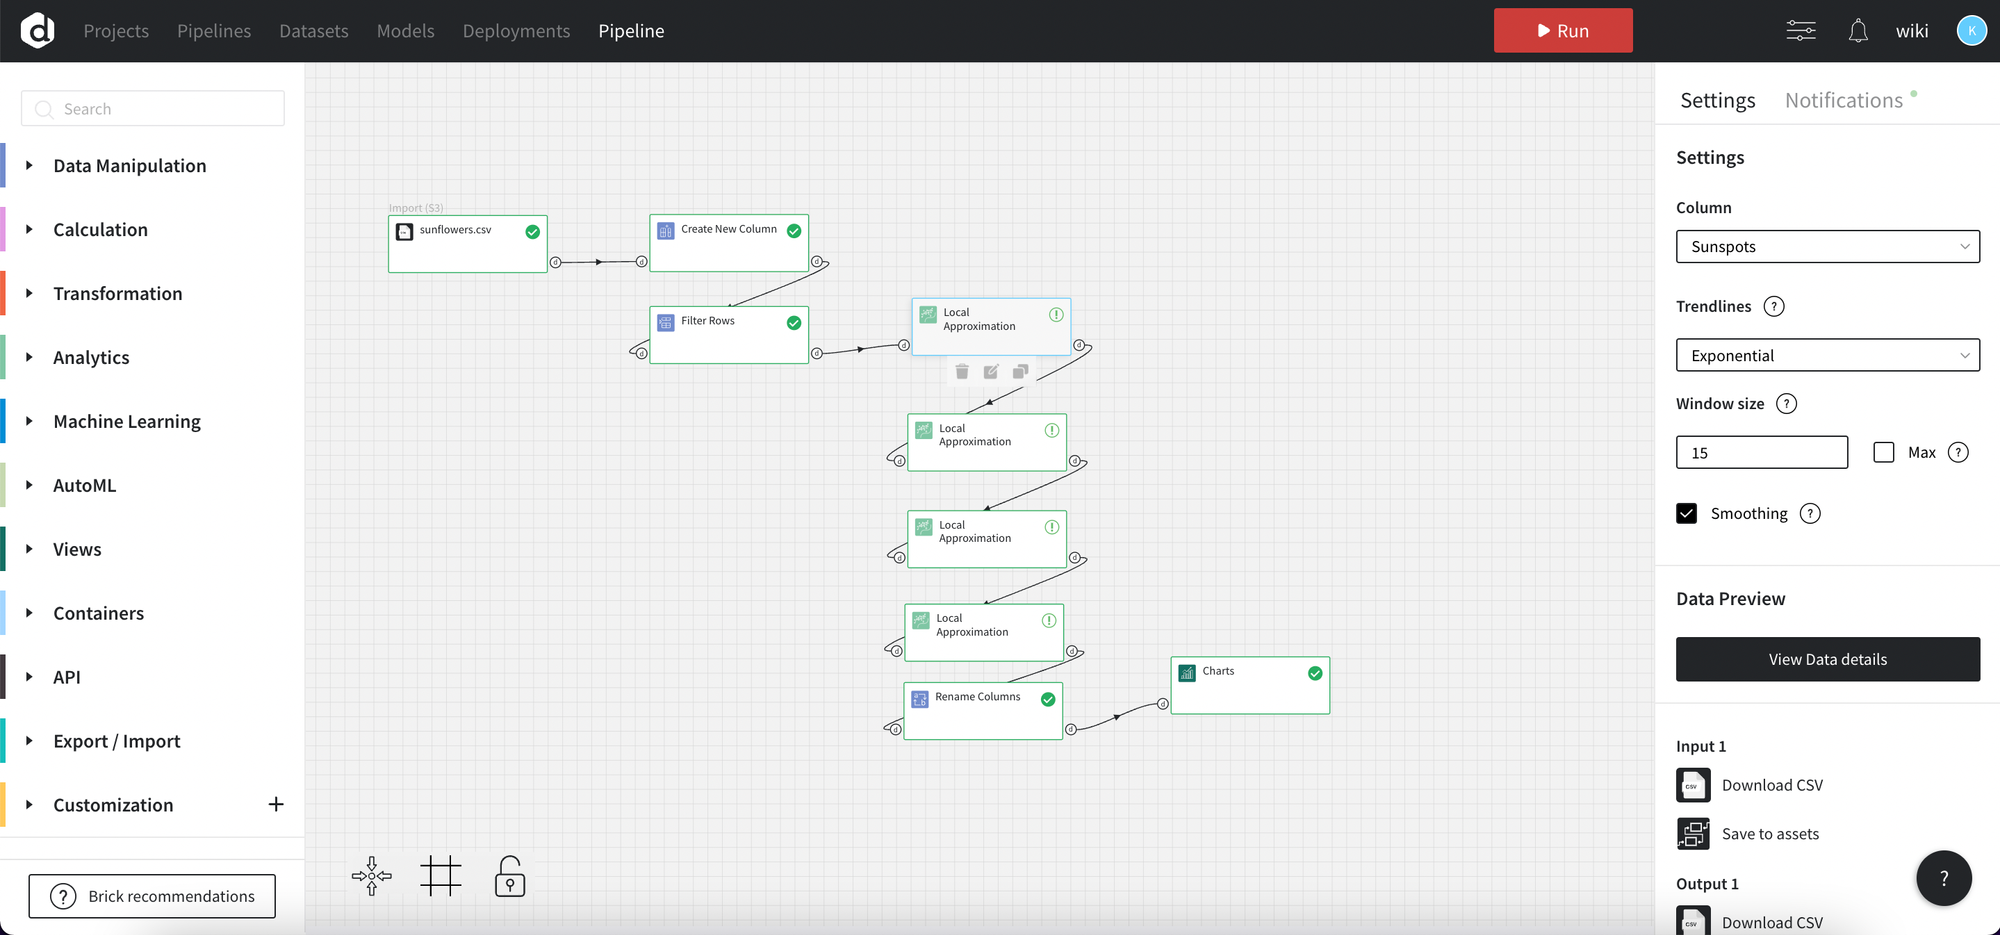
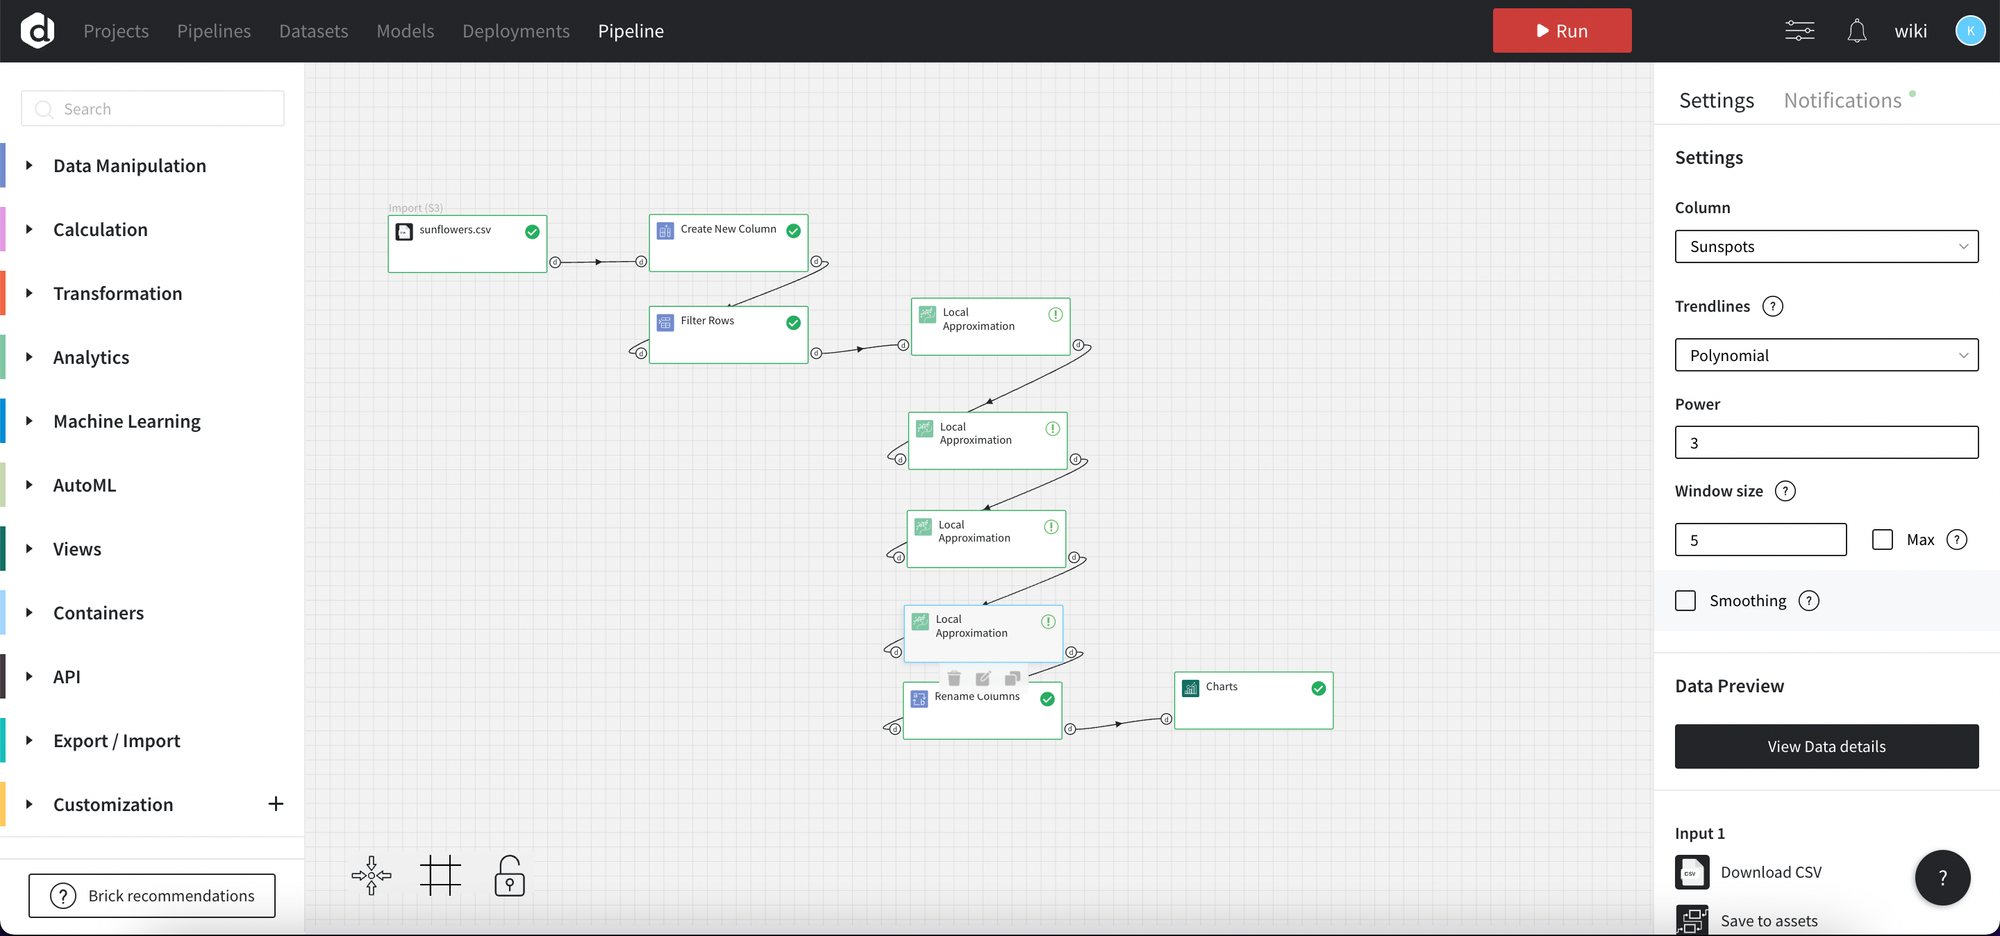
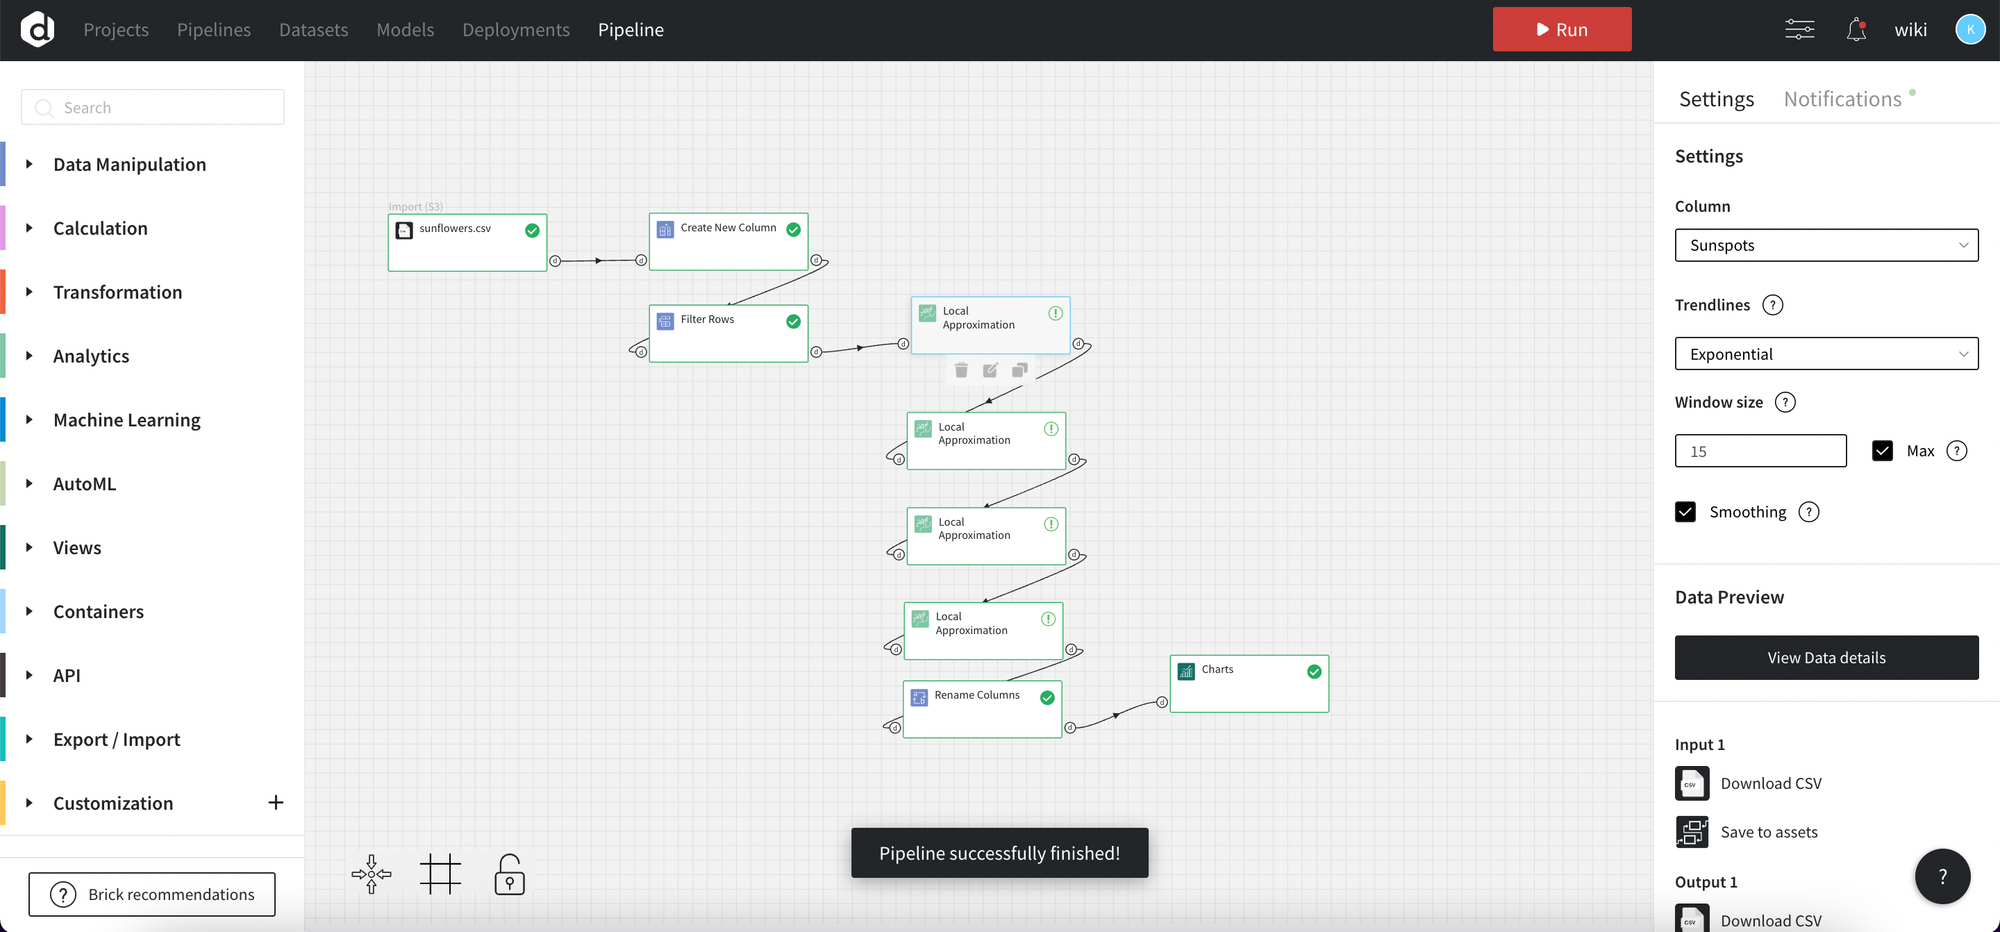
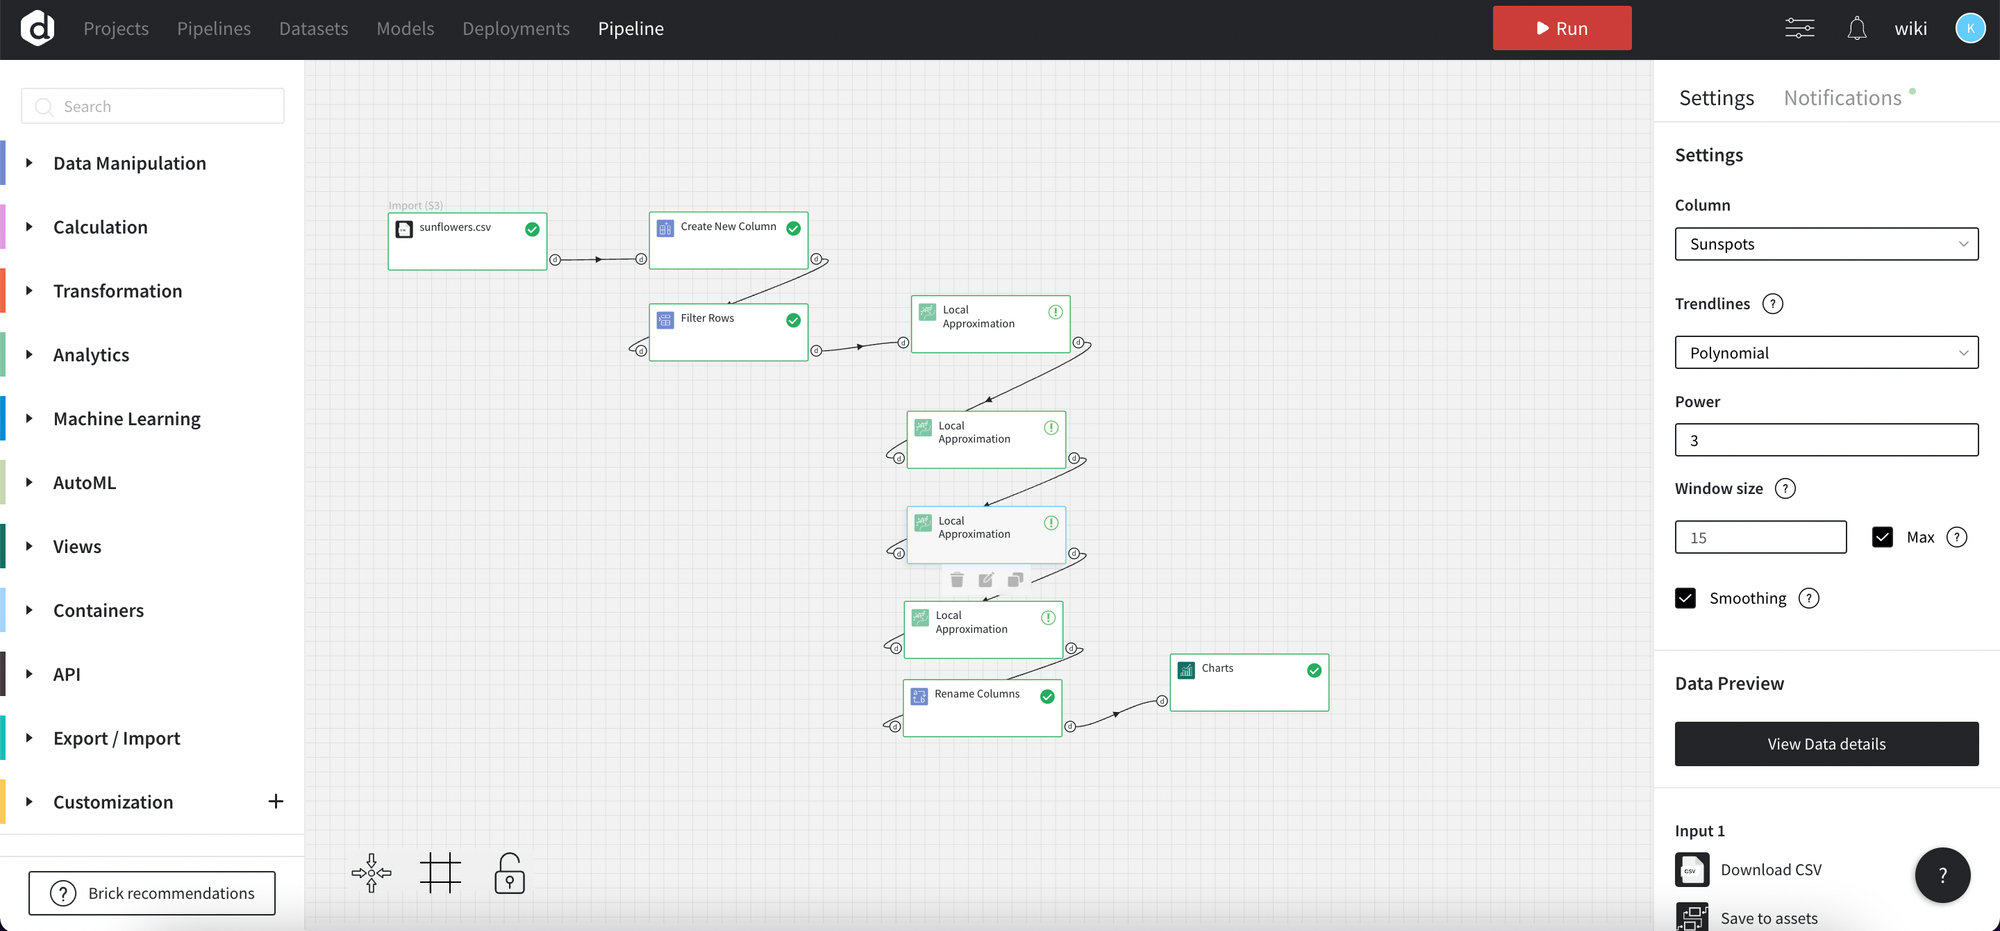
Let’s move to the brick usage, we will use Local Trend Analysis on the “Sunspots” column with “exponential” and “polynomial” trendline, with window size option equal to 15 and with and without smoothing to compare results and choose which one is better in that case.
Bricks configuration:
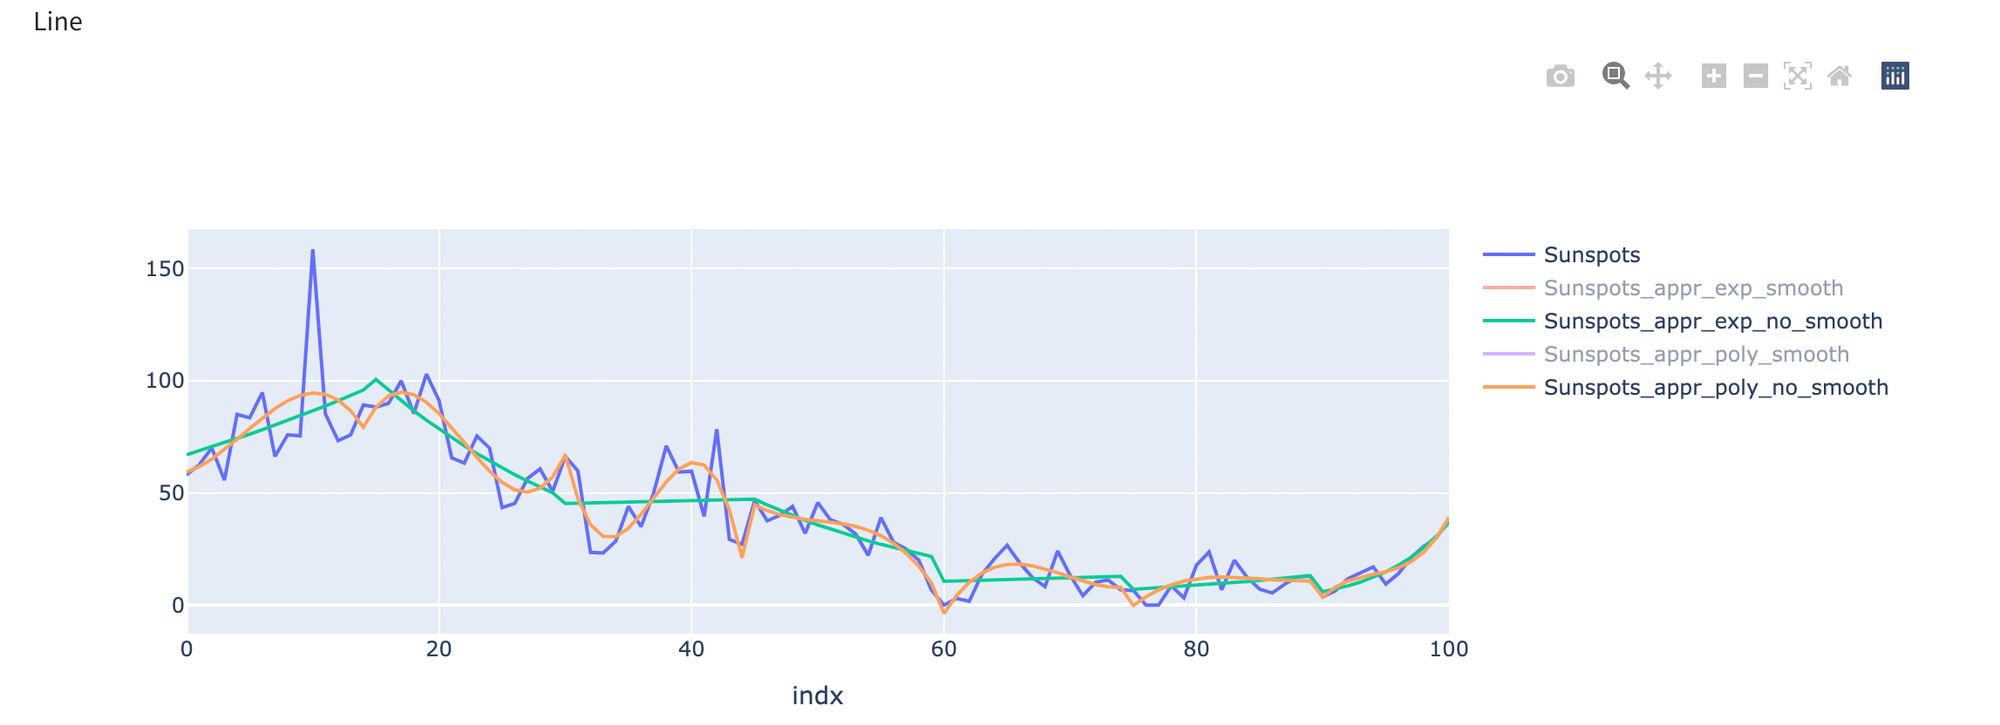
Results:
First, let's glance at approximation without smoothing for trendlines: exponential and polynomial. The blue line shows initial data, the green line approximation with exponent, and the yellow line approximation with a polynomial. The best option from those two is an approximation with polynomial as it makes the yellow line more familiar to the blue one than the green.
Now let’s look to results that we have using smoothing parameter:
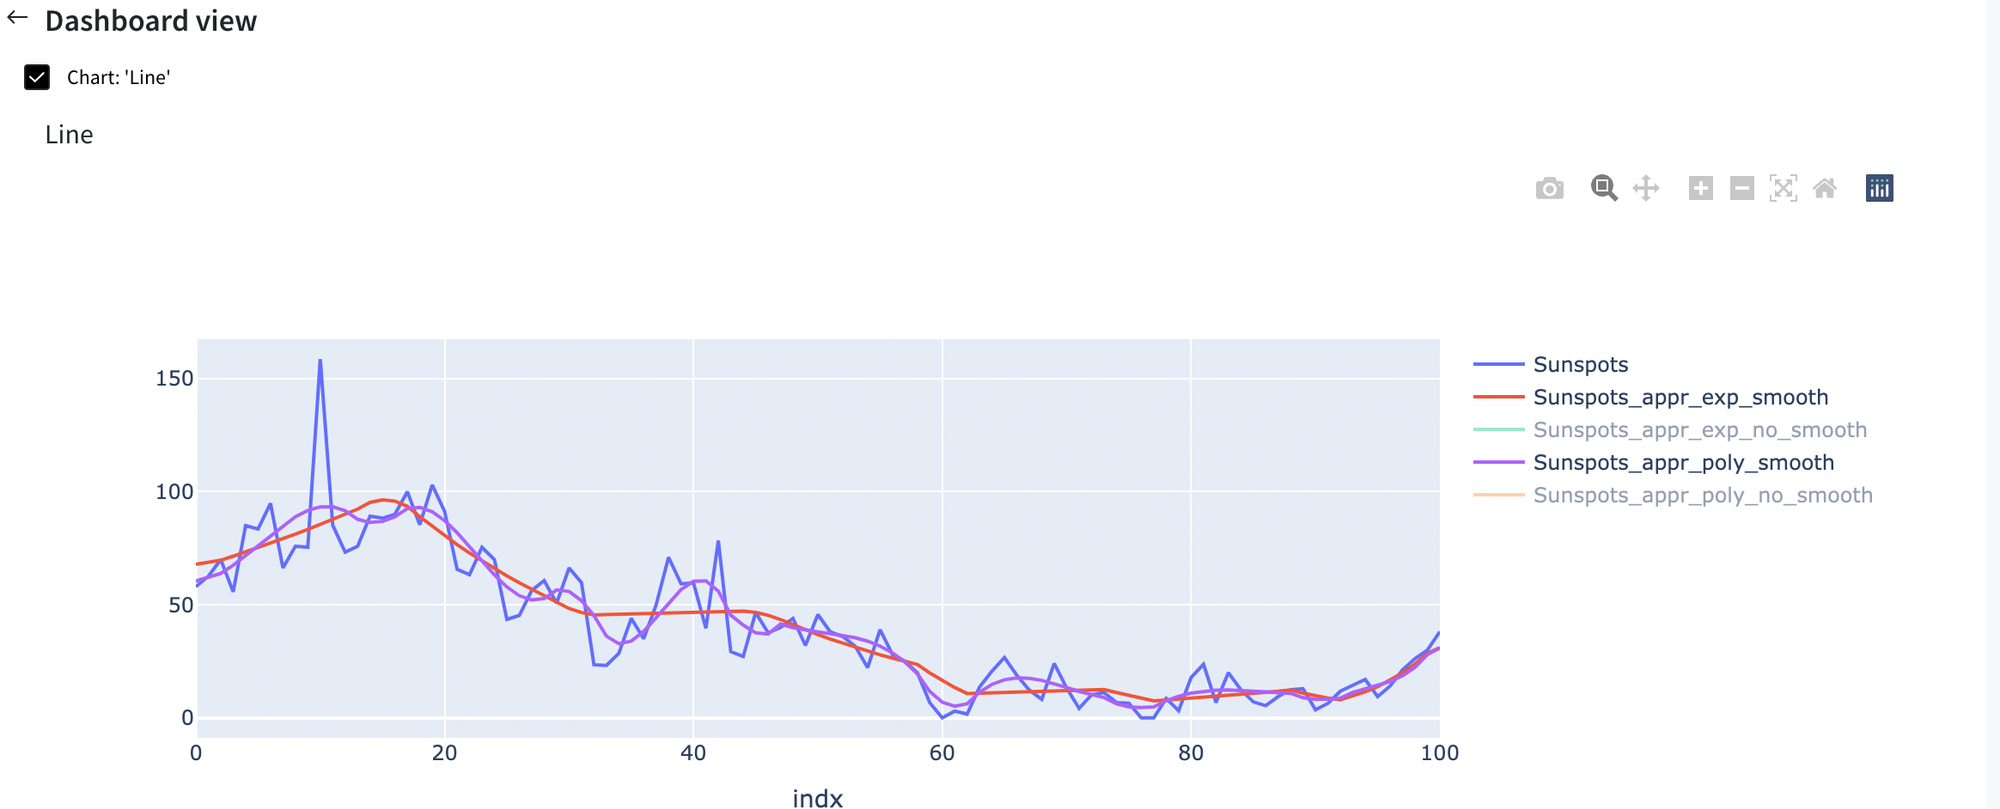
Here we have the same situation, where polynomial approximation performs better on sunflowers data.
Now let’s have a look at the same example with the same trendlines but changed window size to max option:
The results are:
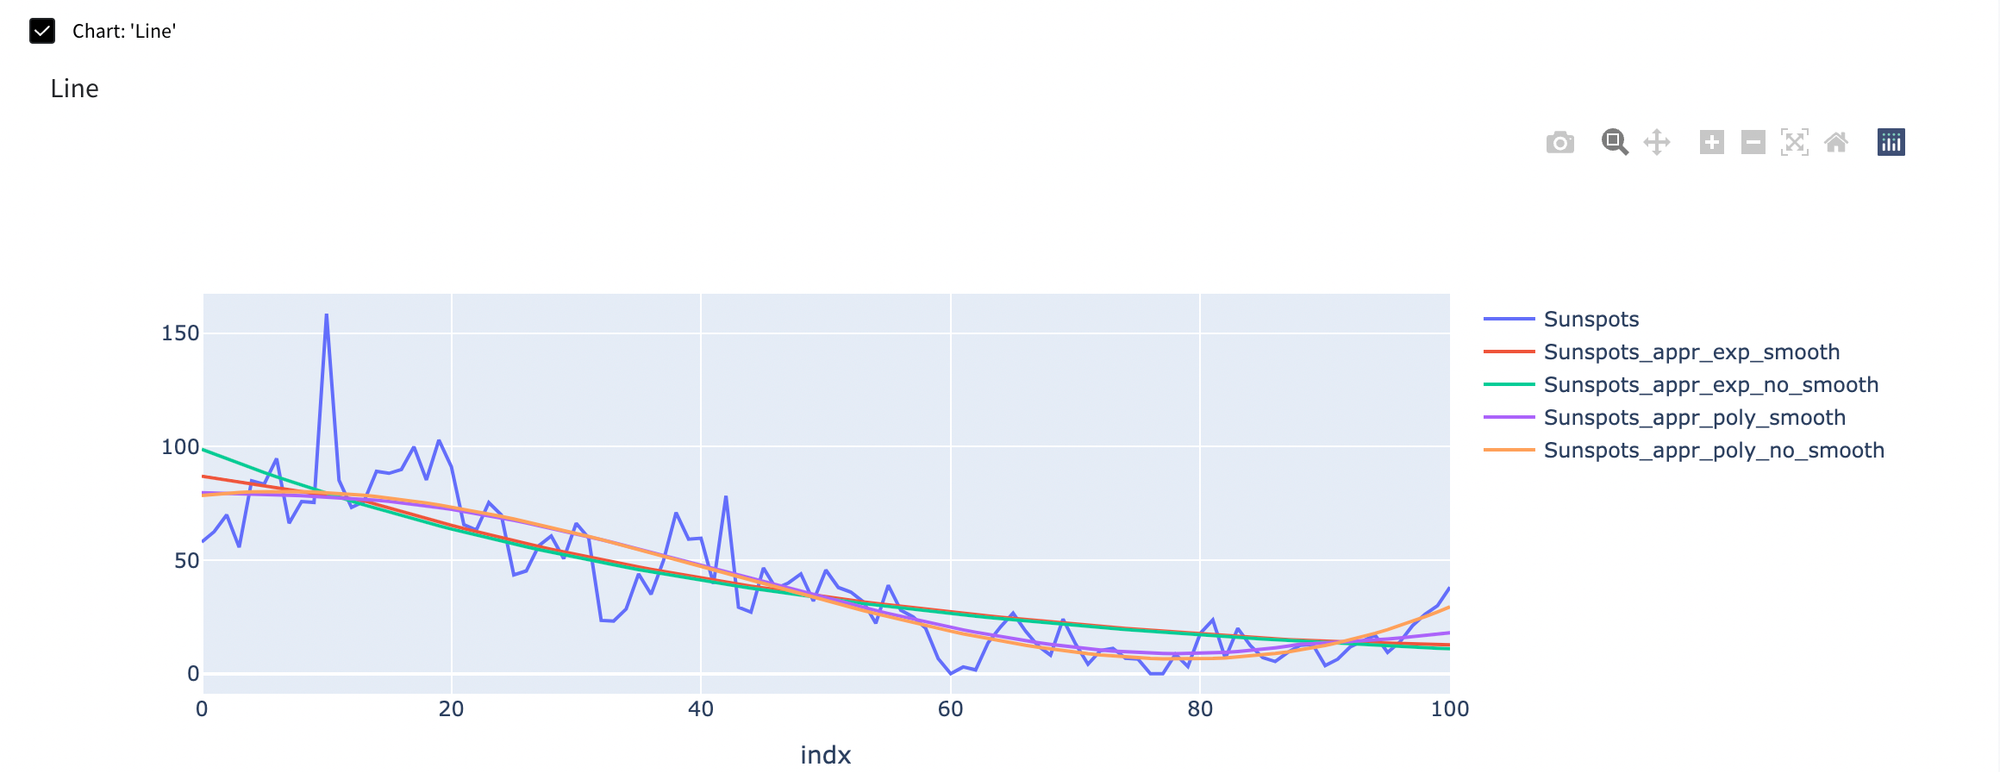
As we can see the results for all of them are quite similar. If there is a situation where you need to approximate function on the whole dataset, in that concrete case we would rather choose polynomial approximation without smoothing.