General Infomation
This brick provides a tool to normalize specified data columns.
Normalization is a technique often applied as part of data preparation for machine learning. The goal of normalization is to change the values of numeric columns in the dataset to a common scale, without distorting differences in the ranges of values. For machine learning, every dataset does not require normalization. It is required only when features have different ranges (for example, consider a data set containing two features, age(x1), and income(x2). Where age ranges from 0–100, while income ranges from 0–20,000)
Different data ranges will influence further analysis results, because models may consider one feature more important than others due to their higher values, while in practice, this usually is not the case.
There are many approaches to normalize the data, but this brick implements the column-by-column MinMax Scailing - this estimator scales and translates each feature individually such that it is in the given range on the training set, e.g. between zero and one.
The transformation is given by:
There are many effects of normalization for different algorithms, but, in general, it improves the model's numerical stability and may speed up the training process.
But be mindful that normalization can harm the performance of distance-based clustering algorithms by assuming equal importance of features.
Description
Brick Locations
Bricks → Data Manipulation → Transform → Normalize columns
Bricks → Analytics → Features Engineering → Normalize columns
Bricks → Use Cases → Credit Scoring → Features Engineering → Normalize columns
Brick Parameters
- Columns
List of columns to normalize. It is possible to choose several columns by clicking on the '+' button in the brick settings. Notice that brick will process only numerical columns and will raise an error message otherwise
- Brick frozen
This parameter enables the frozen run for this brick. It means that all current calculated normalized values will be saved for the next runs, which may be useful after pipeline deployment.
This option appears only after successful regular run.
Brick Inputs/Outputs
- Inputs
Brick takes the data set without any restrictions.
- Outputs
Brick produces the result as a new dataset. All normalized values will overwrite columns and will not create new ones.
Example of usage
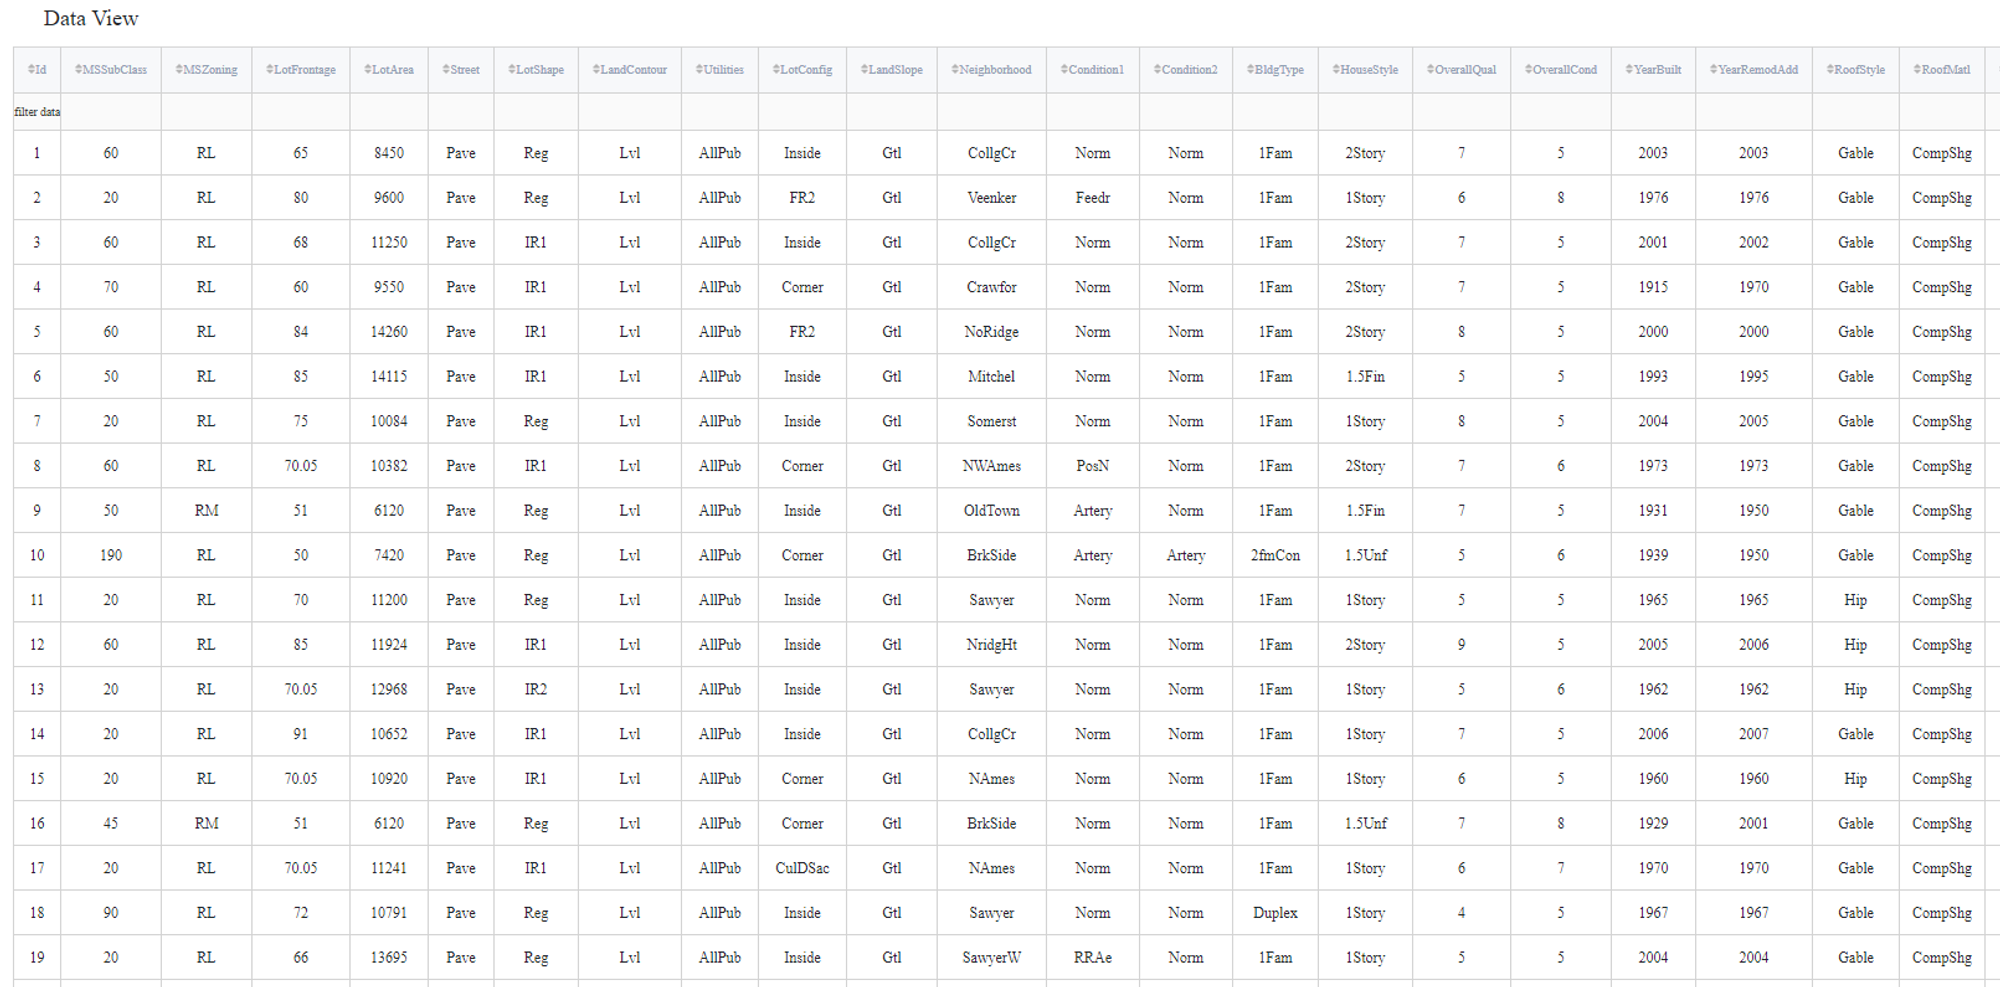
Let's consider the regression problem: Generic regression - House Price Prediction. In addition, consider using missing value treatment.
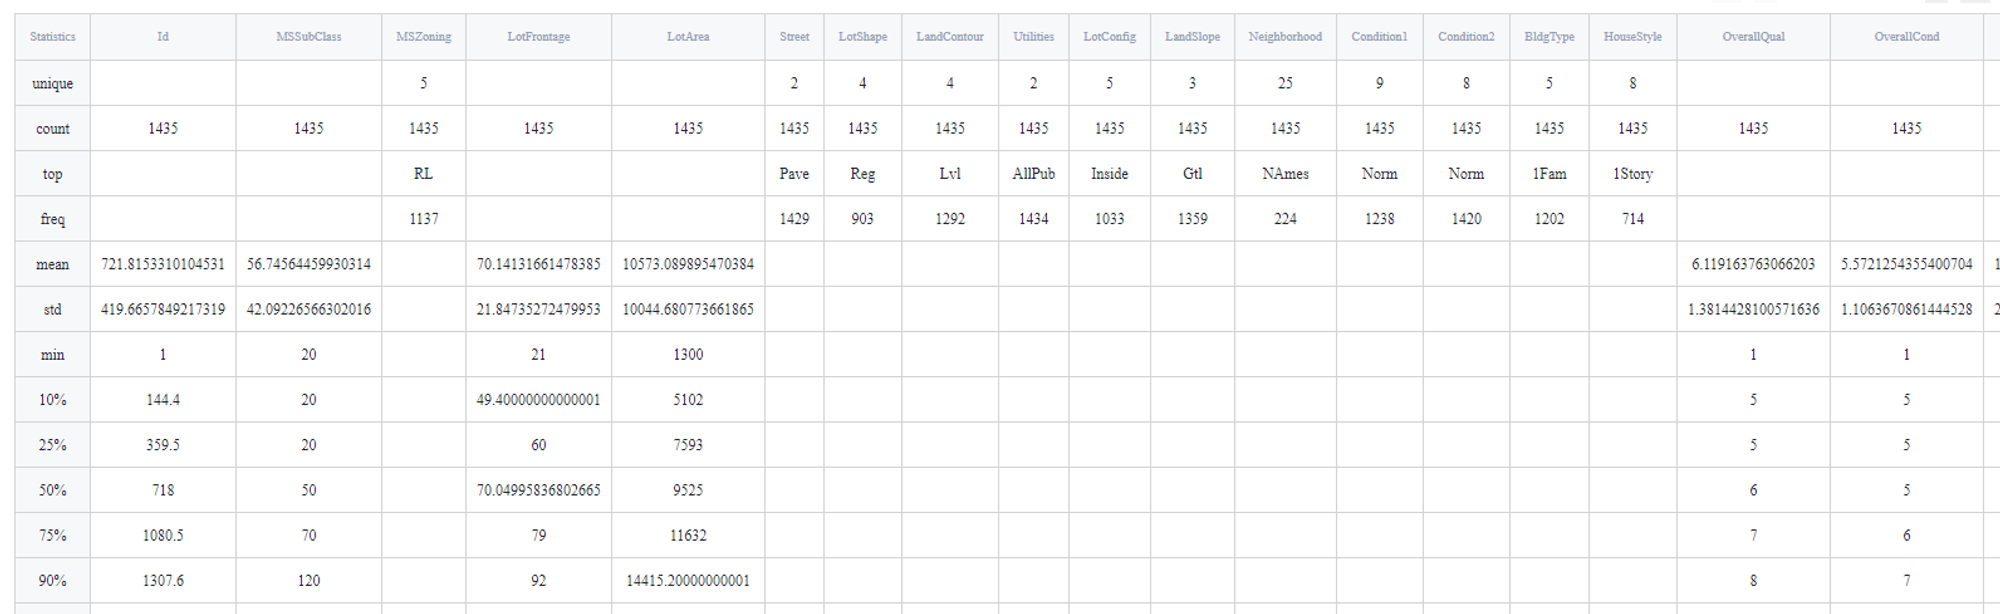
This data set contains many columns, but we are only interested in those that have numerical non-categorical values:
- LotArea: Lot size in square feet
- MasVnrArea: Masonry veneer area in square feet
- BsmtFinSF1: Type 1 finished square feet
- BsmtFinSF2: Type 2 finished square feet
- BsmtUnfSF: Unfinished square feet of basement area
- TotalBsmtSF: Total square feet of basement area
- 1stFlrSF: First Floor square feet
- 2ndFlrSF: Second floor square feet
- LowQualFinSF: Low quality finished square feet (all floors)
- GrLivArea: Above grade (ground) living area square feet
- GarageArea: Size of garage in square feet
- WoodDeckSF: Wood deck area in square feet
- OpenPorchSF: Open porch area in square feet
- EnclosedPorch: Enclosed porch area in square feet
- 3SsnPorch: Three season porch area in square feet
- ScreenPorch: Screen porch area in square feet
- PoolArea: Pool area in square feet
- MiscVal: $Value of miscellaneous feature
- SalePrice: target variable
Executing regular pipeline
Next steps would be made to build simple pipeline:
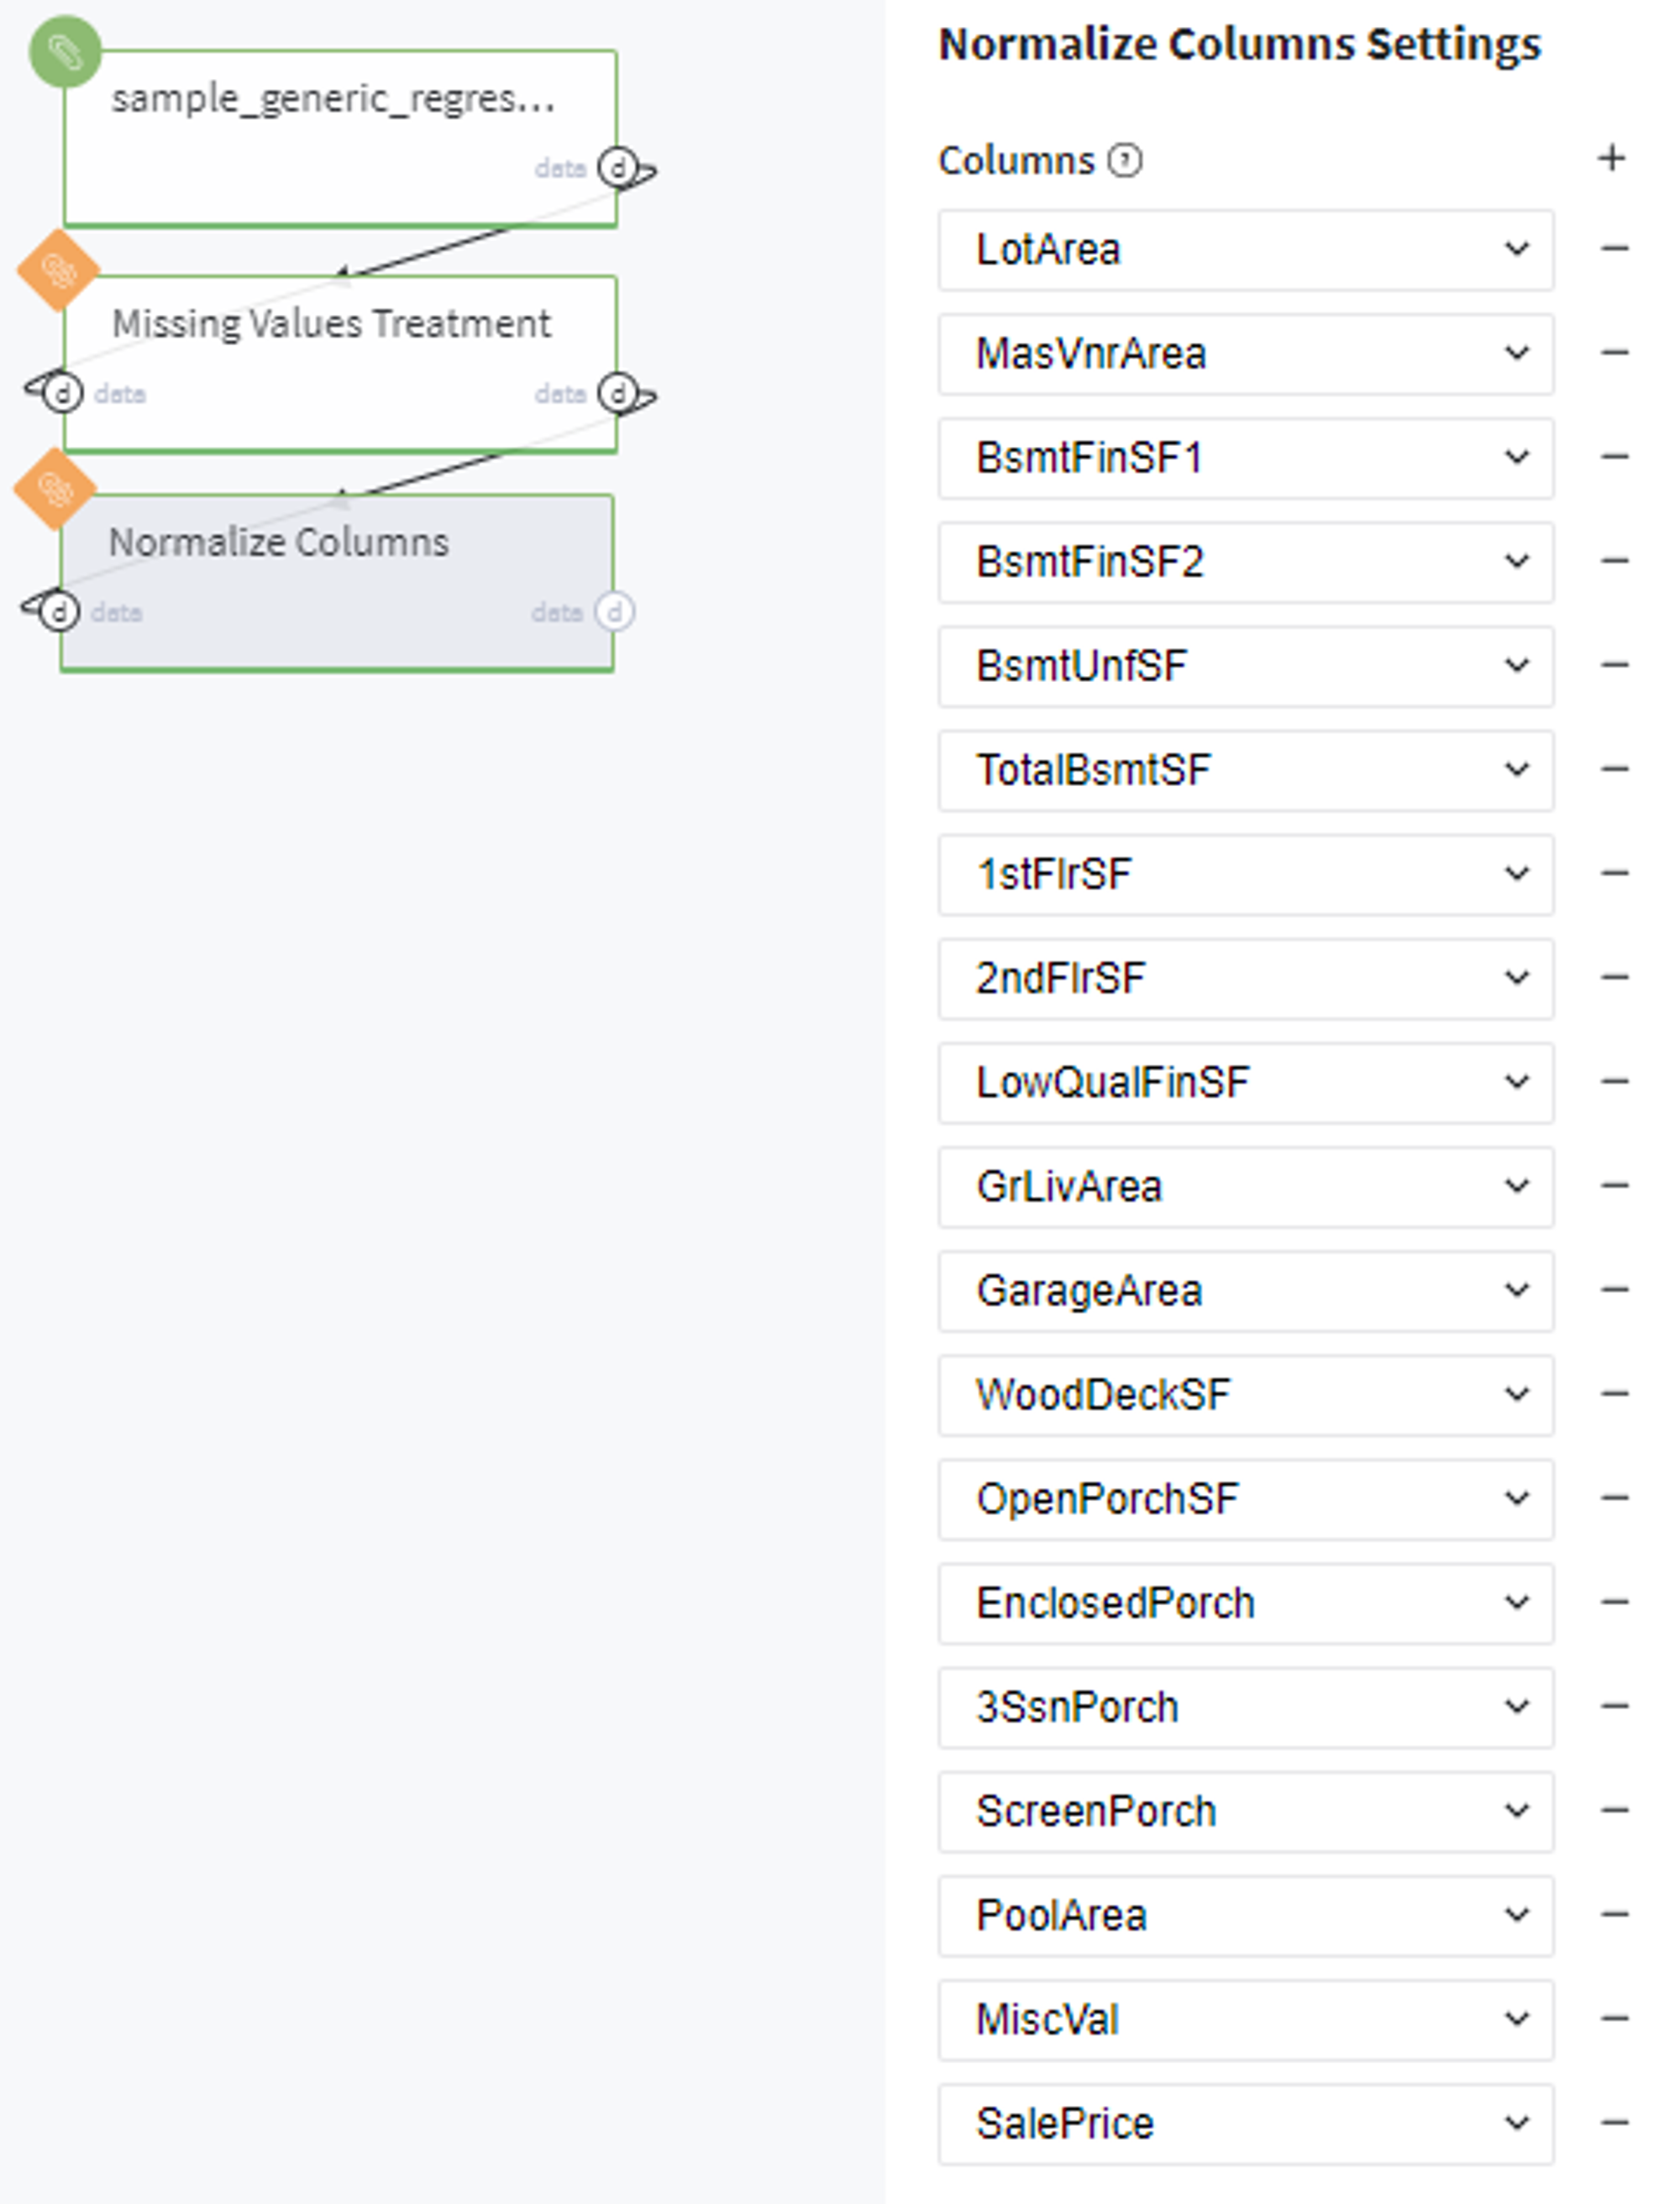
- First, drag'n'drop sample_generic_regression.csv file from Storage→Samples folder and Normalize Brick from Bricks →Data Preprocessing, as well as Missing Value Treatment (data set has some missing values)
- Connect titanic data set to Missing Values Treatment and then to our "Normalize " brick
- Set missing values treatment brick
- Specify all listed earlier columns
- Run the pipeline
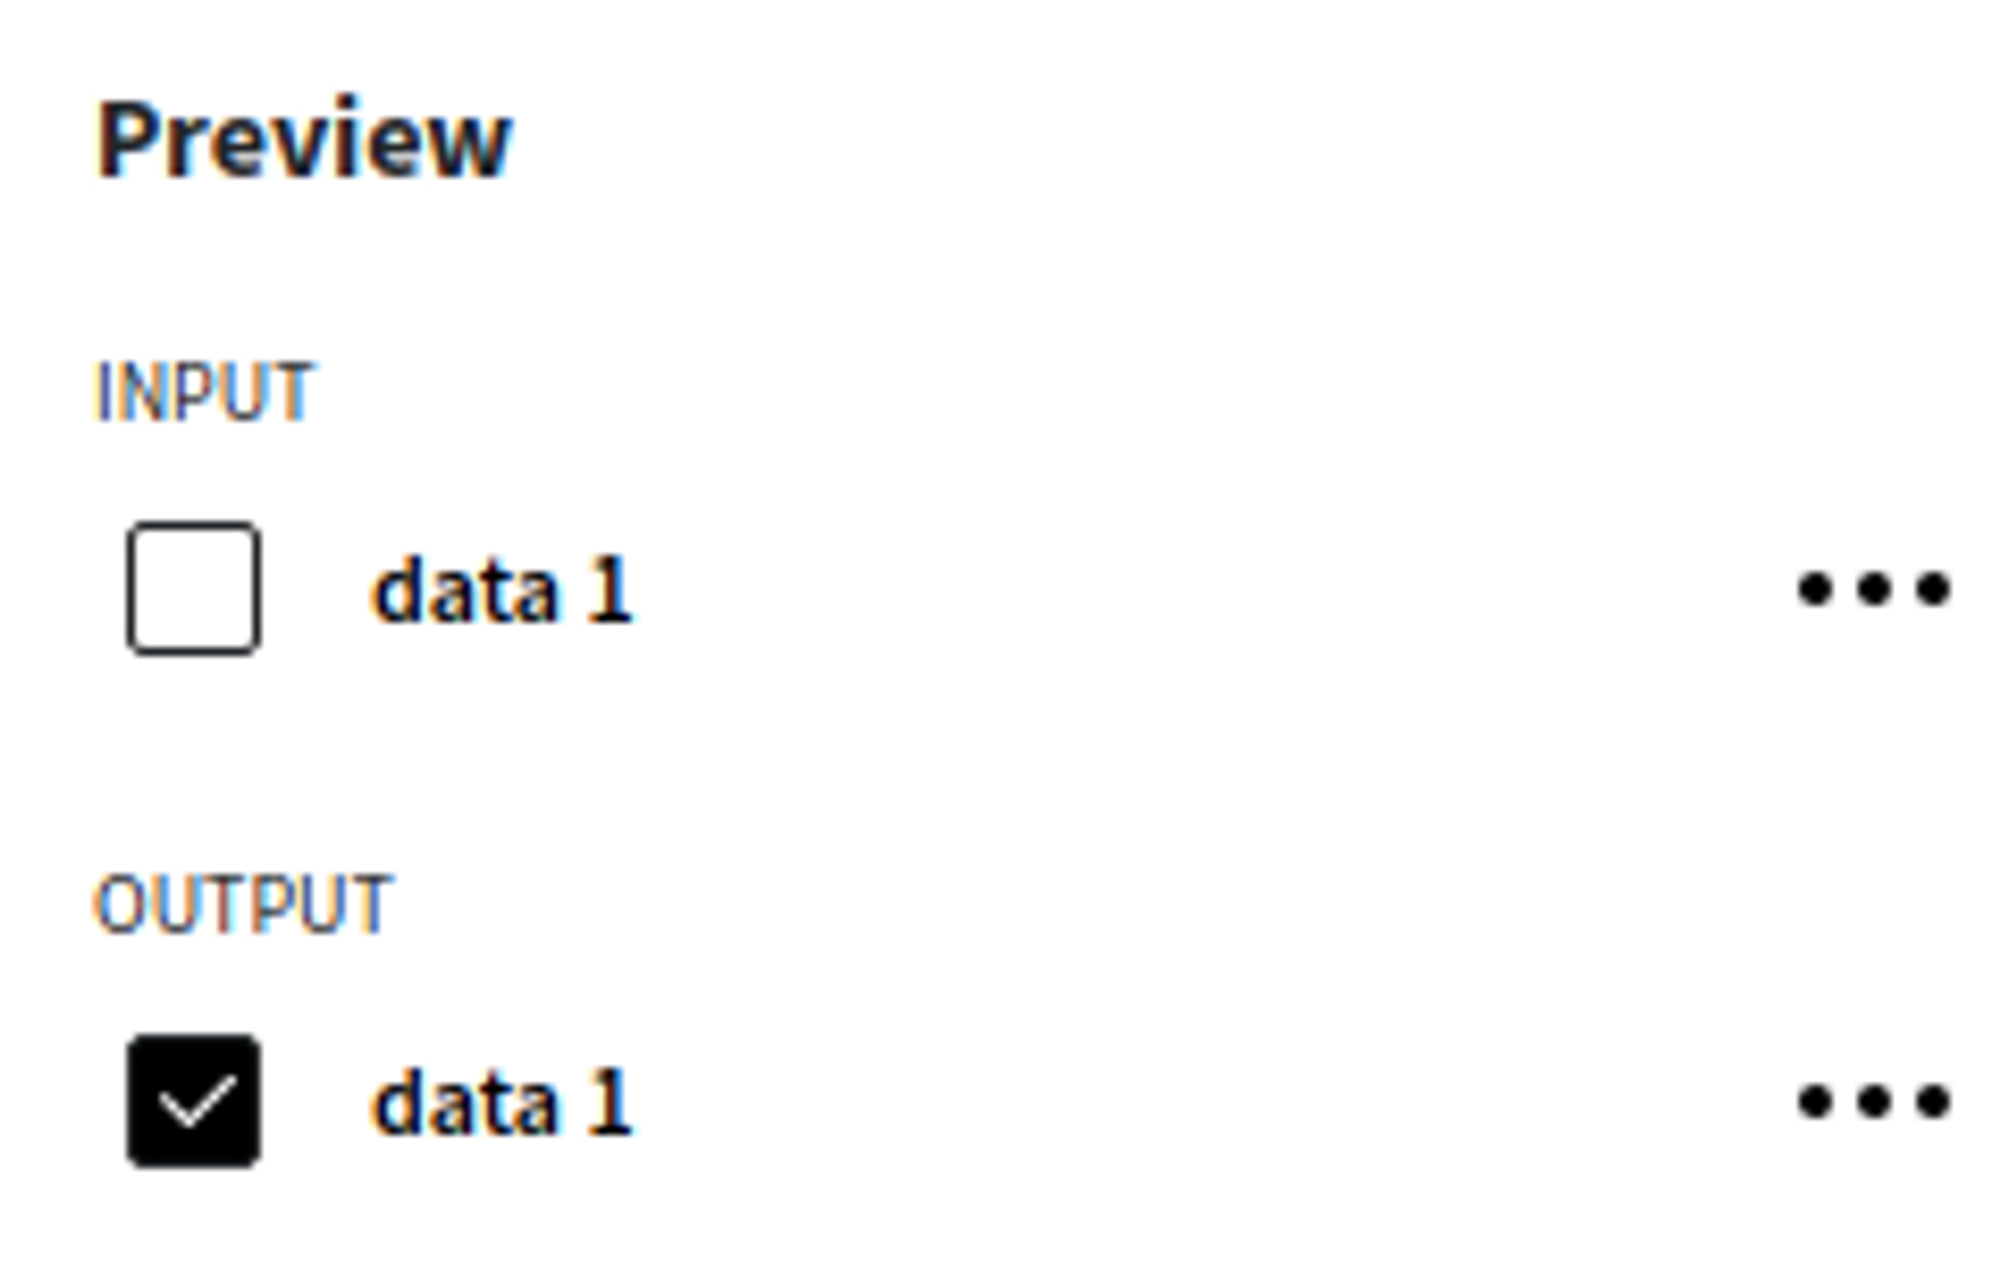
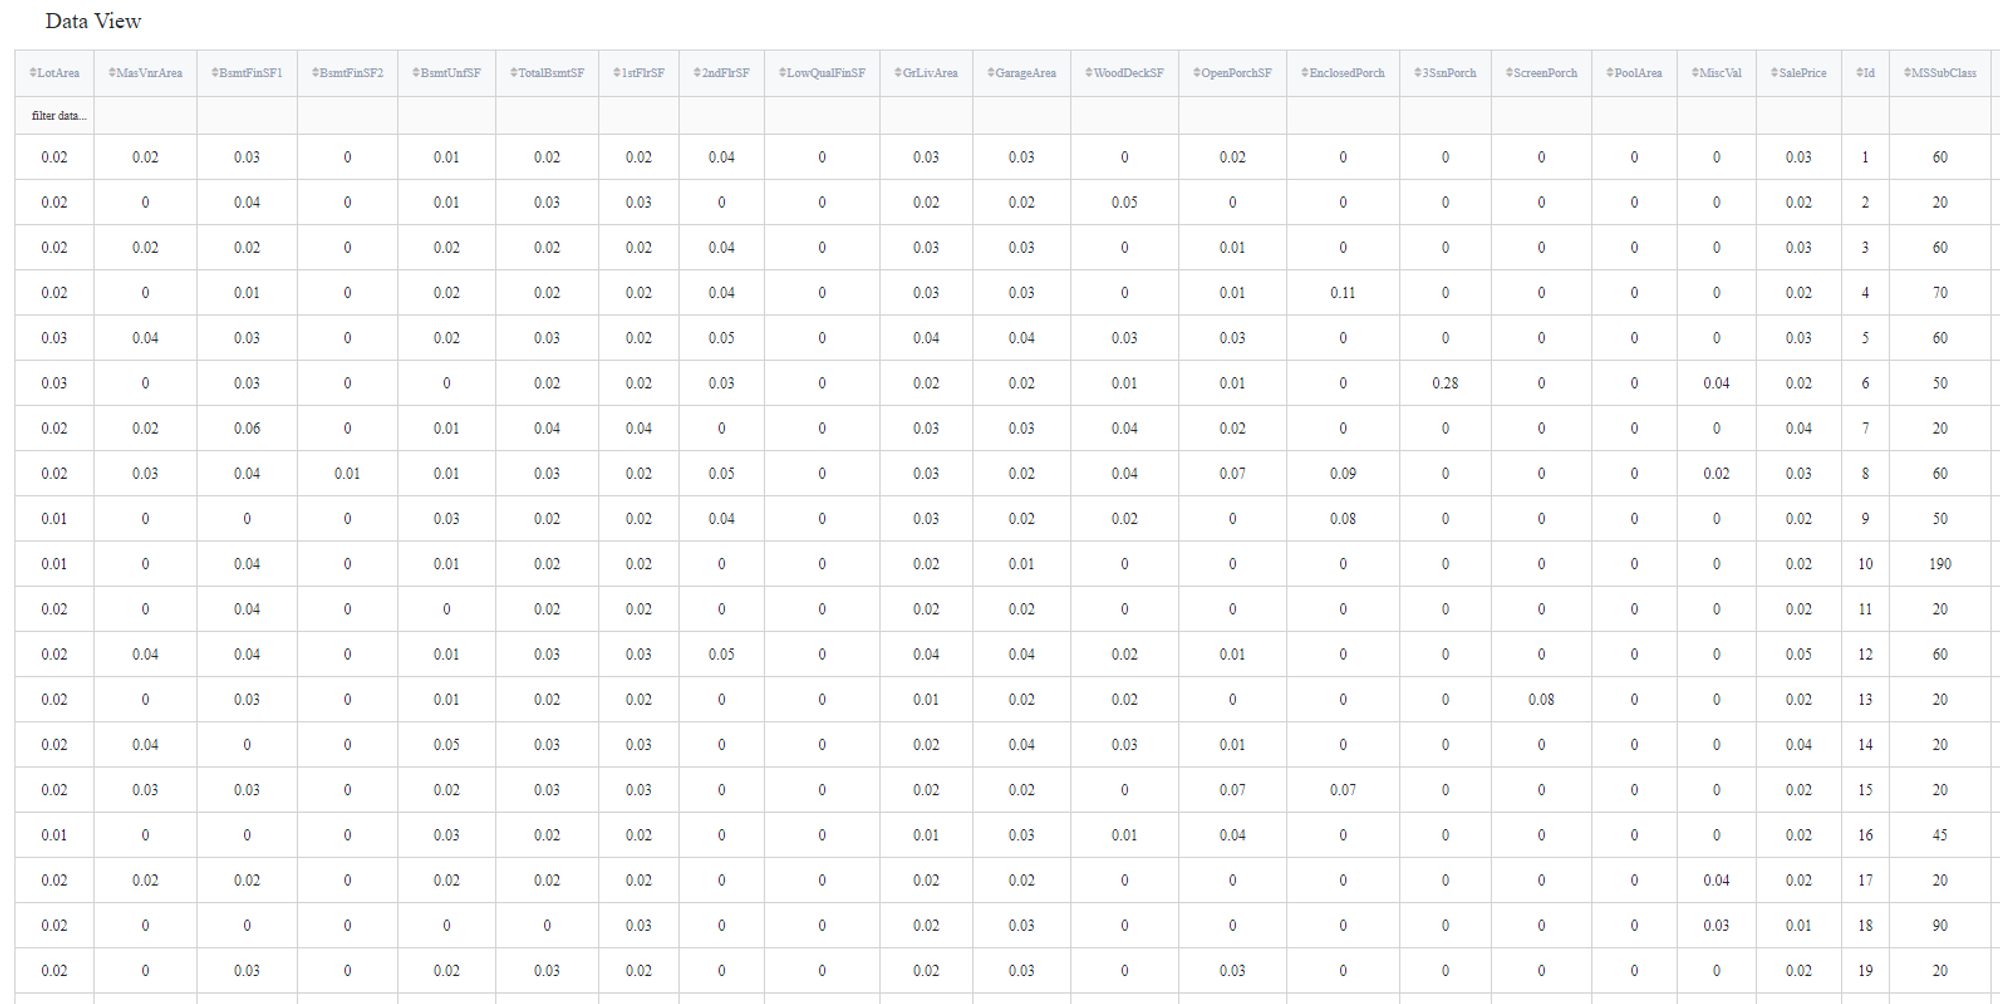
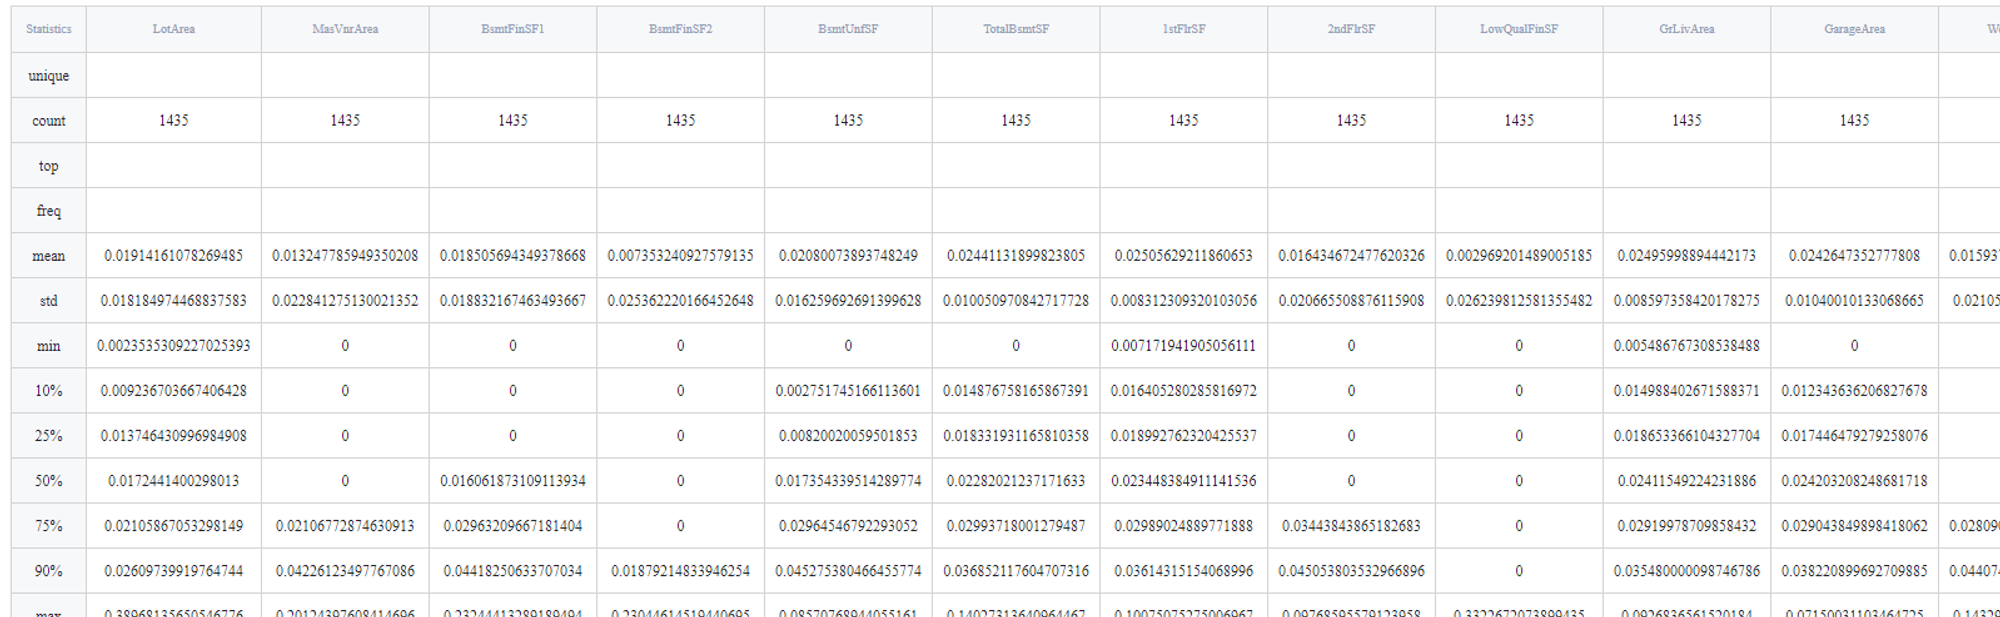
In order to see the assessment result, you should open the Output data previewer on the right sidebar.
The results are depicted in the table:
Executing frozen pipeline run:
After completing the previous steps you need to check the 'Brick frozen' options in the 'General Settings' section:
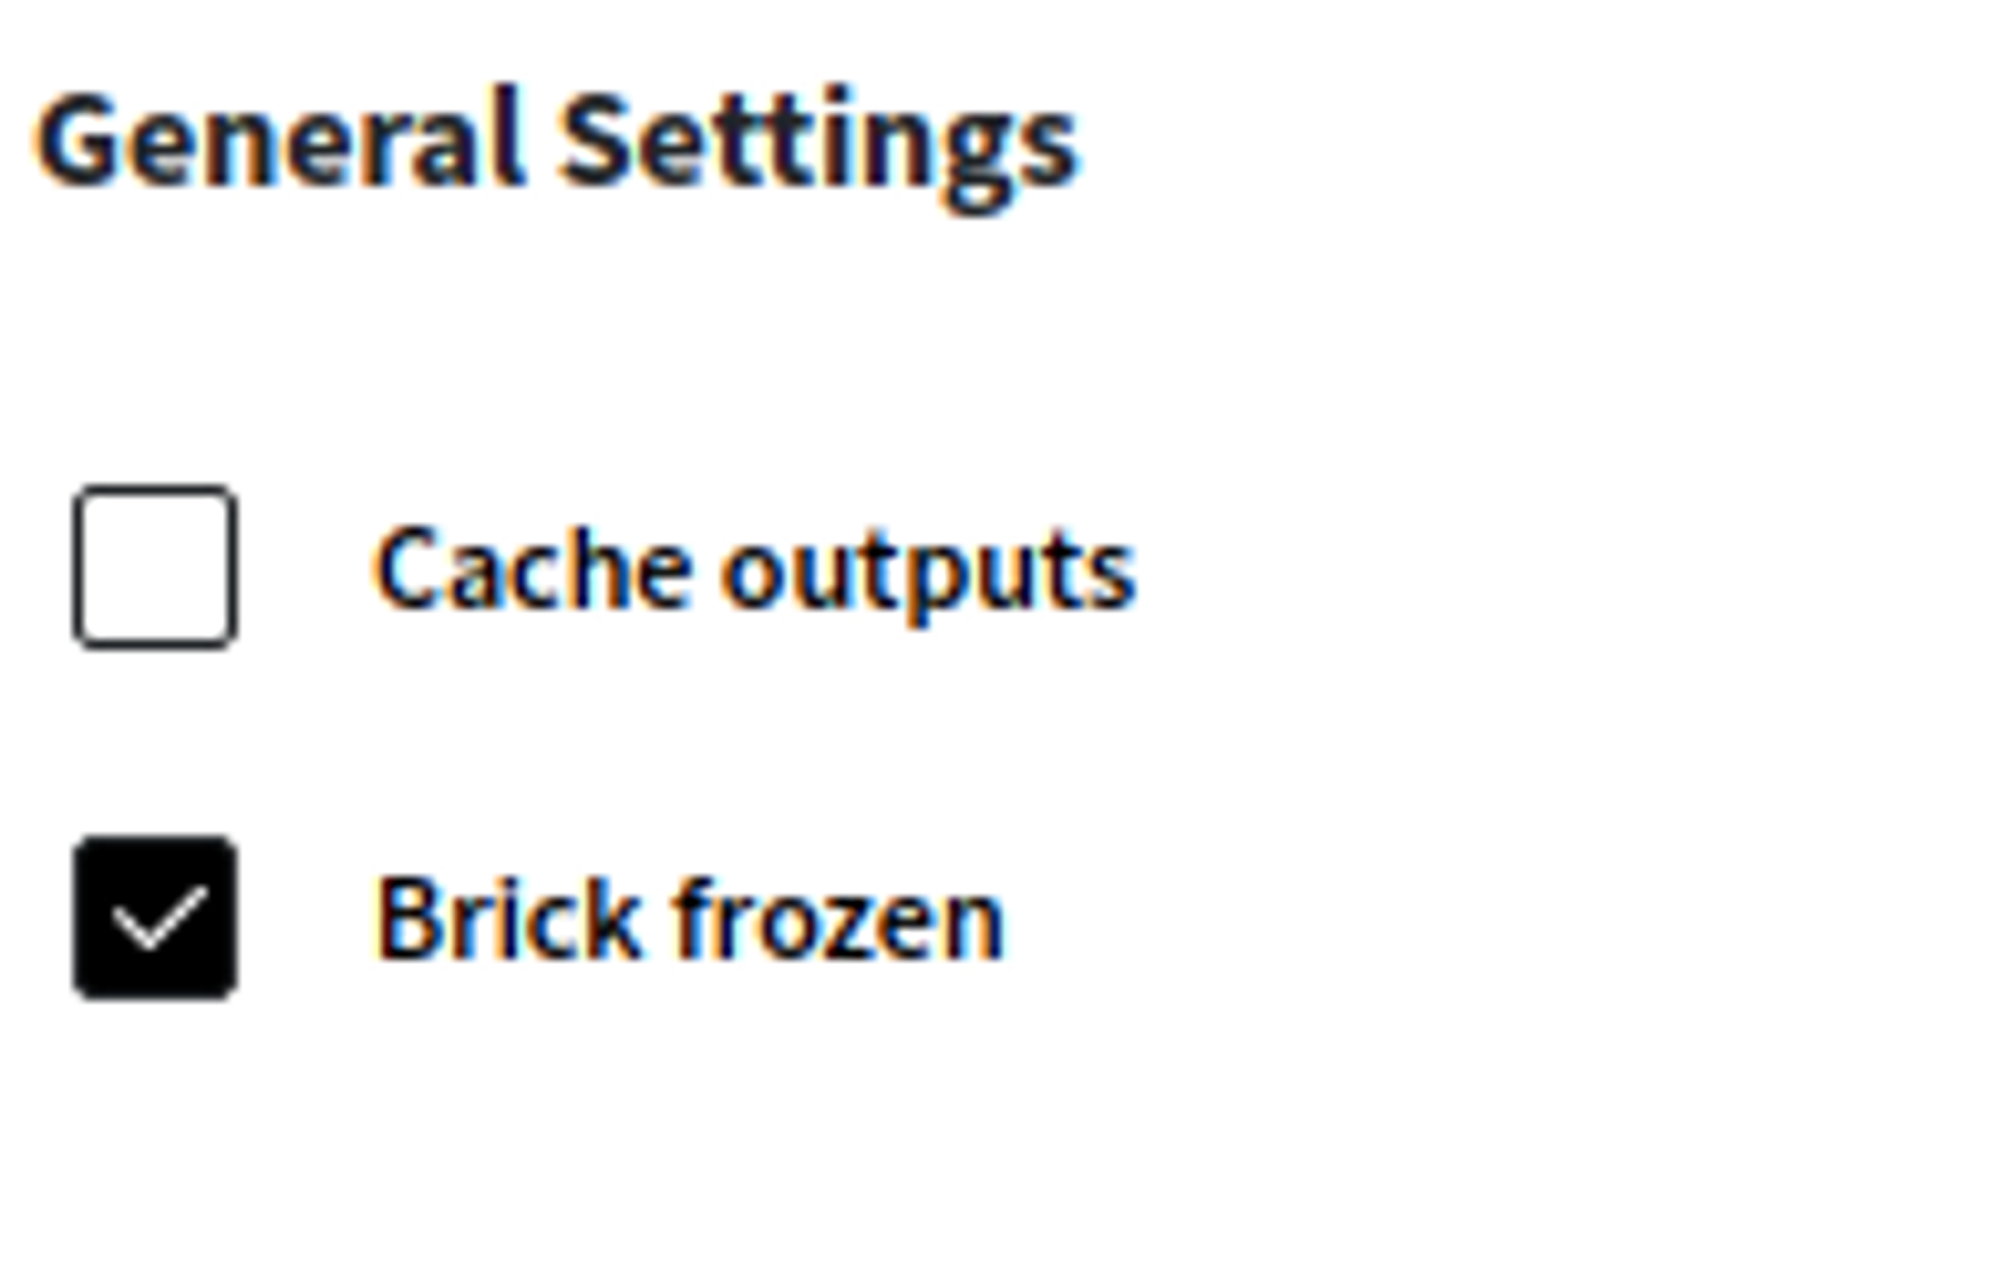
This ensures that every time we execute our pipeline, the current normalized values would be saved even if new data points will be given.