General information
An outlier is a value that lies far from the other values. Outliers affect general data patterns and distort real results. Before statistical analysis, it is recommended to exclude them from the dataset. There are several ways how to find outliers and they will be described further.
Interquartile range is often used to detect outliers. The method takes 1st and 3rd quartiles (Q1 and Q3) to calculate interquartile range and then find lower and upper bounds. The formulas are:
So if the value is below lower bound or above upper bound, it is considered as an outlier.
Other way is using anomaly detection algorithm such as isolation forest. The logic behind this is to find isolated points by recursive partitioning. In this case we do not need to find the normal values and compare all the points, which making this algorithm fast and accurate. The number of splittings required to isolate a sample is equivalent to the path length from the root node to the terminating node. This path length, averaged over a forest of such random trees, is a measure of normality and our decision function.
There is also an SVM-based algorithm for anomaly detection, which also can be used to detect outliers. SVM is used to separate two classes with one hyperplane with the largest possible margin. One-class SVM uses hypersphere instead of hyperplane and tries to separate outliers with the smallest possible hypersphere.
Also boxplots and other visualization techniques are used in order to detect outliers.
Description
Brick Locations
Bricks → Analytics → Outliers Treatment
Brick Parameters
Explain what parameters of the brick needs to or can be filled.
- Outcome
- remove outliers
- select outliers
- indicate outliers
There are three ways to treat outliers:
Advanced parameters:
- Outliers treatment strategy
- Interquartile range
- Isolation forest
- One-Class SVM
You can choose:
- Percent (using in Isolation Forest and One-Class SVM)
Can be any decimal number in range from 0.01 to 0.5.
- Columns
If you have columns in your data that need to be ignored and not be shown in the dashboard or in the output data, you should specify them in this parameter. To select multiple columns, click the '+' button in the brick settings.
In addition, you can ignore all columns except the ones you specified by enabling the "Remove all except selected" option. This may be useful if you have a large number of columns while needing just several of them to be analyzed.
Default Parameters
In a simple mode ‘interquartile range’ is used as a strategy and ‘remove outliers’ as a way to treat the outliers.
Brick Inputs/Outputs
- Inputs
Brick takes the dataset
- Outputs
Depending on chosen treatment, brick produces the dataset without outliers, the dataset that contains all the outliers or the dataset with a new column which returns -1 for outliers and 1 for normal values.
Example of usage
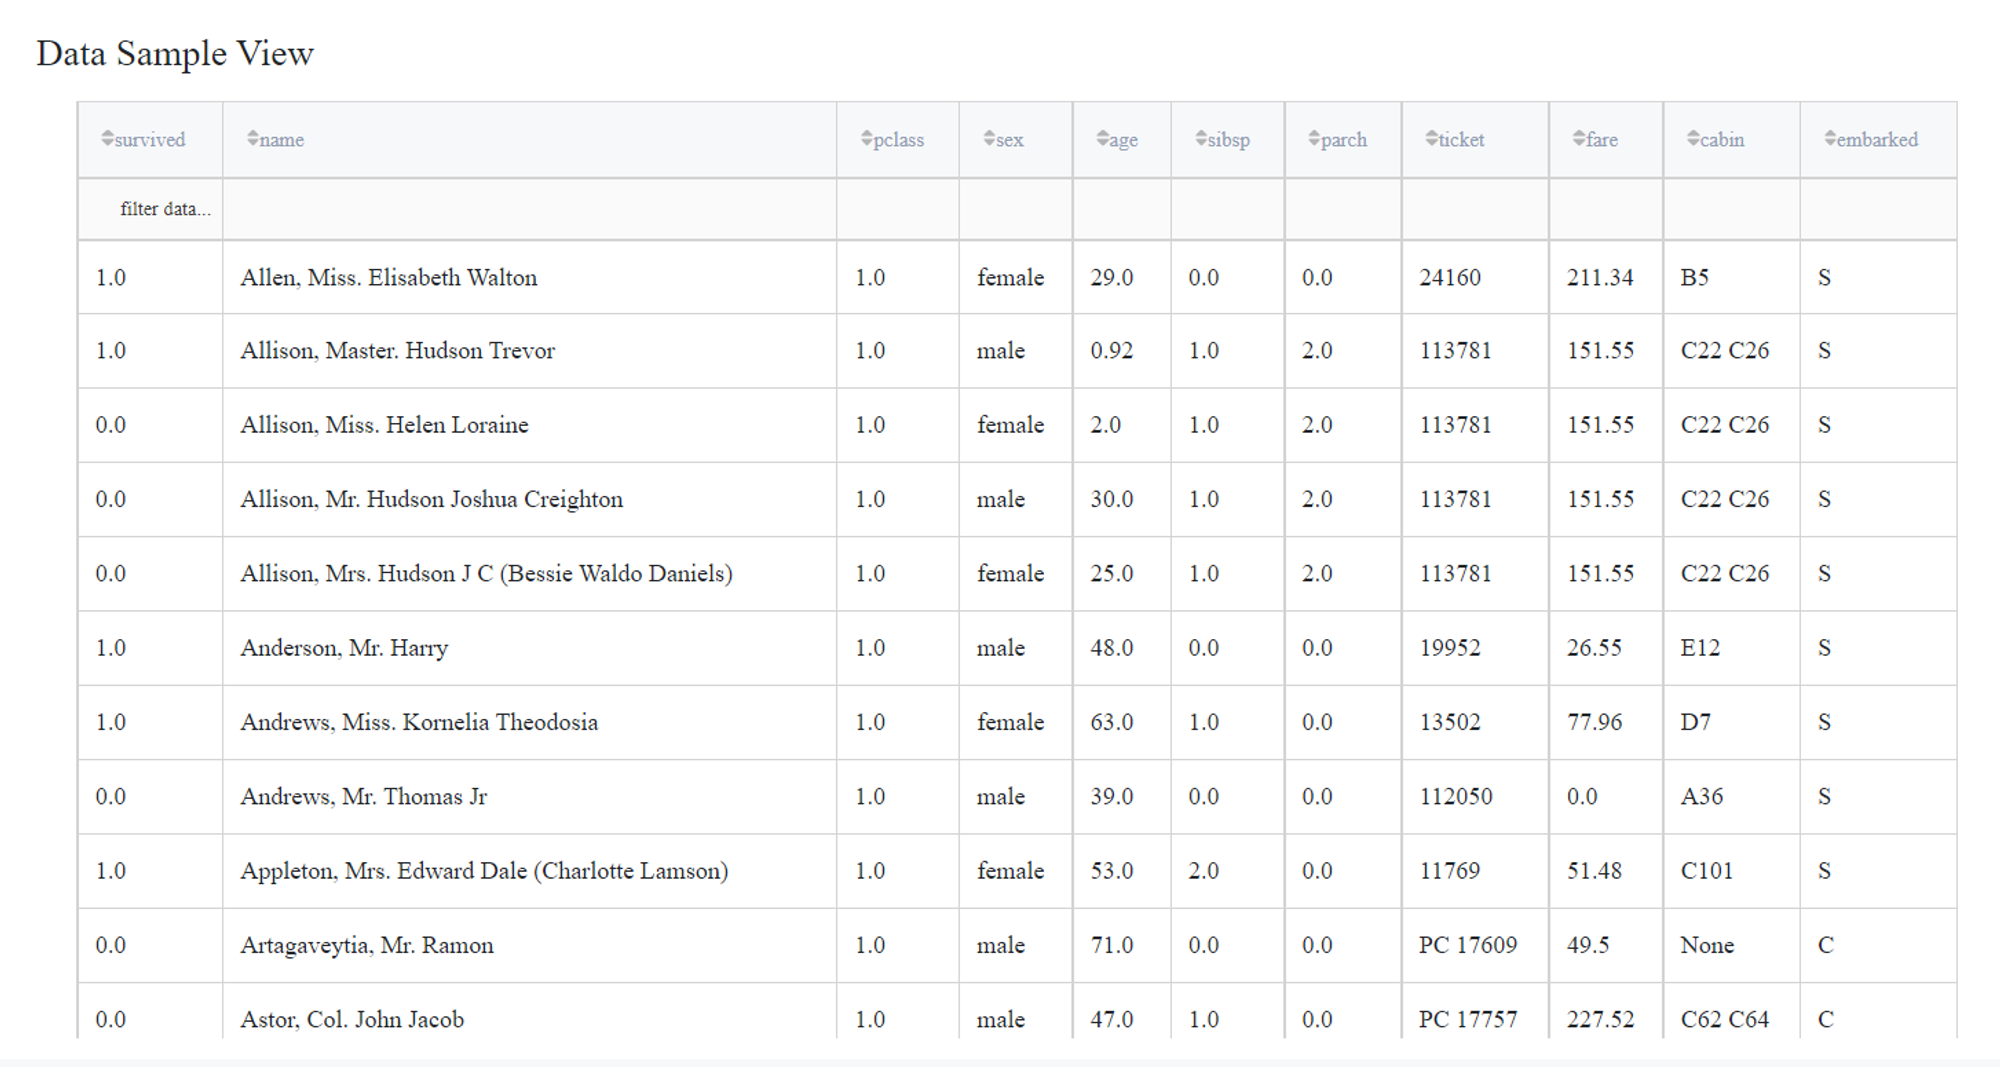
For demonstration, let us consider the Titanic dataset, which subset is presented below:
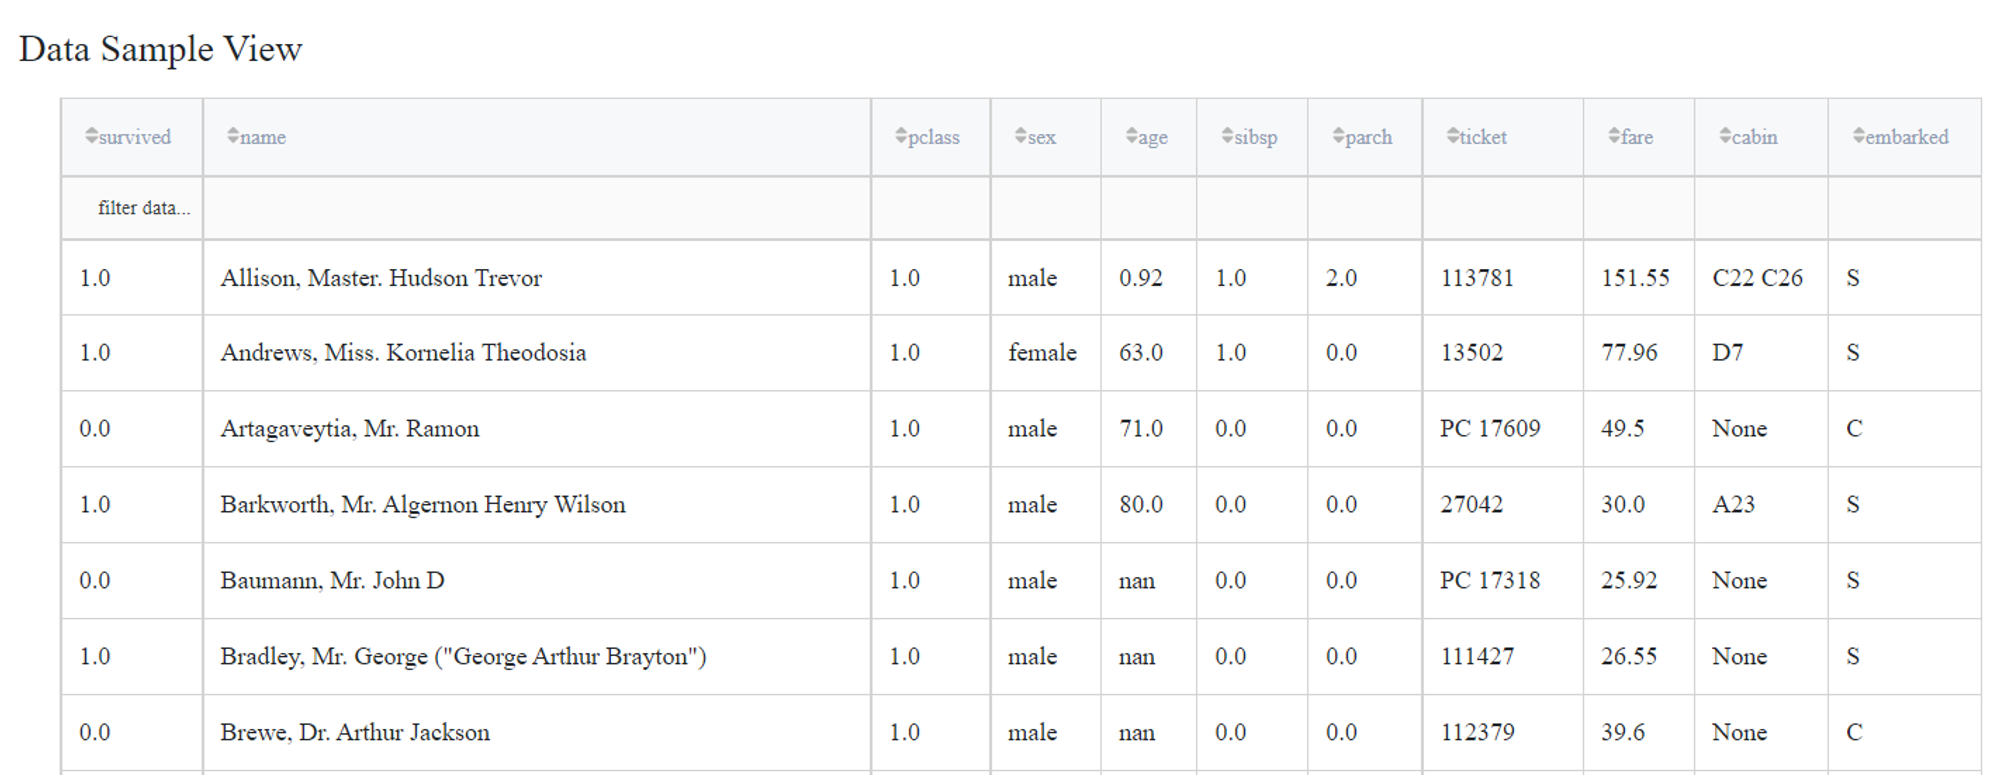
Simple mode with select outliers
If we choose ‘select outliers’, only outliers will be returned in a dataset
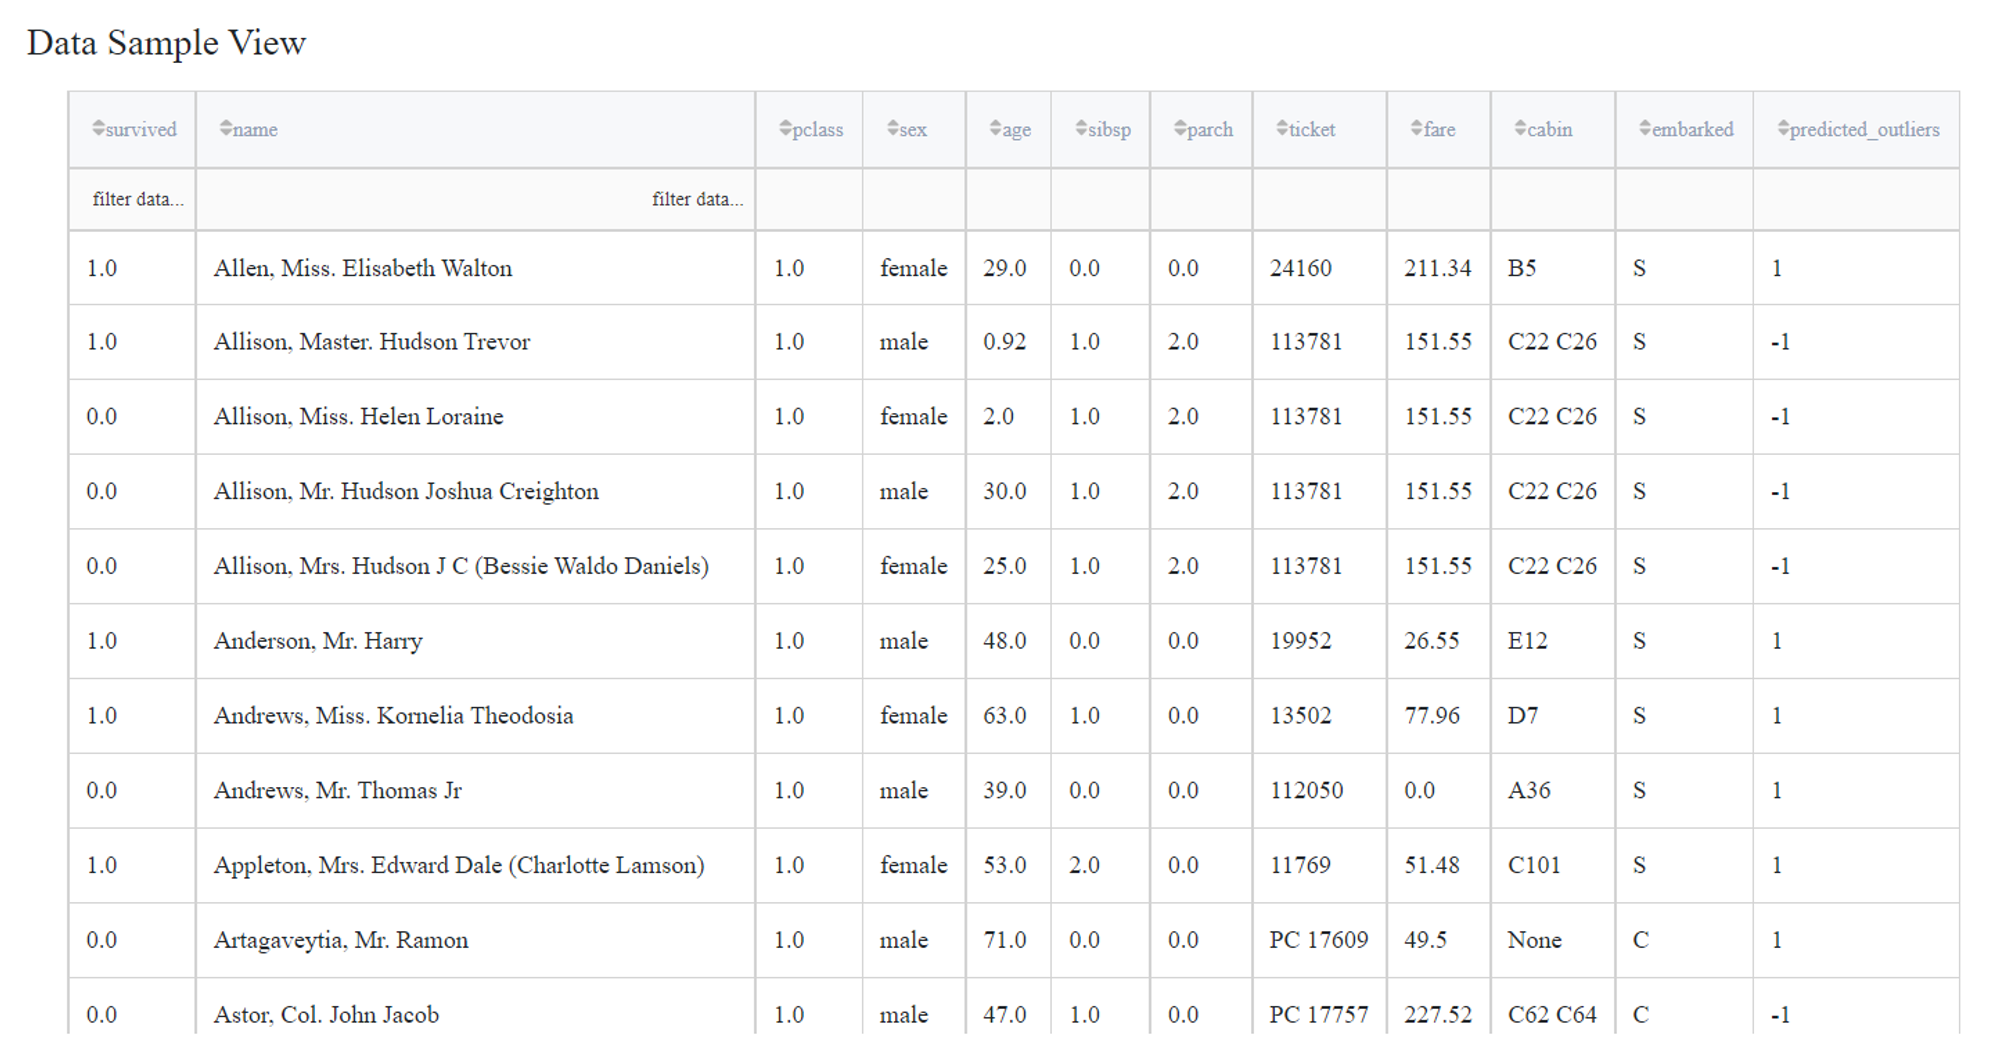
Advanced mode with indicate outliers
We turn on advanced settings to choose Isolation Forest algorithm and leave default percent.
As a result we get a dataset with a predicted_outliers column, where outliers marked as -1.