General information
Brick provides a possibility to reorganize and summarize the input data using a pivot table.
Description
Brick Location
Data Manipulation → Transform → Pivot Spreadsheet
Analytics → Data Insights → Pivot Spreadsheet
Brick Parameters
- Index
The name of the column in the input data frame, which unique values will be used as rows on the left side of the pivot table.
- Column
The name of the column in the input data frame, which unique values will be used as columns on the top of the pivot table.
The number of the unique values in the selected Column is limited to 100.
Note, that the missing values in the provided Index and Column will be ignored in the output report.
- Aggregation
Aggregation function that will be applied to the Value column across the selected Index and Column.
It is possible to summarize the data with Count, Mean and Sum functions.
- Value
The name of the column in the input data frame, which will be summarized and presented in the cells of the pivot table.
This field can be empty with Count aggregation if only statistics across index and column is needed.
- Column names configuration: add operation to name
The binary flag, that determines the format of produced column names in the resulted pivot table.
If the checkbox is on, the name of the selected Value column and Aggregation function will be additionally specified in every column of the pivot table. Otherwise, only provided Column fields will yield column names.
Brick Inputs/Outputs
- Inputs
Brick takes the dataset with at least 2 columns to be provided as Index and Column. Additionally, one more column can be used as Value.
- Outputs
Brick produces the result as a new dataset, where the first column is named the same as Index column and the rest receive their names from the unique values of the Column column.
On the other hand, the number of rows in the output report is equal to the number of unique values in the column which was specified as Index.
Examples of usage
In order to investigate the possibilities of the Pivot Spreadsheet Brick, let us consider the Titanic dataset as the input data, which can be found in Storage → Samples → titanic.csv, and find out how we can use the given brick.
Firstly, suppose we want to detect how the average ticket price is different depending on ticket class and port of embarkation.
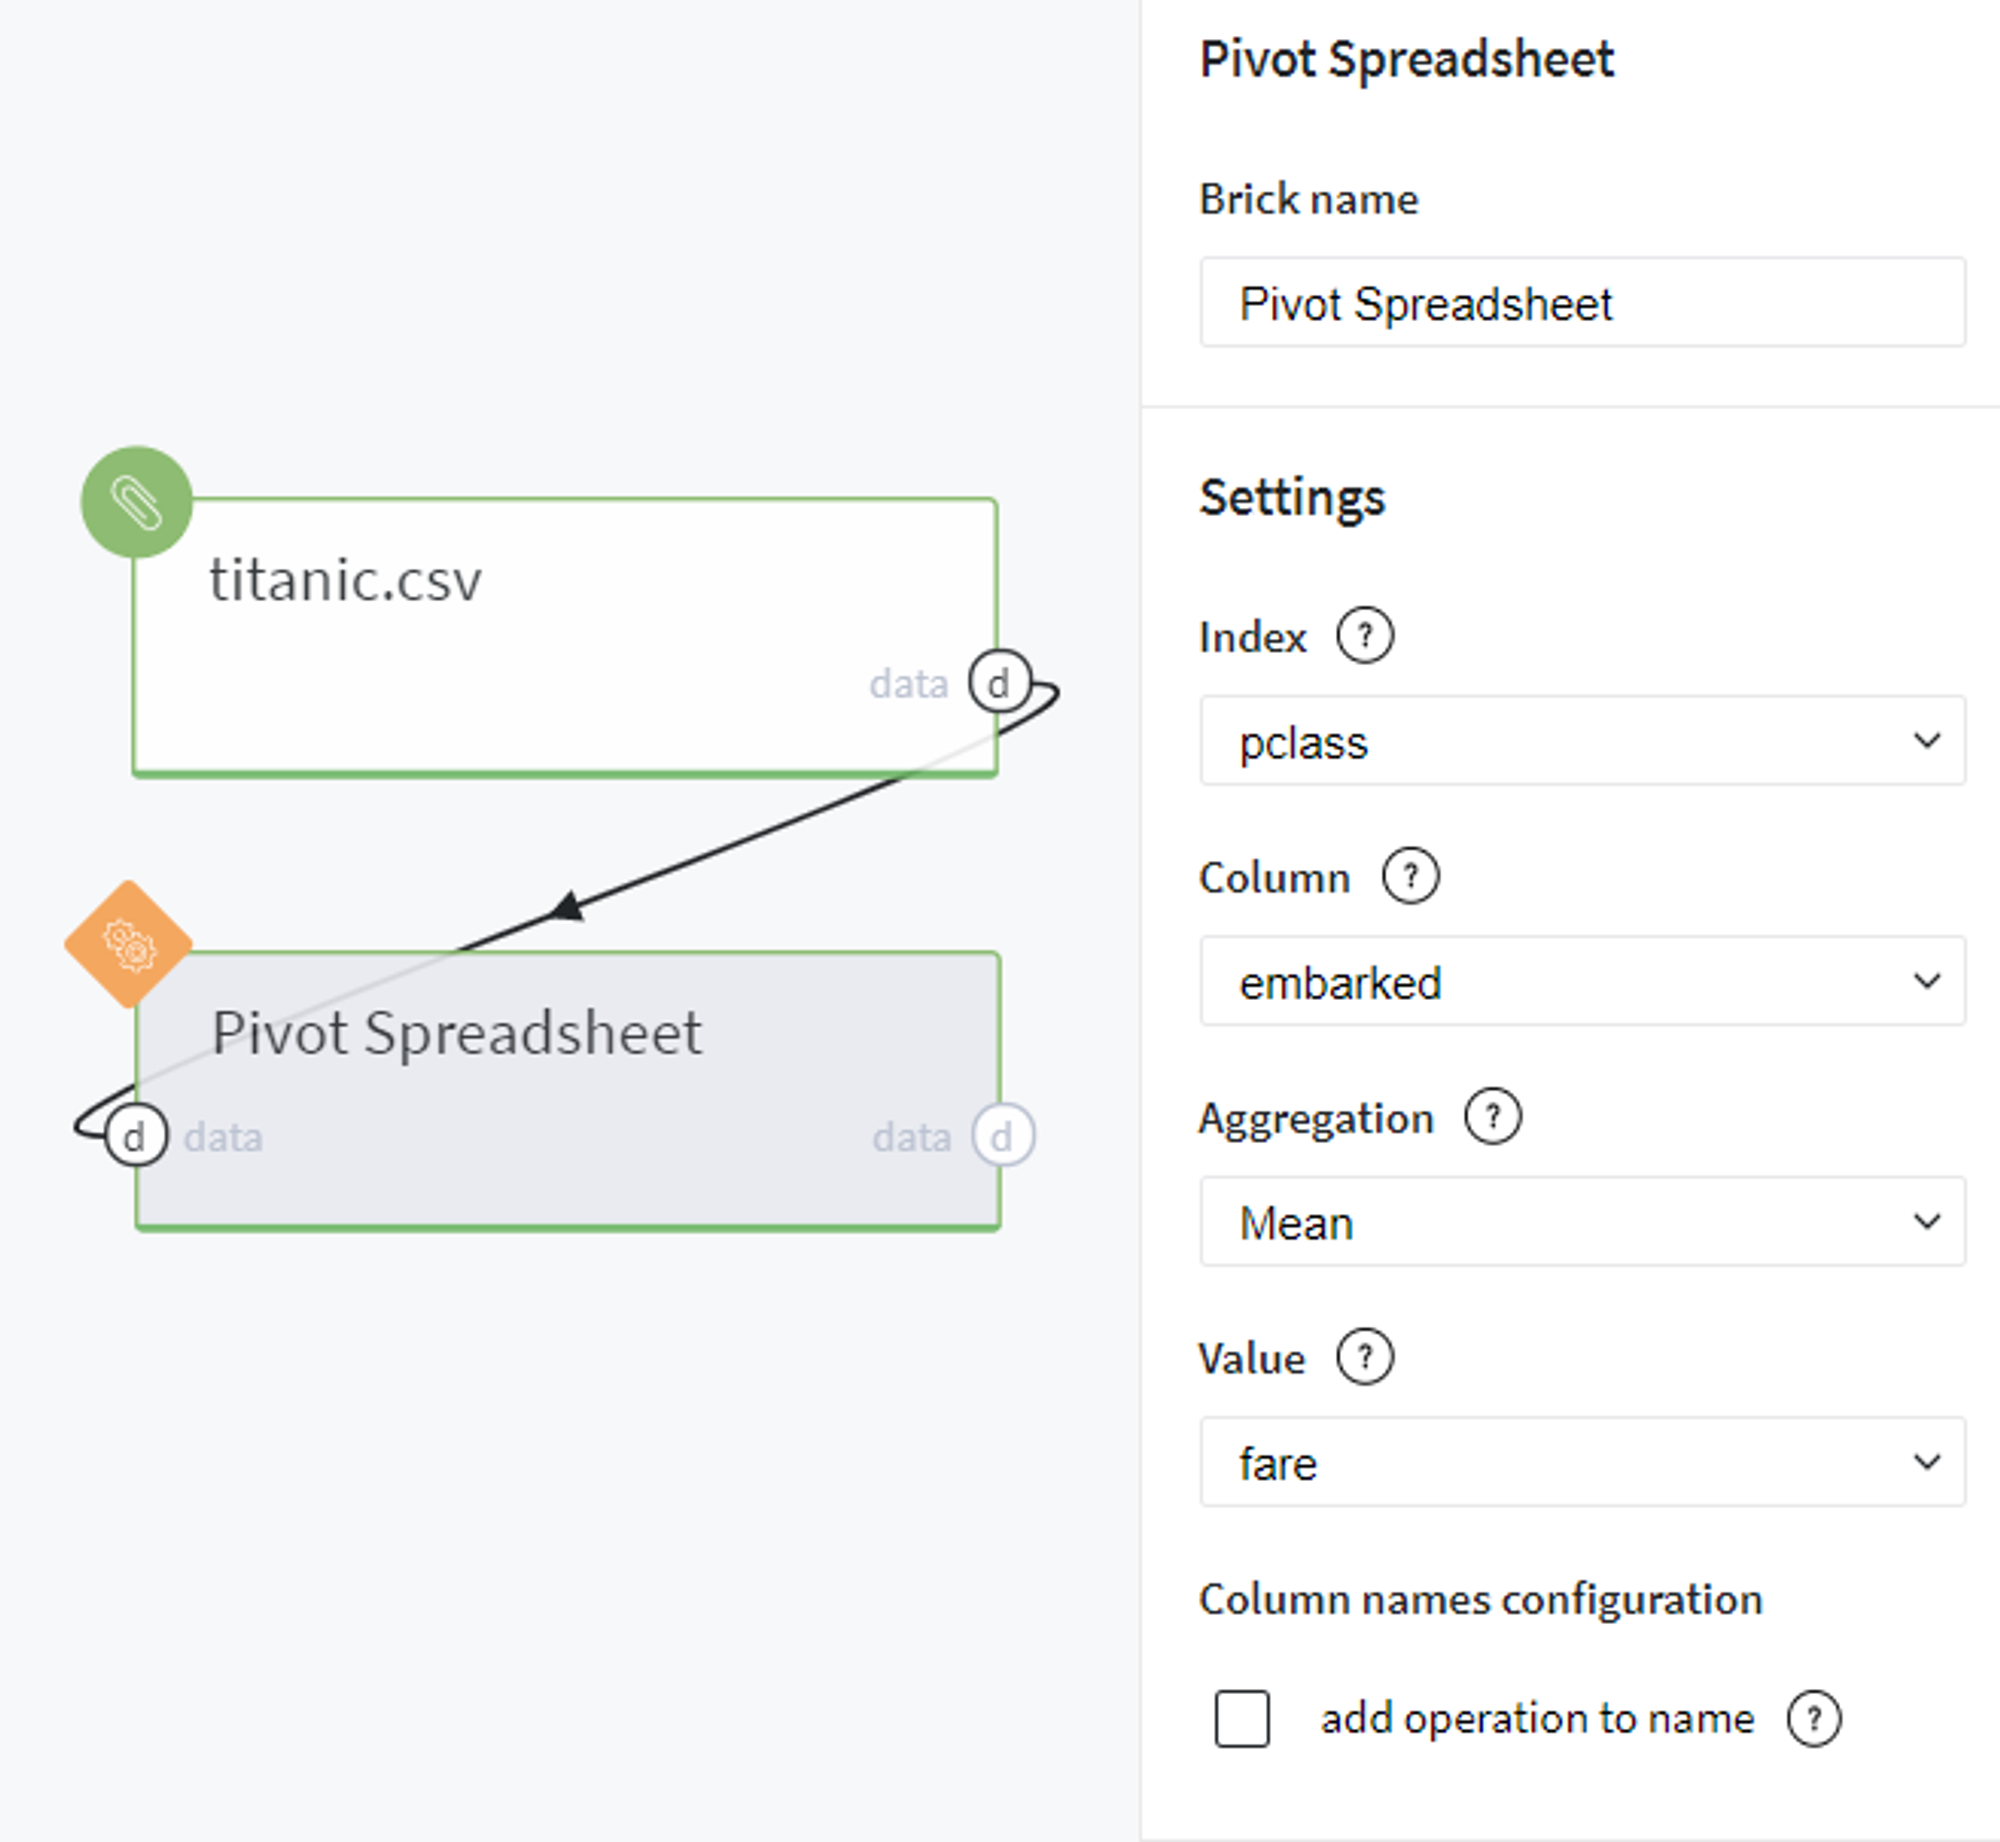
To answer this question we feed the data into the Pivot Spreadsheet brick and provide the parameters as shown in the image on the right.
Here we specify the columns pclass and embarked as Index and Column respectively, define the Mean as aggregation method and put fare as Value.
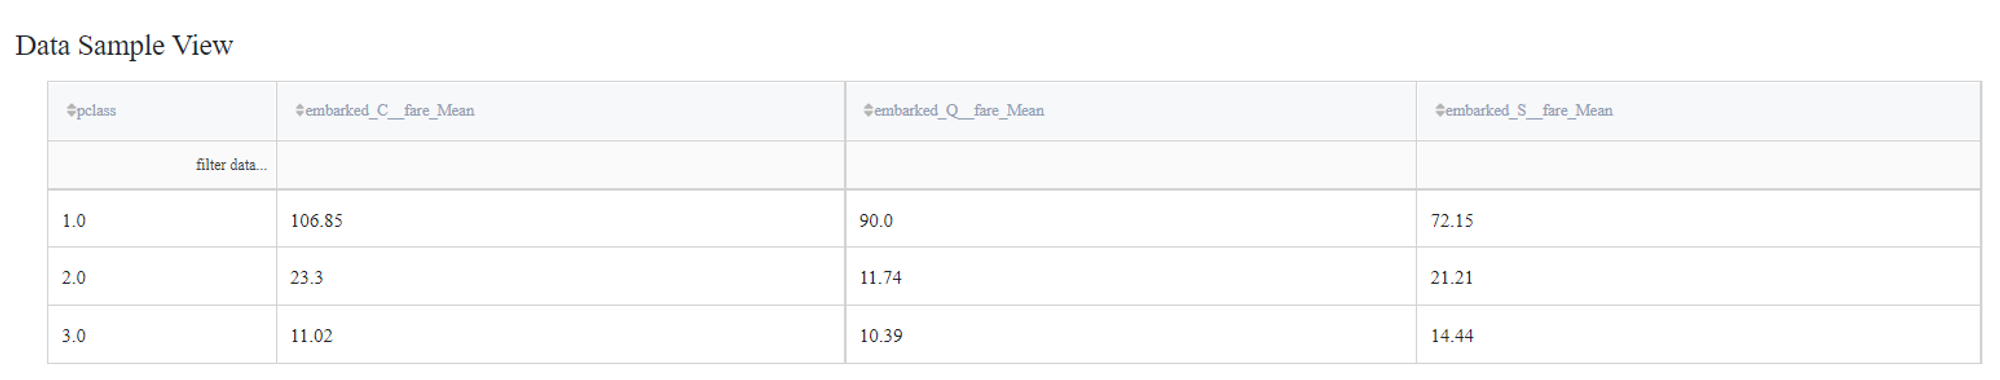
After running this brick we receive the following pivot table:
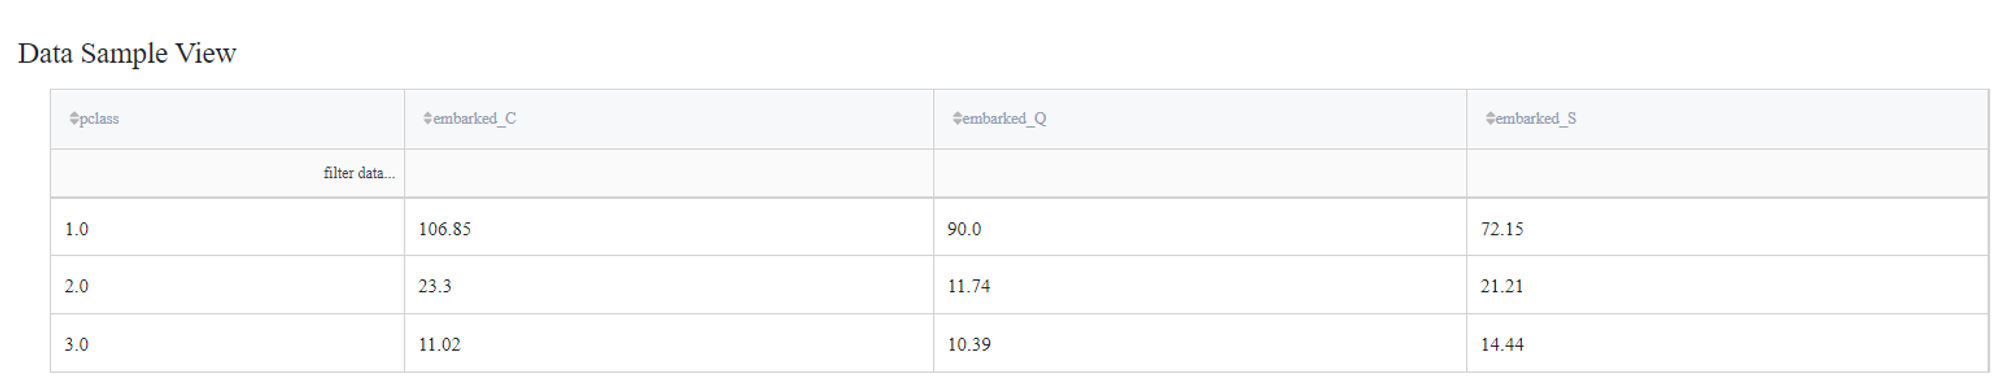
Using this report we can easily analyze at what price the tickets with different embarkation ports (C, Q, or S) and classes (from 1st to 3rd) were sold for Titanic passengers.
Additionally, in order to make the columns of the resulted data frame more self-explanatory, we can turn on the flag add operation to name and rerun the pipeline with the same parameters:
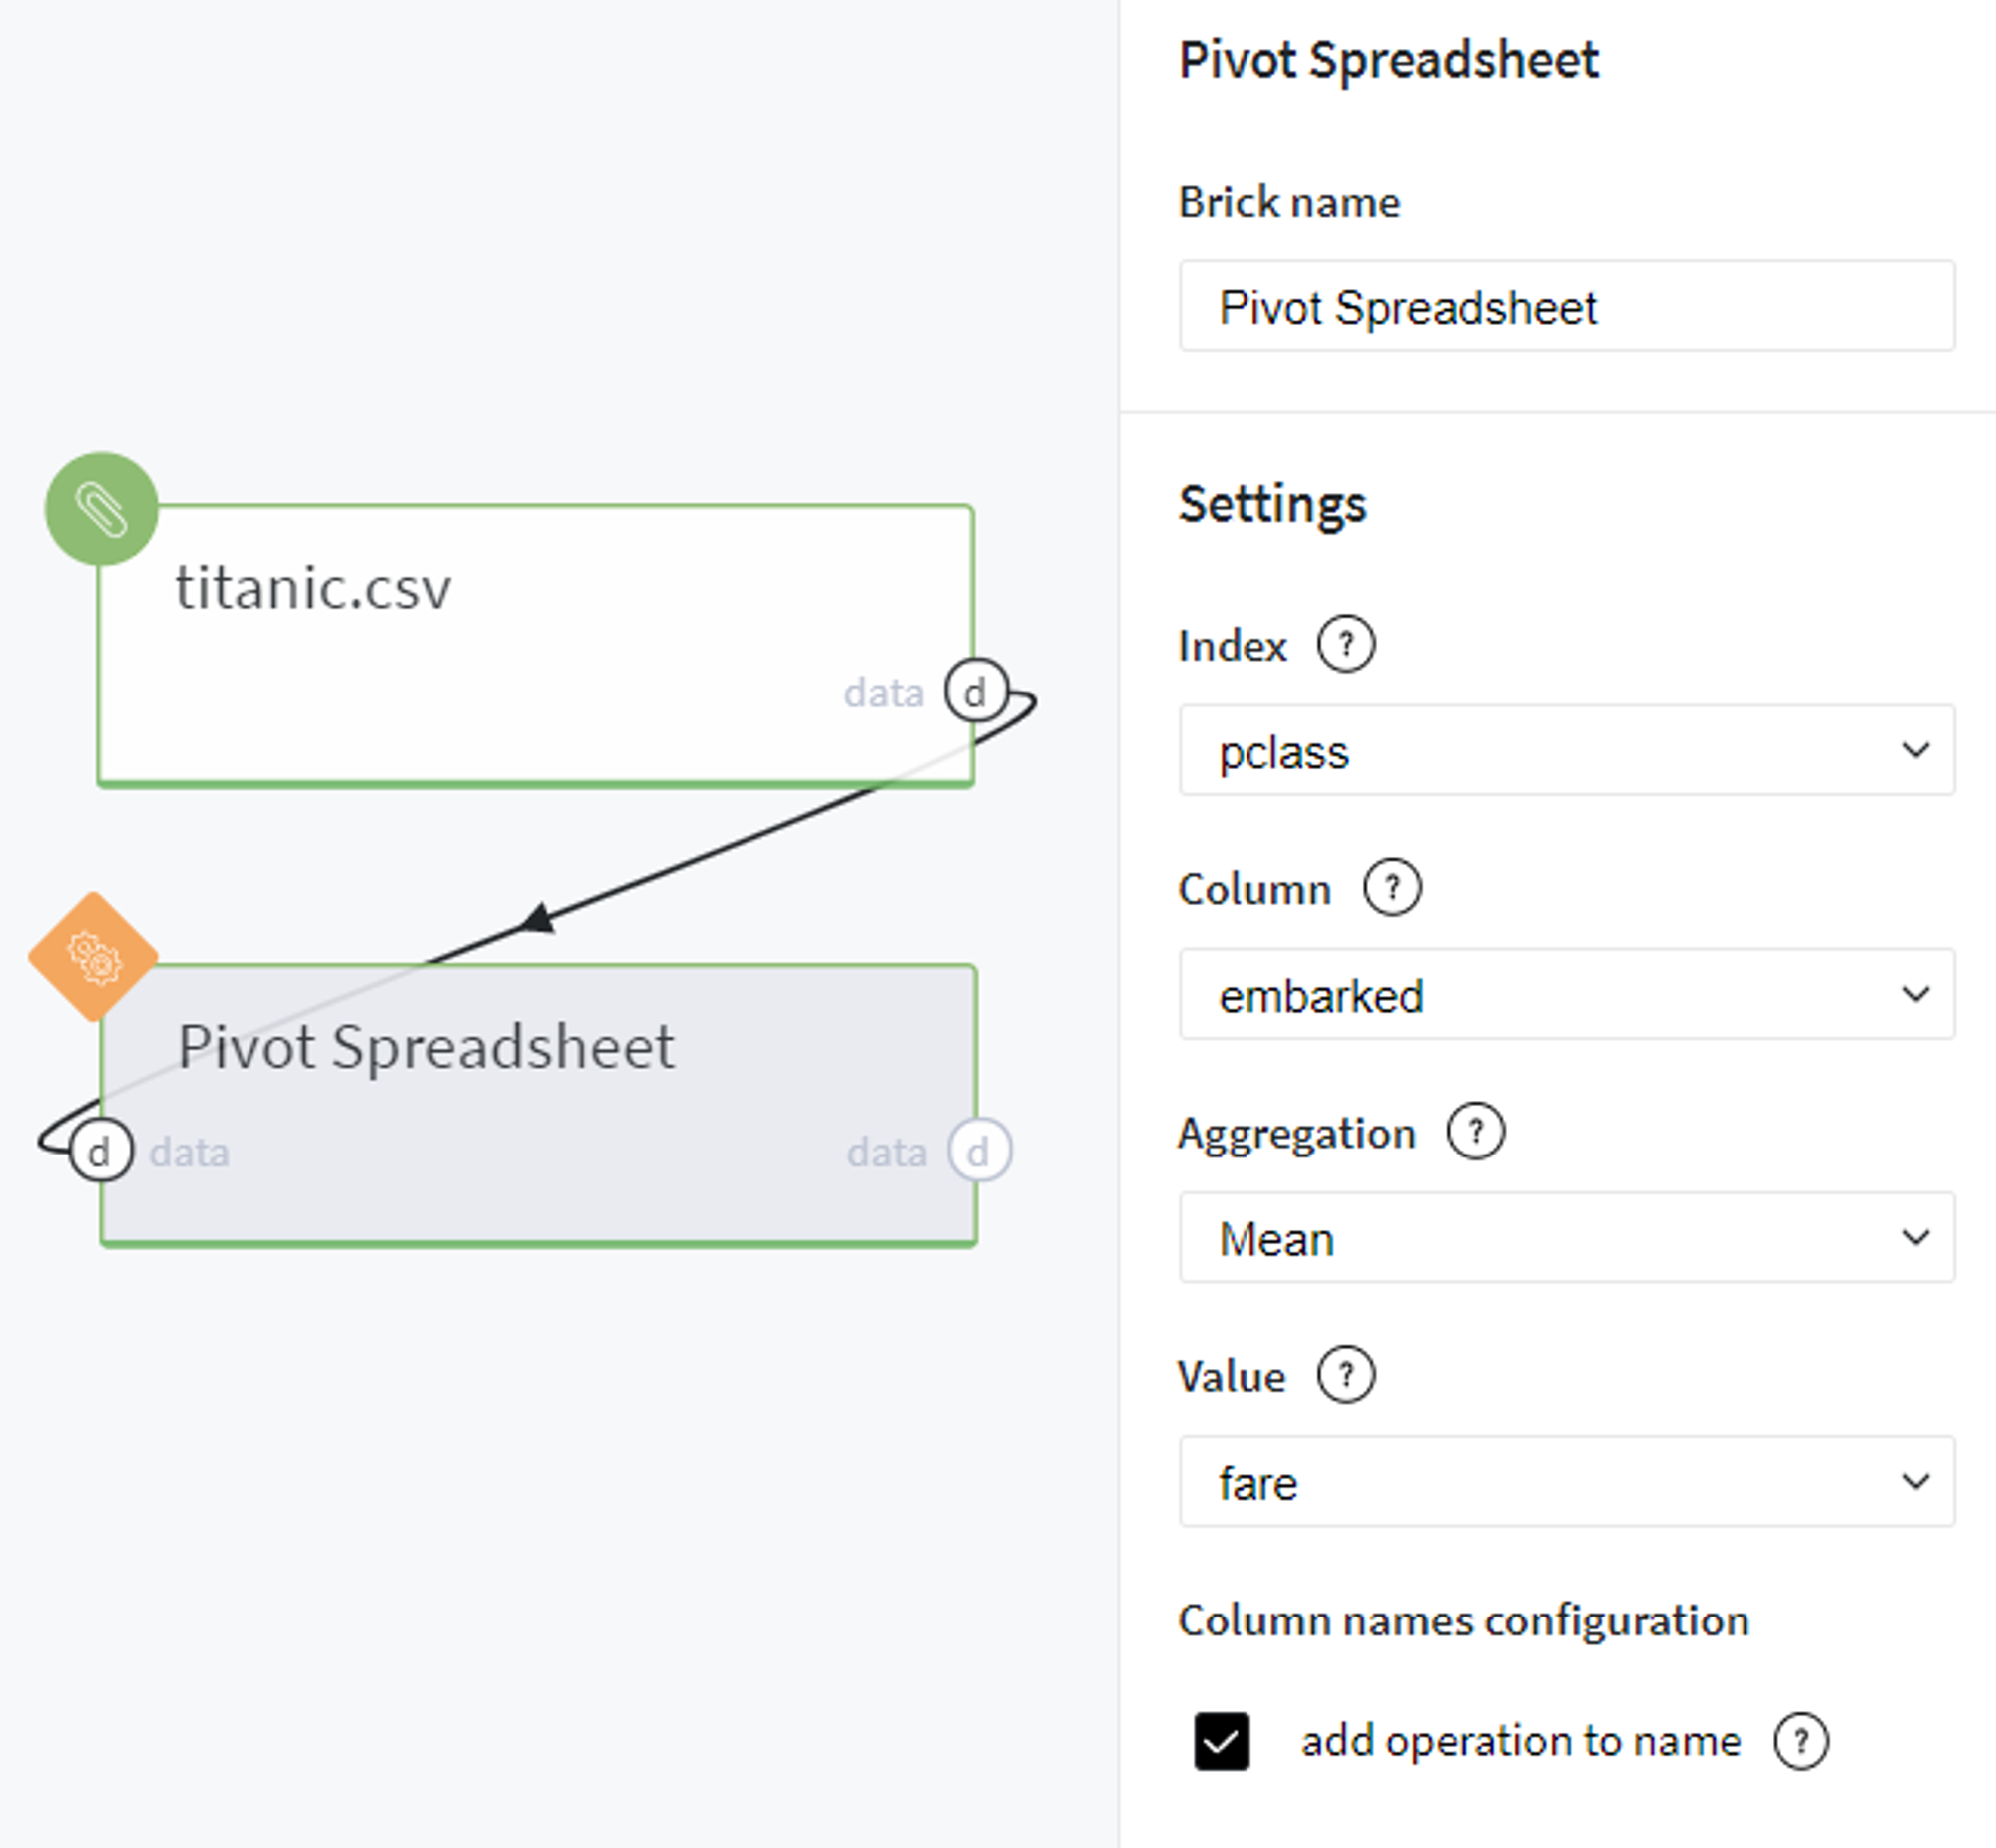
This will finally lead us to the following result:
Conversely to the previous table, here we can see the new label fare_Mean added for column names which gives us more intuition about the operation done with Value column and values presented in the cells.
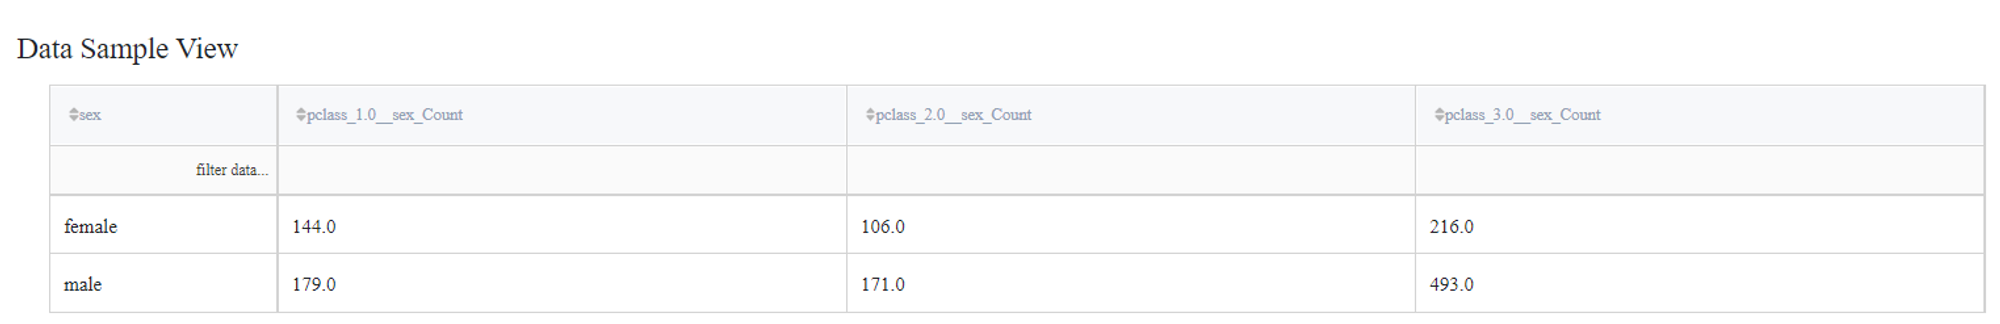
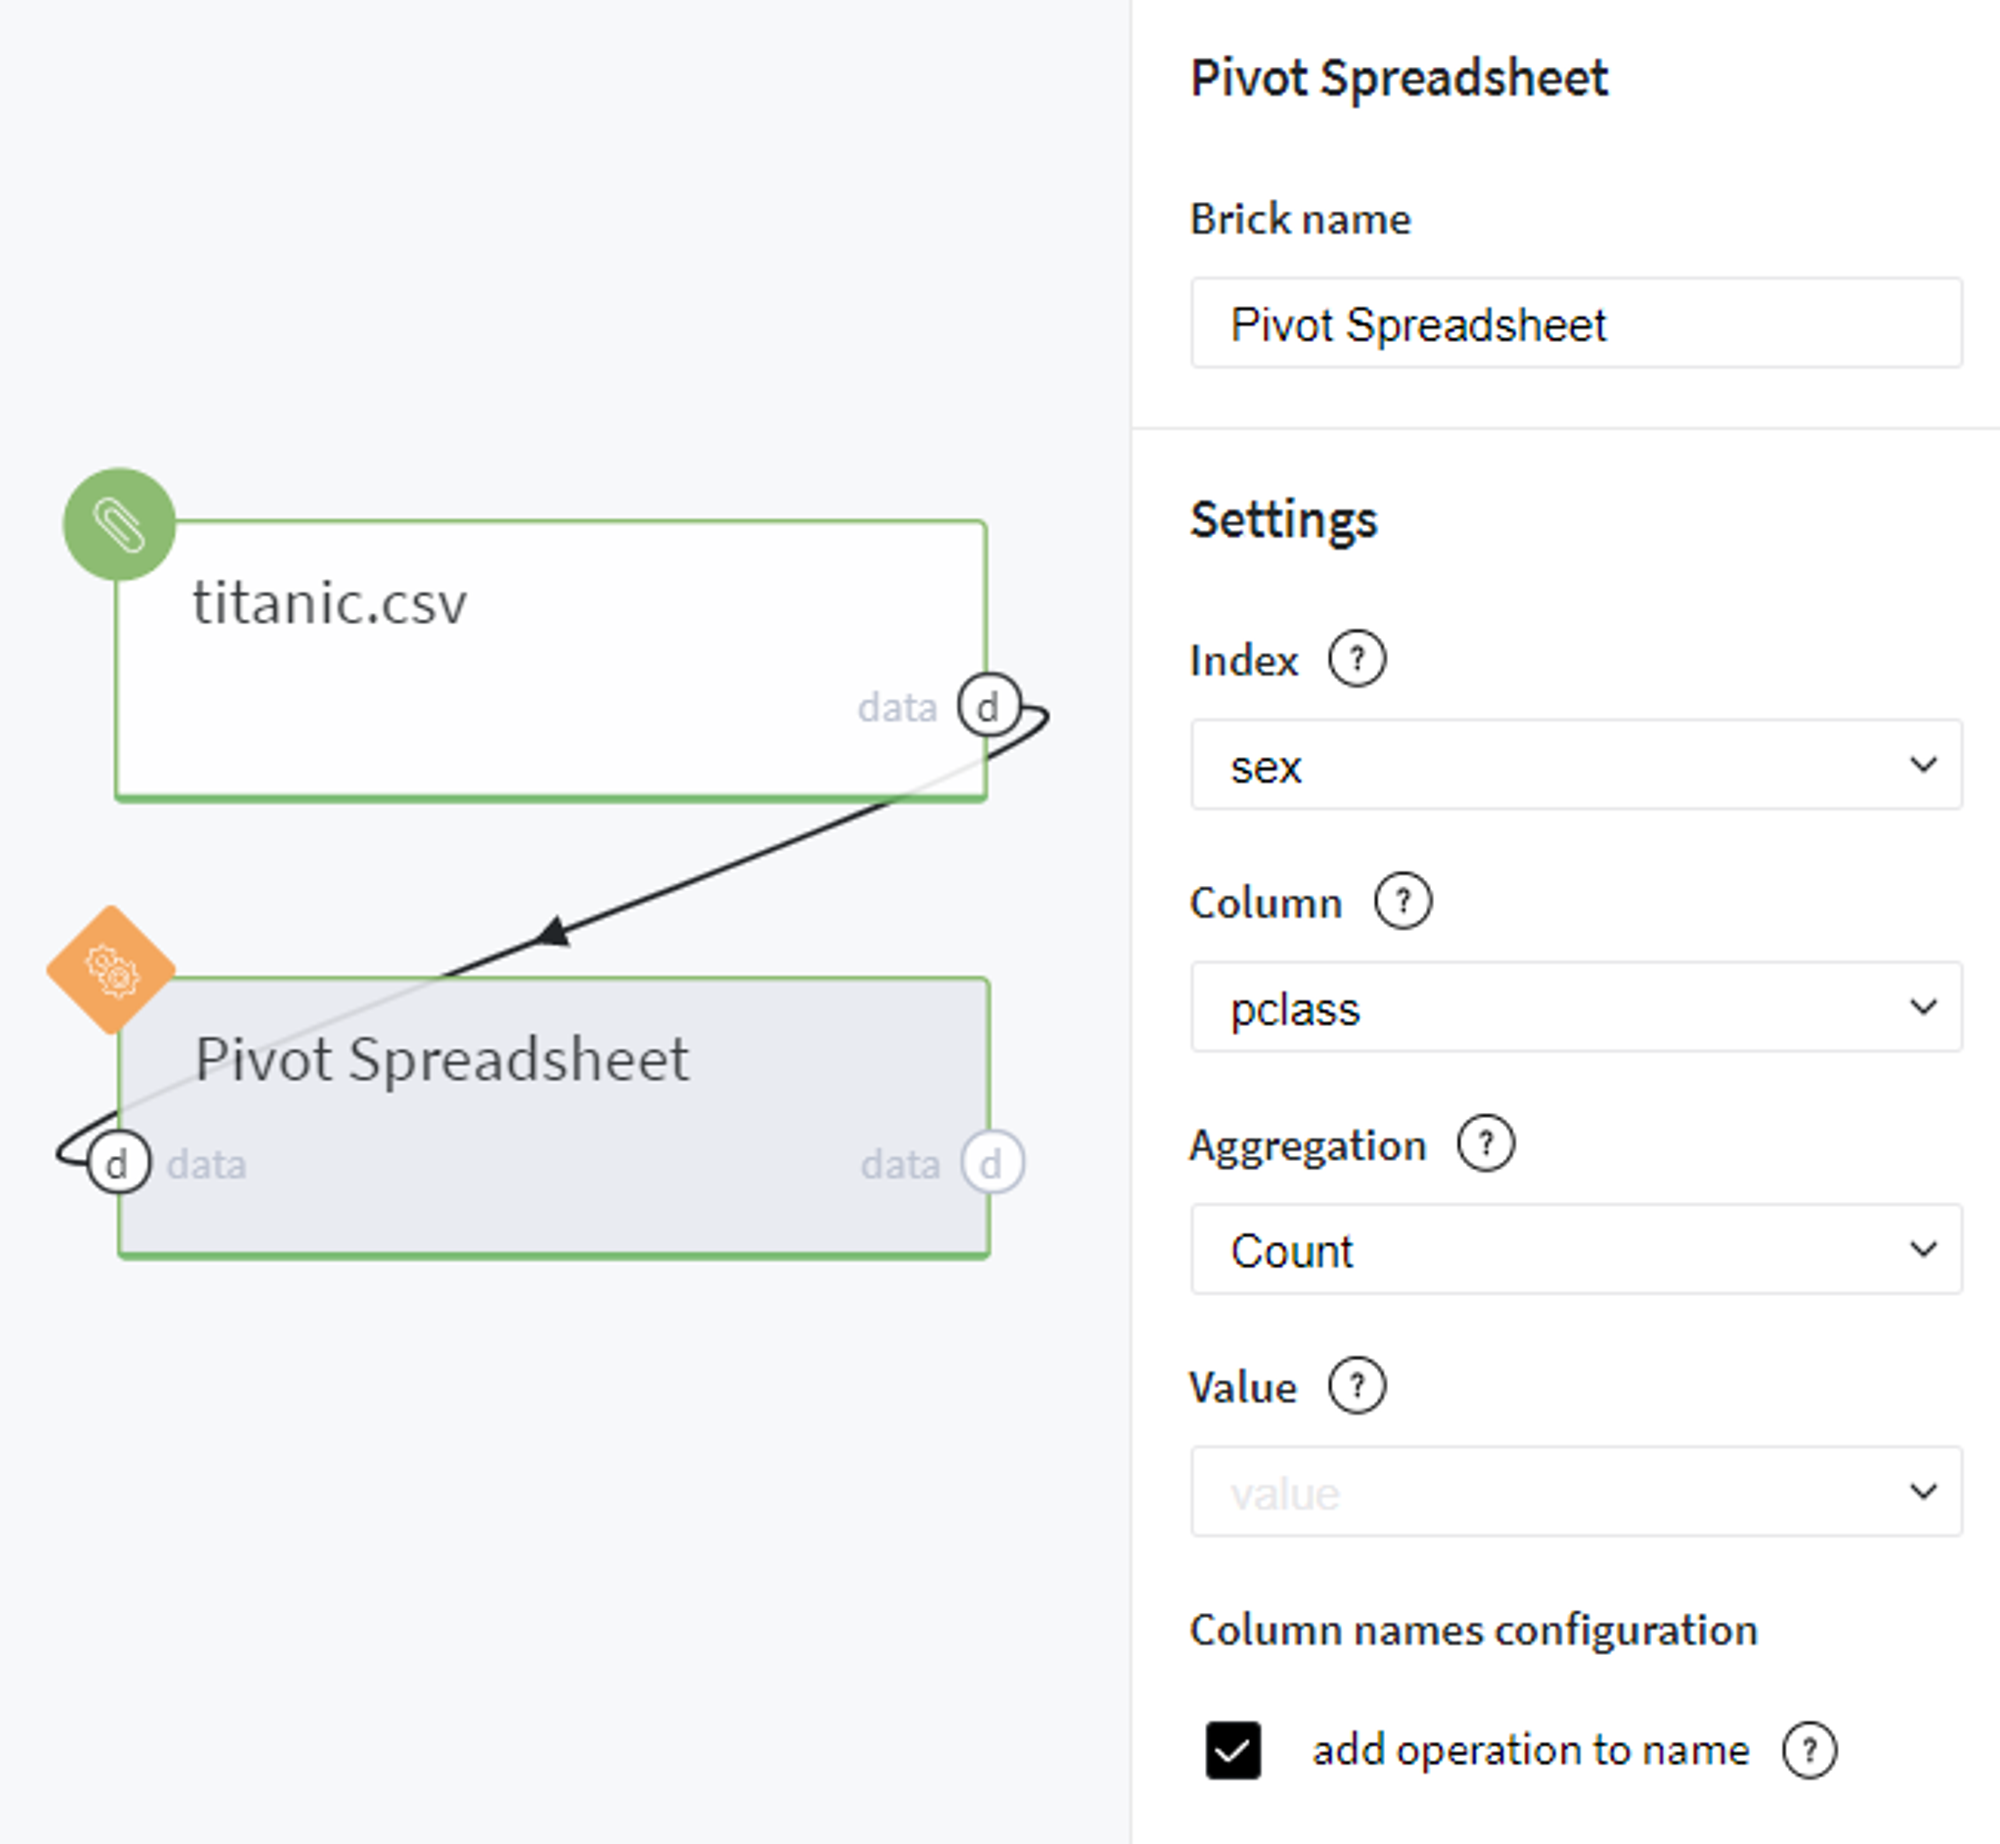
Let us experiment with another aggregation function and explore the gender distribution across different ticket classes.
For doing so, we define the brick parameters as shown on the right.
Here we use sex as Index, pclass as Column and Count as Aggregation.
Note, that since we need to get the count statistics across just 2 columns, we leave the field Value empty and run the pipeline.
Just for interest we also turn on the checkbox to specify operation in column names.
After this we receive the pivot table with the number of men and women with different ticket classes that were on board of the Titanic: