Description
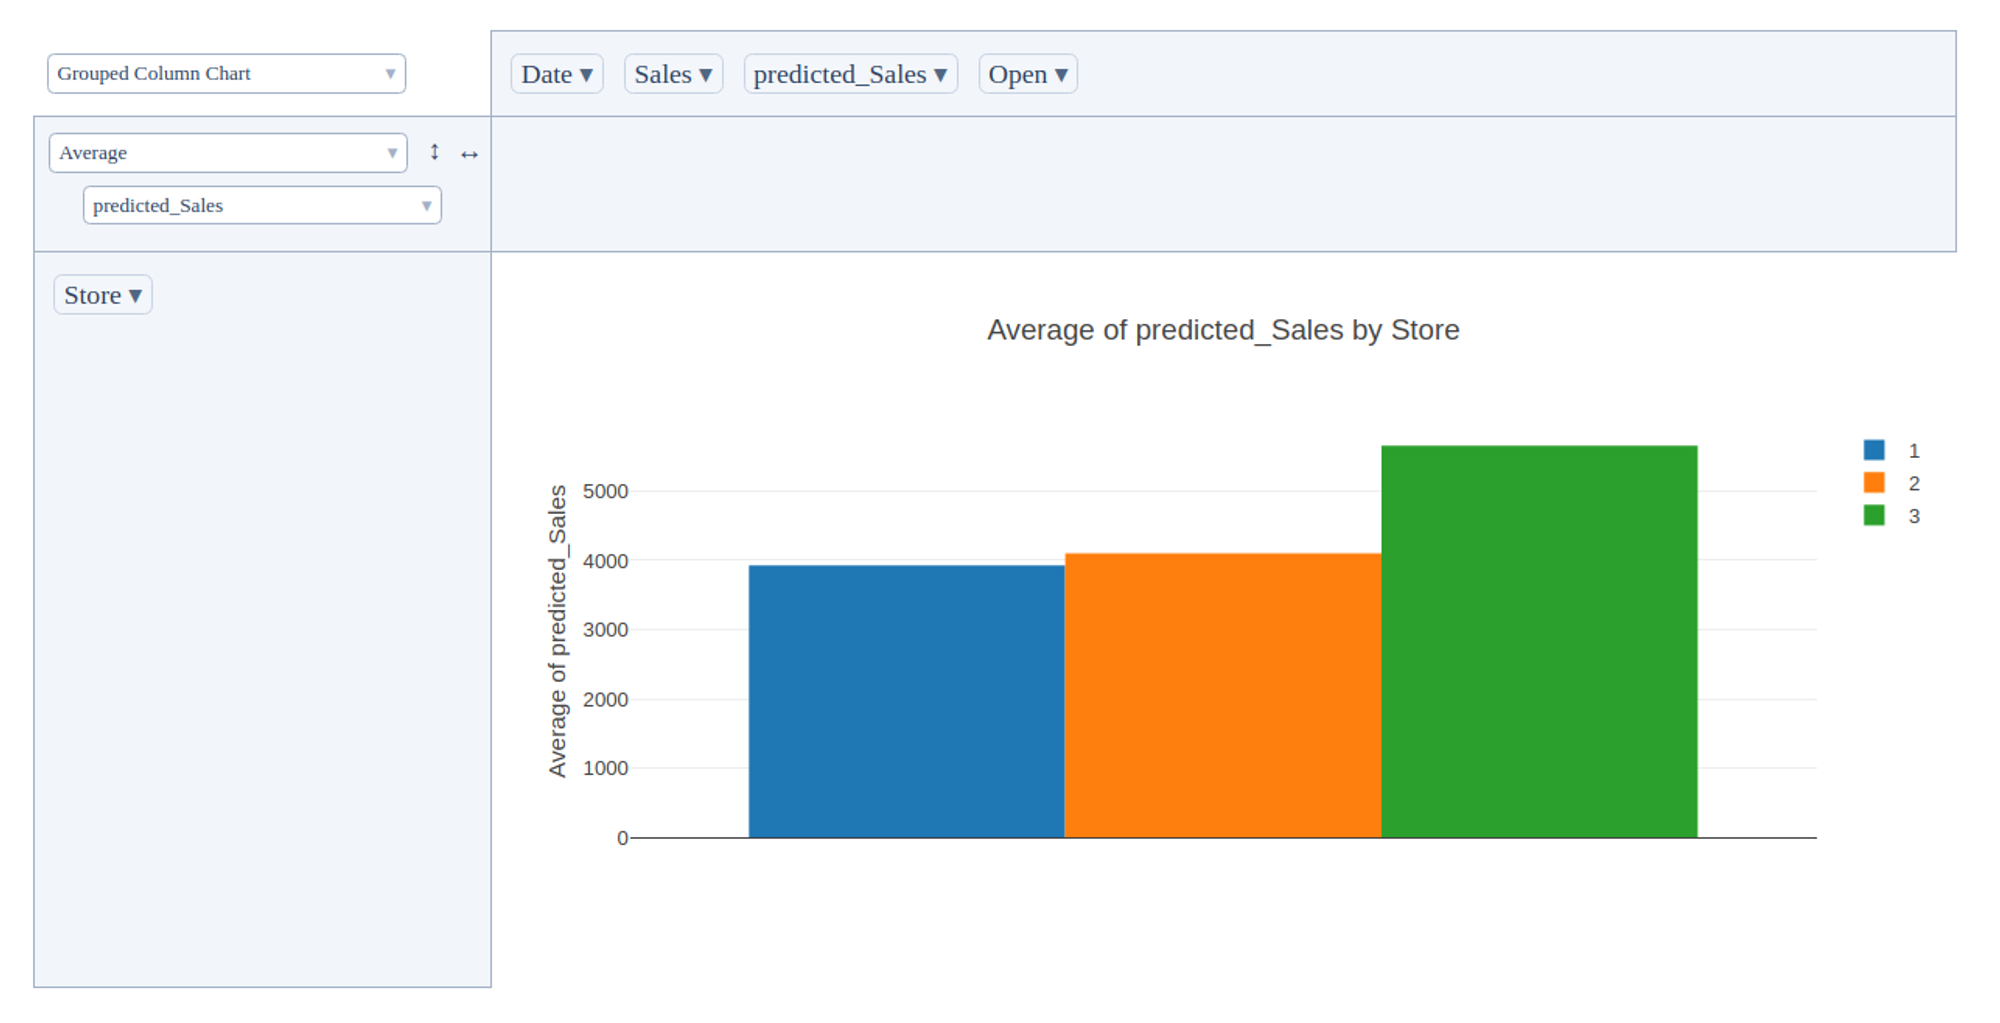
This brick is designed to build an interactive pivot table that summarizes and reorganizes selected columns and rows of data. This summary includes average, sum, count, standard deviation, and so on.
In addition, this brick supports multiple ways of visualization starting with regular tables and bar charts, ending with heatmap, pie, and line charts.
Use
First, you need to connect a dataset to the input of the bricks. Afterward, you will need to open a dashboard where you will be given a list of columns which then can be drag'n'dropped to be shown. Besides, you have access to several dropdowns to modify the way data is summarized and displayed.