General Information
XGBoost is an ensemble learning and a gradient boosting algorithm for decision trees that uses a second-order approximation of the scoring function. This approximation allows XGBoost to calculate the optimal “if” condition and its impact on performance. XGBoost can then store these in its memory in the next decision tree to save recomputing it.
While training, the XGBoost algorithm constructs a graph that examines the input under various “if” statements (vertices in the graph). Whether the “if” condition is satisfied influences the next “if” condition and eventual prediction. XGBoost progressively adds more and more “if” conditions to the decision tree to build a stronger model. By doing so, the algorithm increases the number of tree levels, therefore, implementing a level-wise tree growth approach.
XGBoost learns a model faster than many other machine learning models (especially among the other ensemble methods) and works well on categorical data and limited datasets.
This specific brick solves the classification task. If you need to solve a regression task, then you may be interested in the
Description
Brick Location
Bricks → Machine Learning → XGBoost Classification
Brick Parameters
General Parameters
- Prediction mode
- Class - get predictions as a single value of the 'closest' target class for each data point. Will create only one column with the "predicted_" prefix
- Probability of class - get the numerical probability of each class in a separate column.
This parameter specifies the model's prediction format of the target variable:
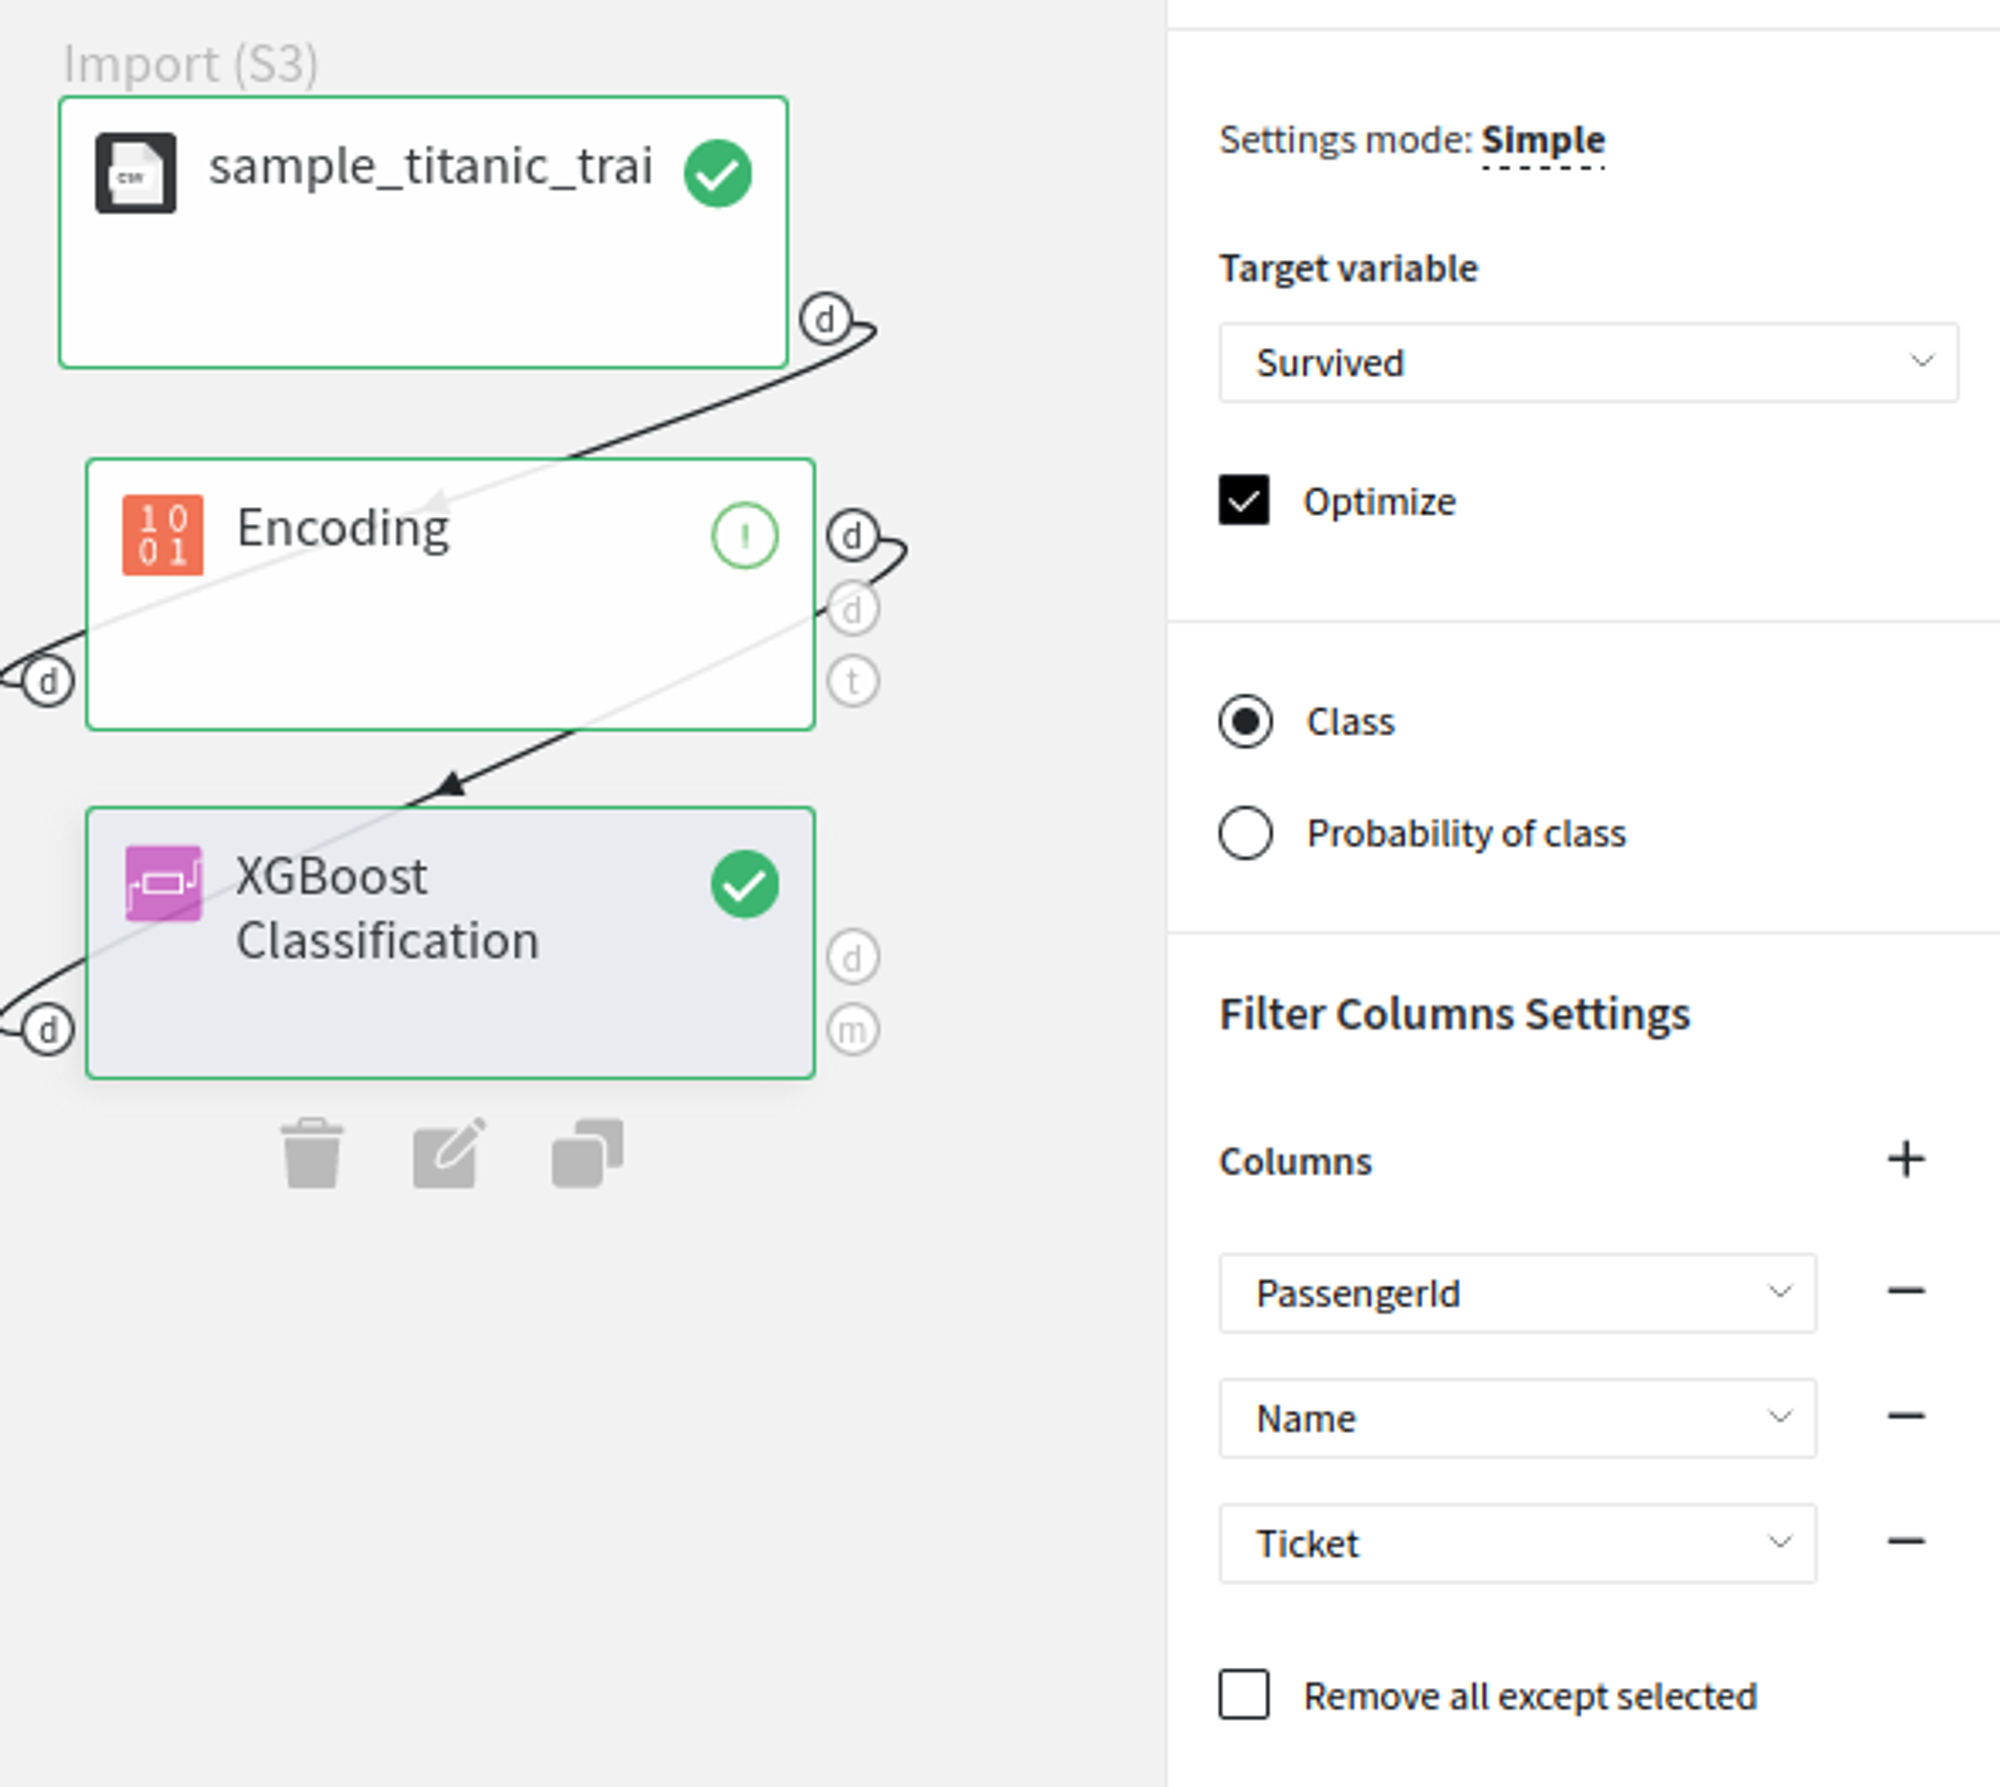
- Target Variable
The column that has the values you are trying to predict. Note that the column must contain exactly categorical values and no missing values, a corresponding error message will be given if done otherwise.
- Optimize
This checkbox enables the Bayesian hyperparameter optimization, which tweaks the learning rate, as well as the number of iterations and leaves, to find the best model's configuration in terms of metrics.
Be aware that this process is time-consuming.
- Filter Columns
If you have columns in your data that need to be ignored (but not removed from the data set) during the training process (and later during the predictions), you should specify them in this parameter. To select multiple columns, click the '+' button in the brick settings.
In addition, you can ignore all columns except the ones you specified by enabling the "Remove all except selected" option. This may be useful if you have a large number of columns while the model should be trained just on some of them.
Advanced Parameters
- Tree method
- exact - during each split finding procedure, it iterates over all entries of input data. It’s more accurate (among other greedy methods) but slow in computation performance. Useful for small datasets
- approx - approximate greedy algorithm using quantile sketch and gradient histogram. Useful for medium-large size datasets
- hist - faster histogram optimized approximate greedy algorithm. Useful for large and very large datasets
- auto - use heuristic to choose the fastest method, based on the dataset size and other selected hyperparameters
The tree construction algorithm. Supports next options:
- Learning rate
Boosting learning rate. This parameter controls how quickly or slowly the algorithm will learn a problem. Generally, a bigger learning rate will allow a model to learn faster while a smaller learning rate will lead to a more optimal outcome.
- Number of boosted iterations
A number of boosting iterations. This parameter is recommended to be set inversely to the learning rate selected (decrease one while increasing second).
- Gamma
Minimum loss reduction required to make a further partition on a leaf node of the tree. The larger this parameter is, the more conservative the algorithm will be.
- Maximum depth
Maximum depth of a tree. Increasing this value will make the model more complex and more likely to overfit
- Subsample ratio
Subsample ratio of the training instances. Setting it to 0.5 means that XGBoost would randomly sample half of the training data prior to growing trees. and this will prevent overfitting. Subsampling will occur once in every boosting iteration.
- Column subsample ratio per tree
Is the subsample ratio of columns when constructing each tree. Subsampling occurs once for every tree constructed.
- Column subsample ratio per level
Is the subsample ratio of columns for each level. Subsampling occurs once for every new depth level reached in a tree. Columns are subsampled from the set of columns chosen for the current tree.
- Column subsample ratio per node
Is the subsample ratio of columns for each node (split). Subsampling occurs once every time a new split is evaluated. Columns are subsampled from the set of columns chosen for the current level.
- L1 Regularization
L1 regularization term on weights. Increasing this value will make model more conservative.
- L2 Regularization
L2 regularization term on weights. Increasing this value will make model more conservative.
Brick Inputs/Outputs
- Inputs
Brick takes the data set with a categorical target column.
- Outputs
- Data - modified input data set with added columns for predicted classes or classes' probability
- Model - trained model that can be used in other bricks as an input
Brick produces two outputs as the result:
Additional Features
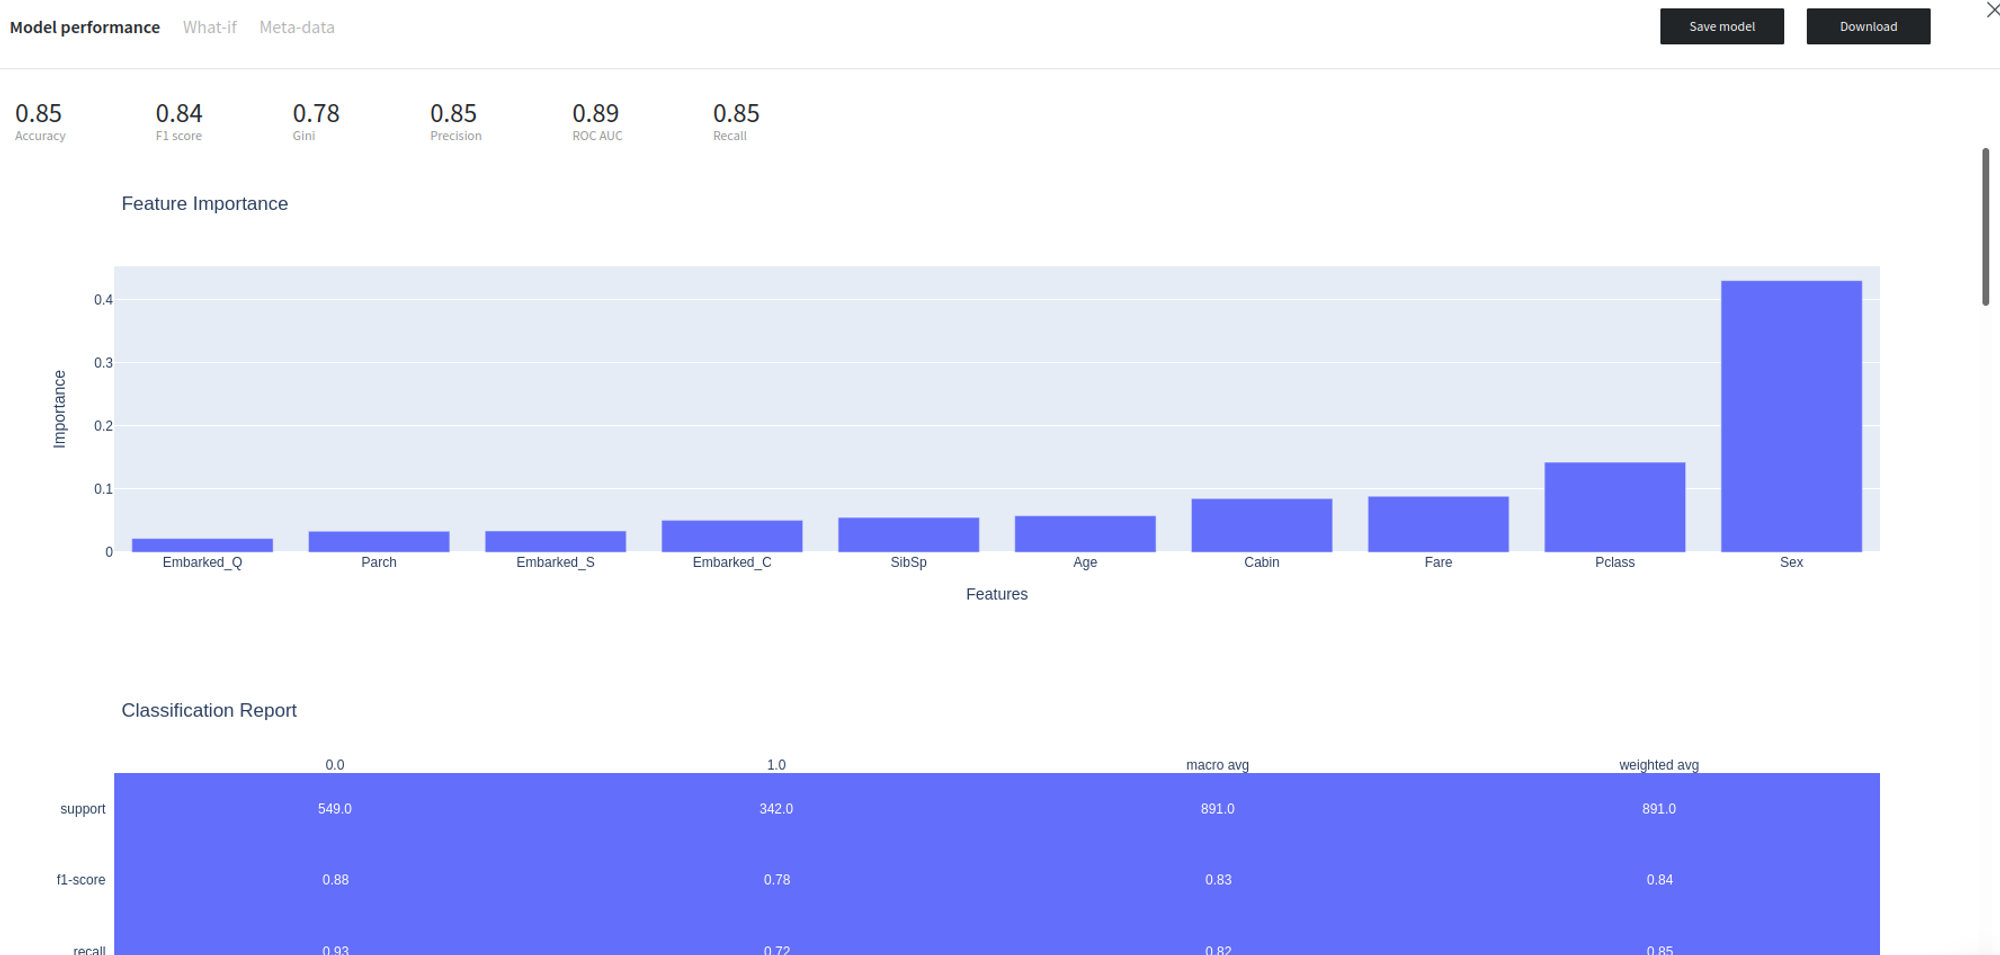
- Model Performance
This button (located in the 'Model Info' section) gives you a possibility to check the model's performance (a.k.a. metrics) to then adjust your pipeline if needed.
Supported metrics: accuracy, precision, recall, f1-score, ROC AUC, Gini.
Also give provides numerous performance charts to better understand model’s results
- Save model asset
This option provides a mechanism to save your trained models to use them in other projects. For this, you will need to specify the model's name or you can create a new version of an already existing model (you will need to specify the new version's name).
- Download model asset
Use this feature, if you want to download model's asset to use it outside Datrics platform.
Example of usage
Let's consider the binary classification problem :
The inverse target variable takes two values - survived (0) - good or non-event case / not-survived (1) - bad or event case. The general information about predictors is represented below:
- passengerid (category/int) - ID of passenger
- name (category/string) - Passenger's name
- pclass (category/int) - Ticket class
- sex (category/string) - Gender
- age (numeric) - Age in years
- sibsp (numeric) - Number of siblings / spouses aboard the Titanic
- parch (category/int) - Number of parents / children aboard the Titanic
- ticket (category/string) - Ticket number (contains letters)
- fare (numeric) - Passenger fare
- cabin (category/string) - Cabin number (contains letters)
- embarked (category/string) - Port of Embarkation
Some of the data columns are strings, which is not a supported data format for LGBM Binary classifier. While the name column can be discarded, other ones contain some useful information, so we will need to encode them the next way:
- embarked - one-hot
- cabin - label
- sex - binary
In addition, passengerId, ticket and name do not contain useful information, so they will be filtered out.
Executing regular pipeline
Next steps would be made to build simple test pipeline:
- First, drag'n'drop titanic.csv file from Storage→Samples folder, Encoding brick from Bricks →Transformation, as well as XGBoost Classification from Bricks → Machine Learning
- Connect the data set to Encoding brick, set it up accordingly to the previous section and then connect to the XGBoost Classification model
- Select XGBoost Classification, choose either Class or Probability of class mode, specify the target variable (Survived column) and columns to filter (you can add several of them by pressing the '+' symbol)
- Check the Optimize option if you like
- Run pipeline
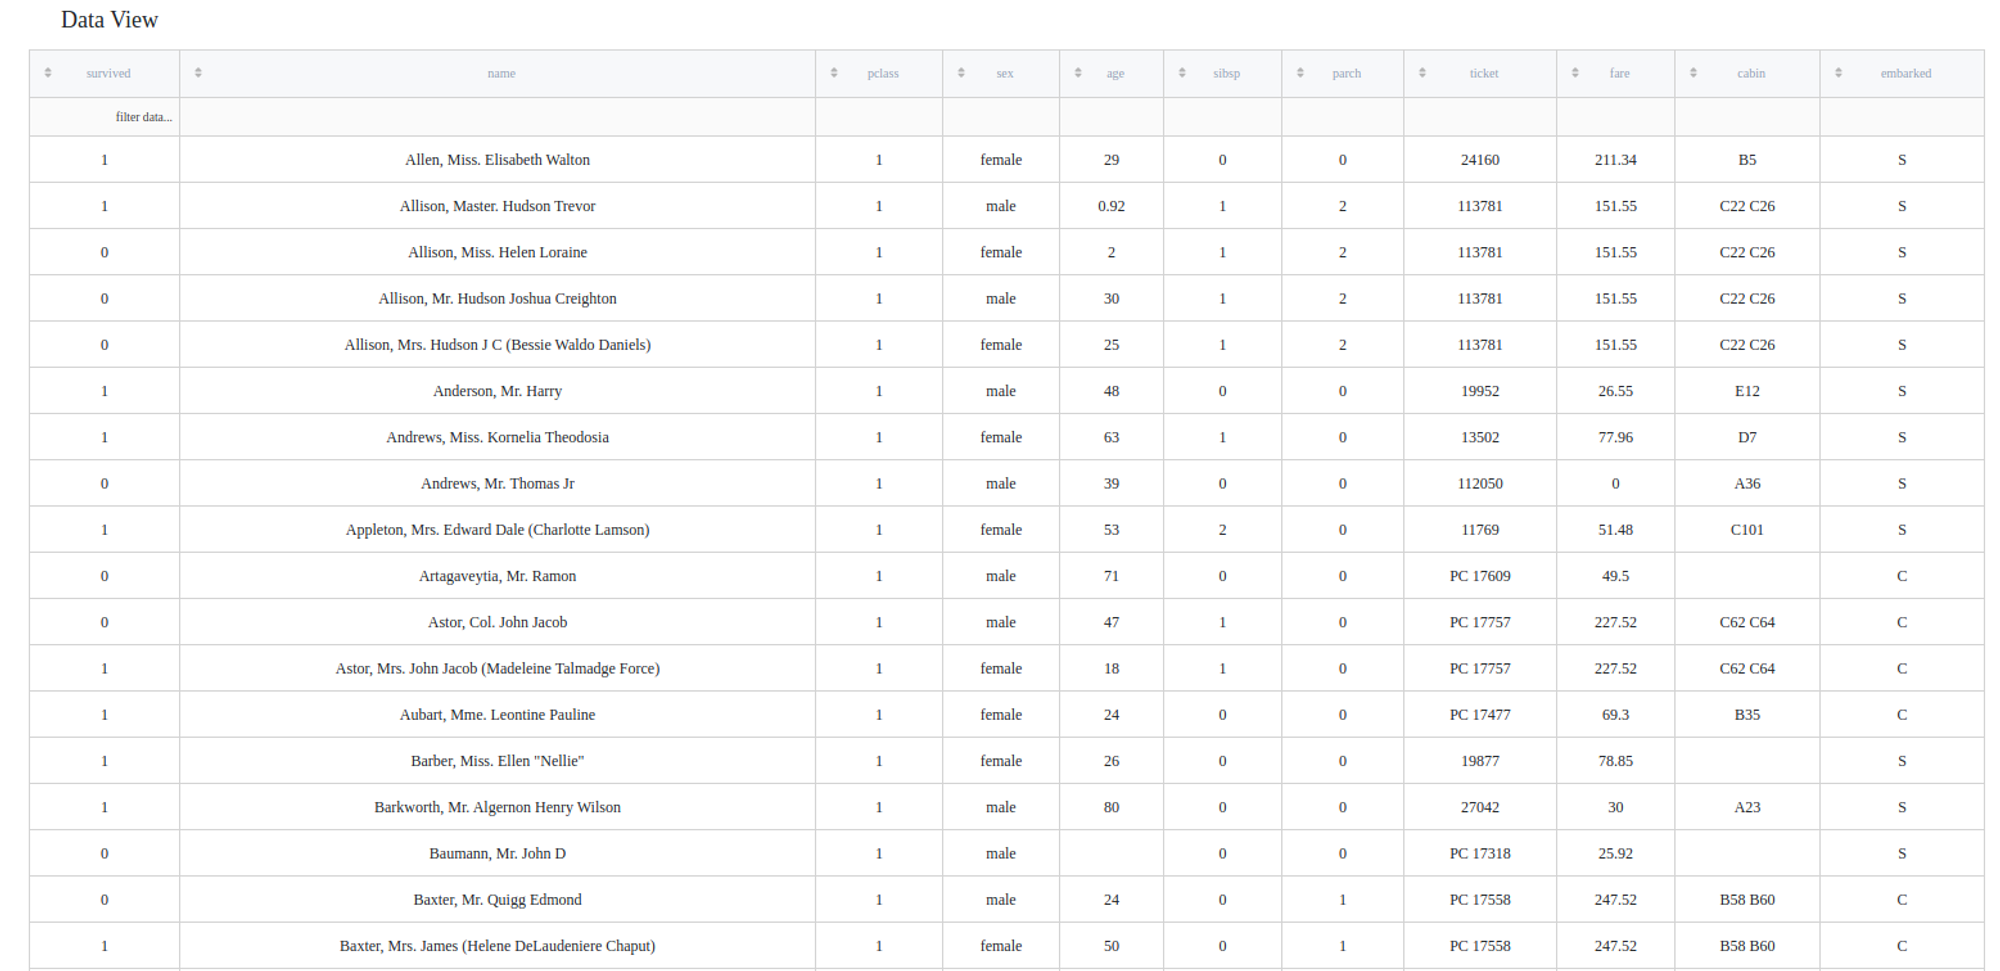
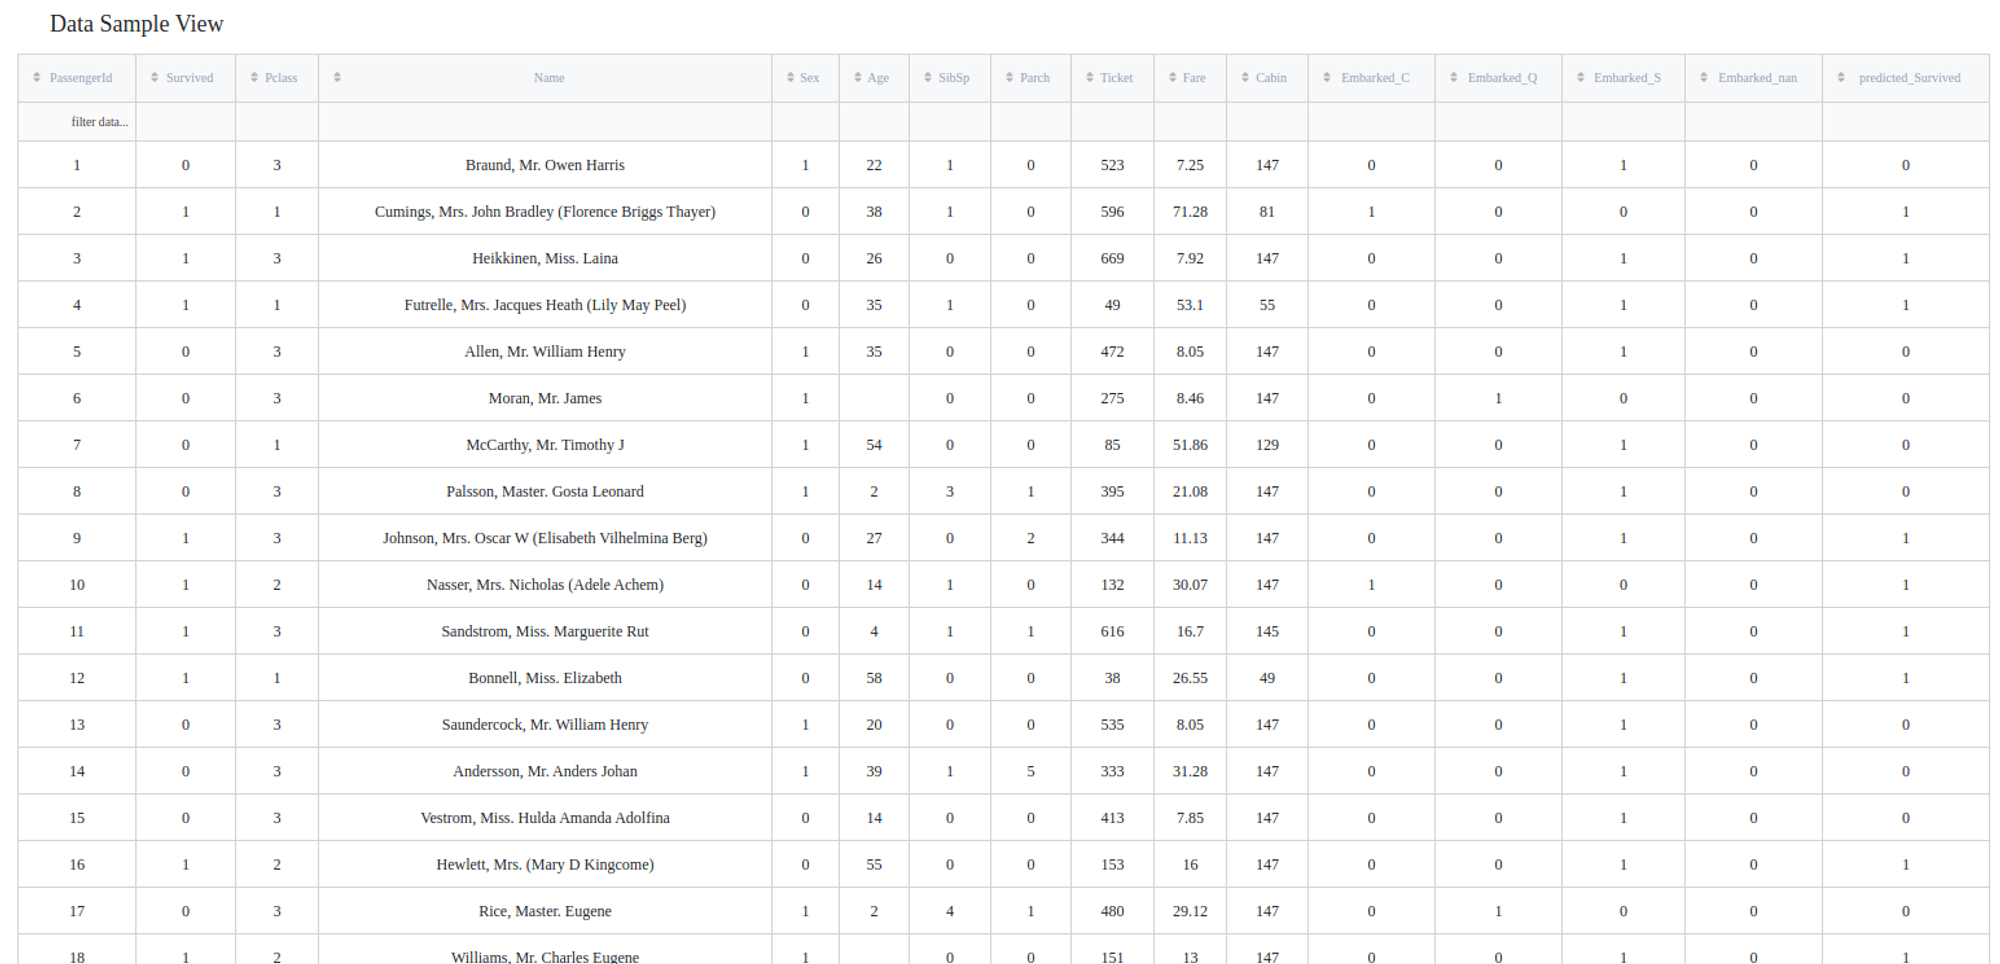
In order to see the processed data with new columns, you should open the Output data previewer on the right sidebar.
The results are depicted in the table:
To see the model's performance just choose the corresponding option in the Model Info section: