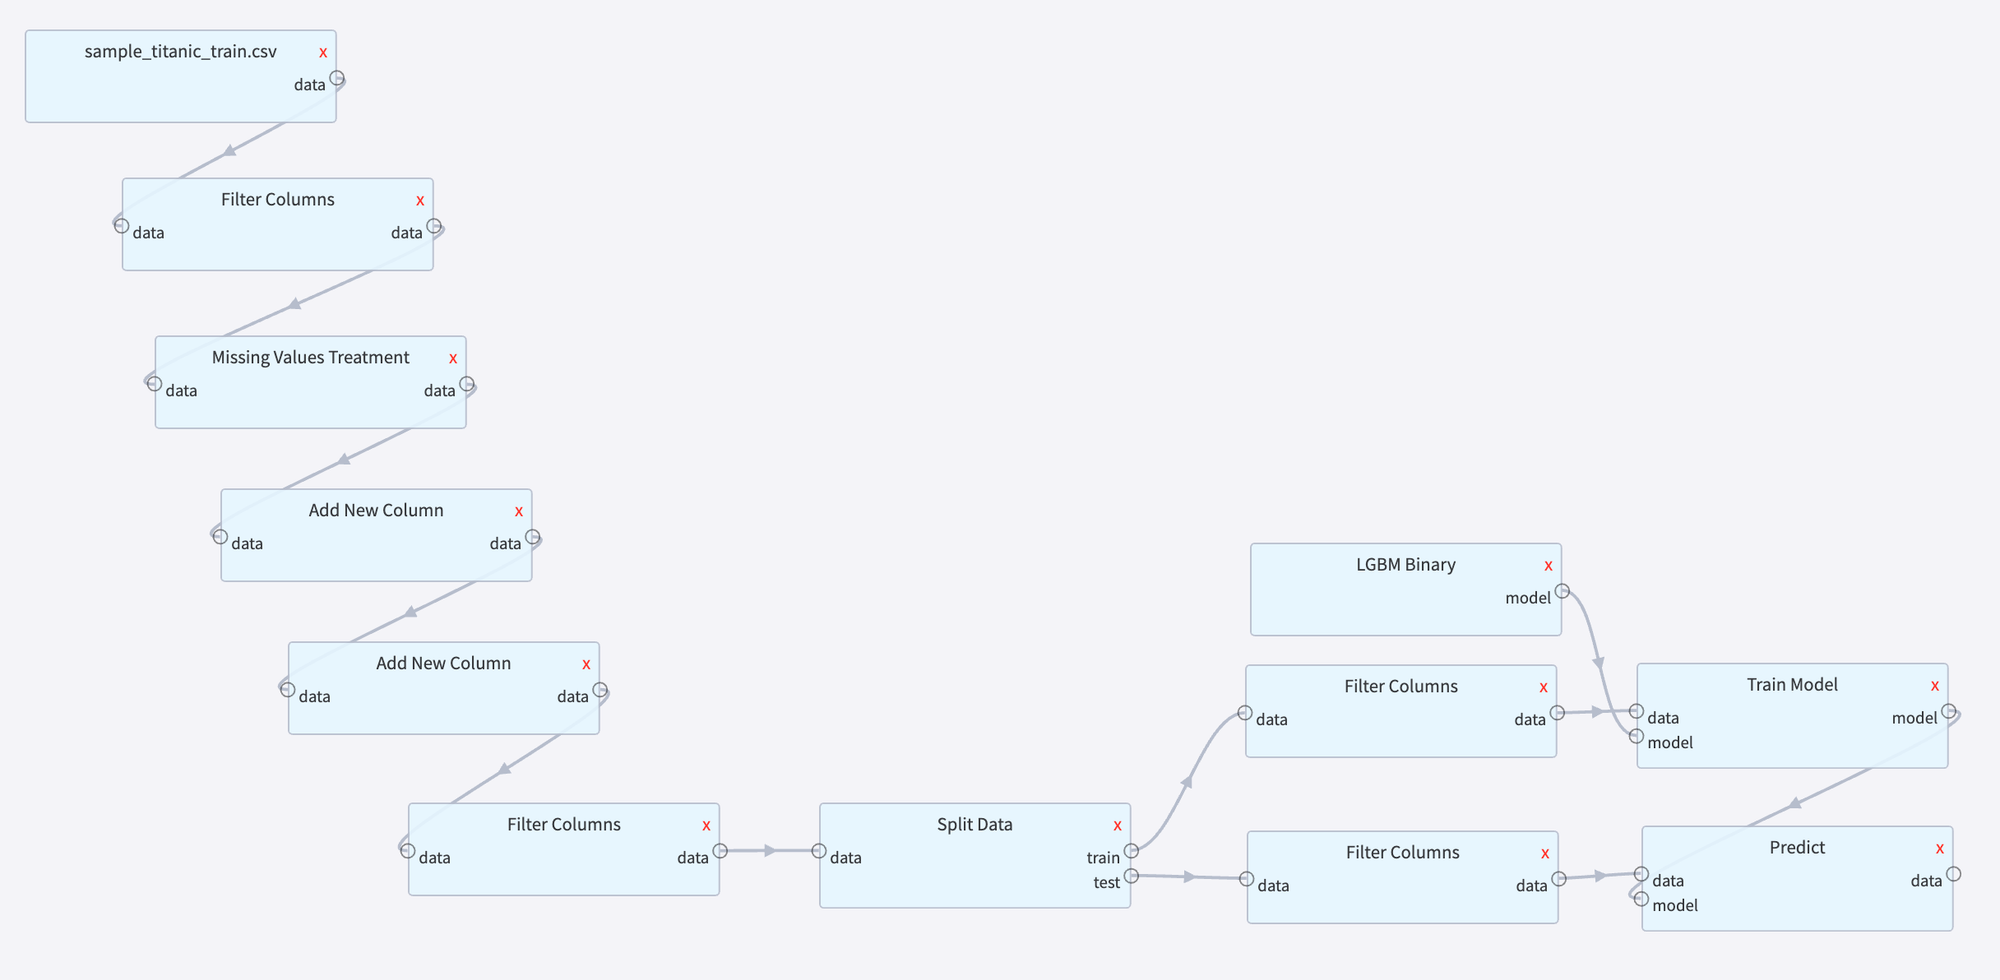
Pipeline for solving classical binary classification problem - Titanic passengers survival prediction. This pipeline demonstrates the applying data processing and machine learning scenario to create a model that assesses which passengers are more likely to survive the Titanic shipwreck.
Problem Statement
Based on the information about the Titanic's passengers, predict if a particular passenger survived the Titanic shipwreck or not.
Dataset
Titanic Passengers public dataset, which contains 891 records about the Titanic's passengers with the expected outcome for each passenger (survived or not)
Use sample_titanic_train.csv form Datrics Storage→Samples.
Feature Engineerings
First of all, we need to describe each object in our dataset via a set of informative features - features that have good predictive abilities. For this purpose, we perform the analysis of input data in order to understand which features do not bring useful information for further analysis and modeling, highlight and make a decision regarding incomplete data problem solving and represent some features in the more appropriate view:
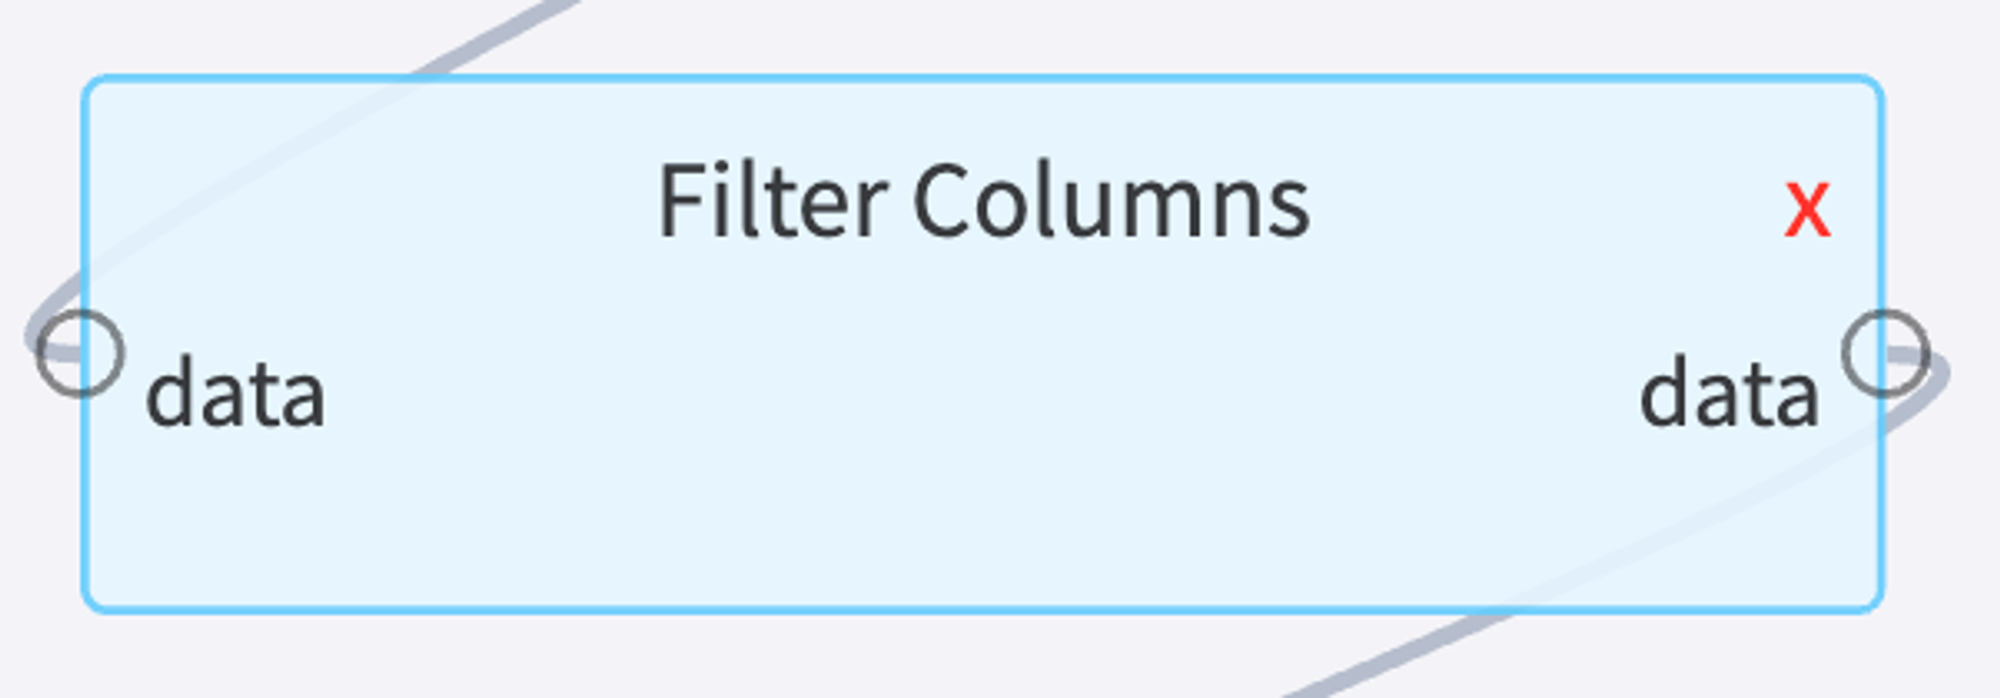
Remove non-informative columns - column with a very high index of missing values, filled with some constant value, or with a very high ratio of unique values (like name, or user ID).
In our case we remove passengers' names, IDs, and tickets, because they identify particular passengers, but not their general specific with respect to the target variable.
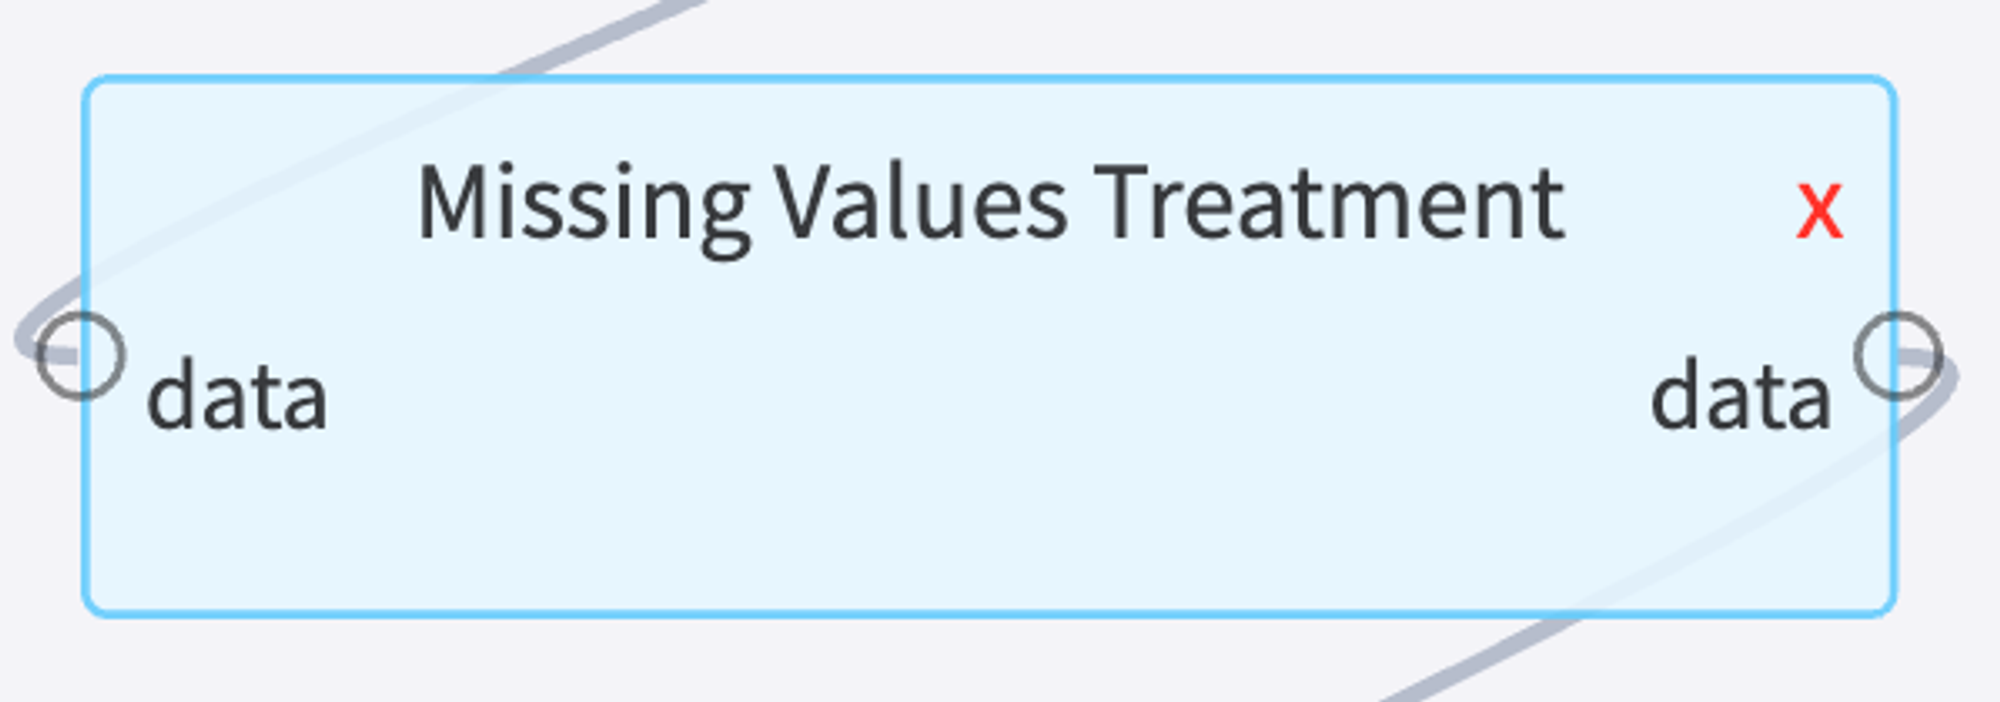
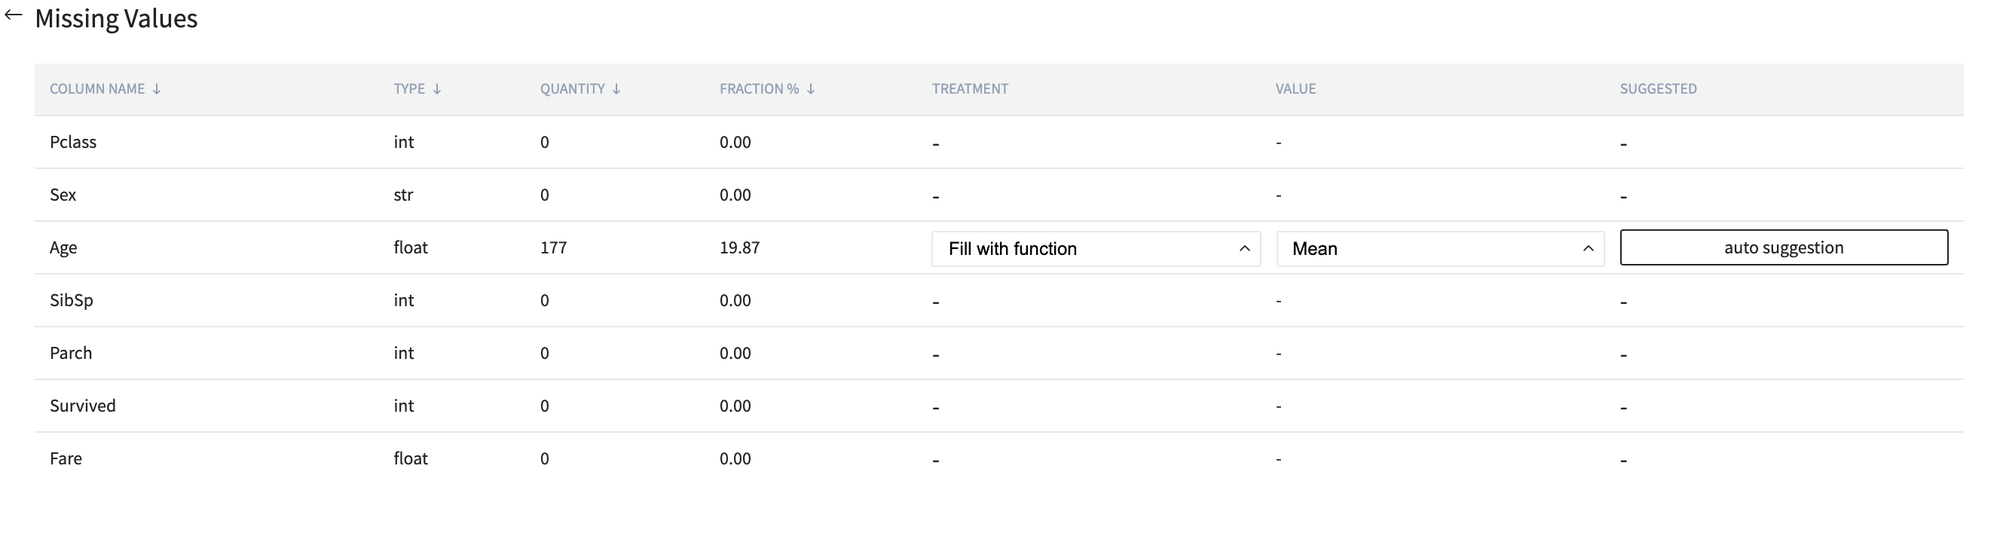
Data Imputation - missing values treatment - replacement empty cells with the most appropriate value with respect to the data distribution
As we can see, there is only attribute with missing values - Age. One of the most appropriate ways for missing value treatment for this kind of variable - to use mean calculated on input sampling.
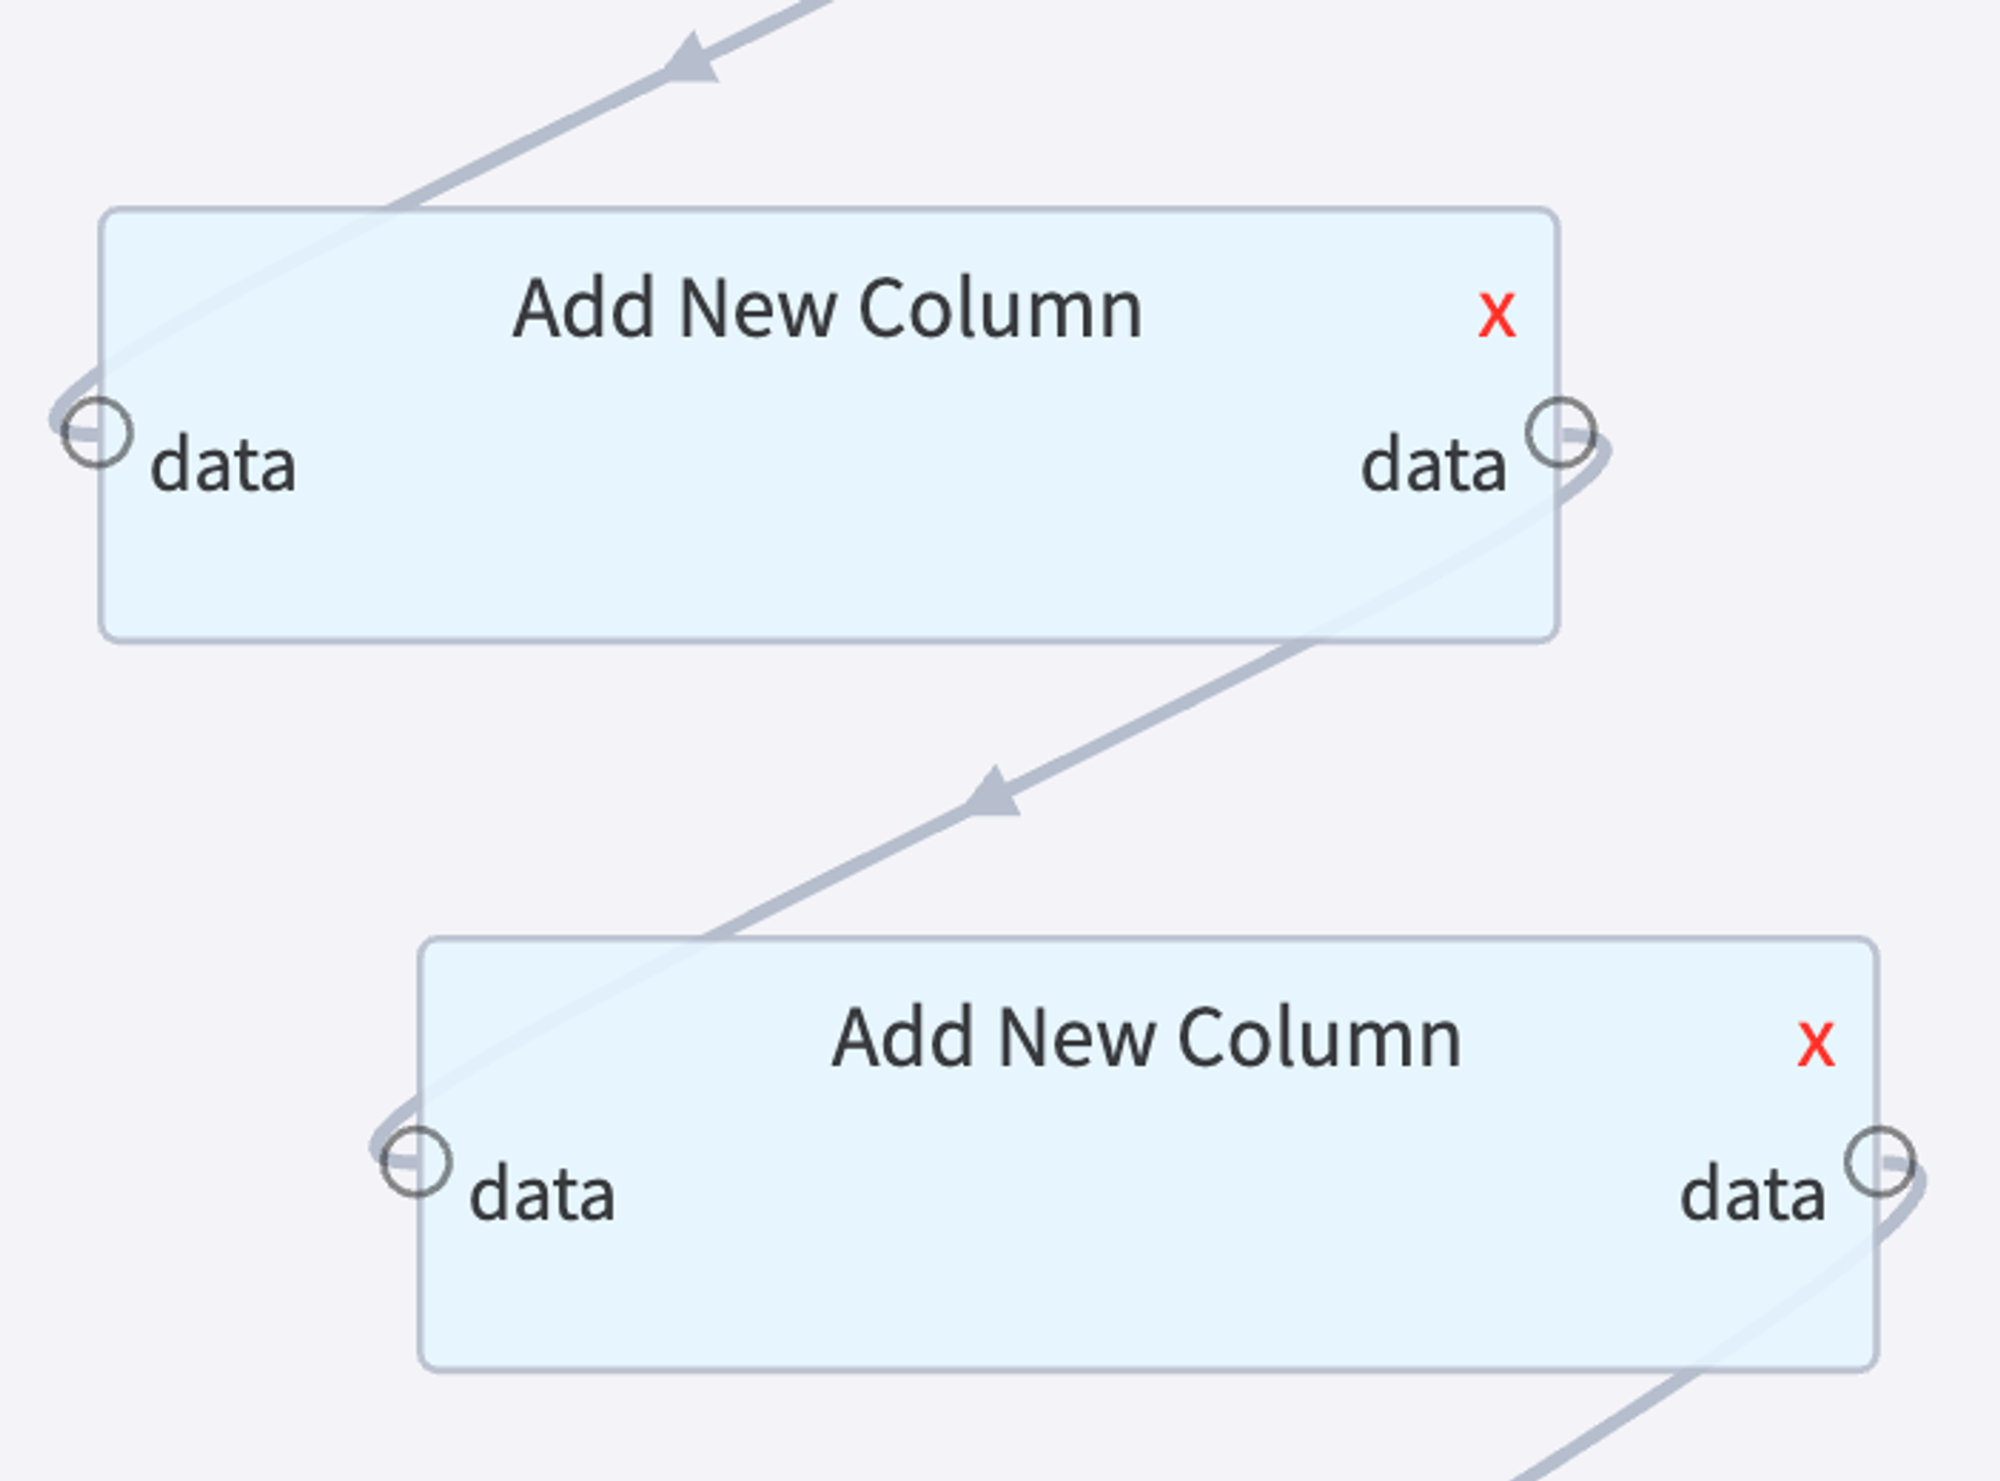
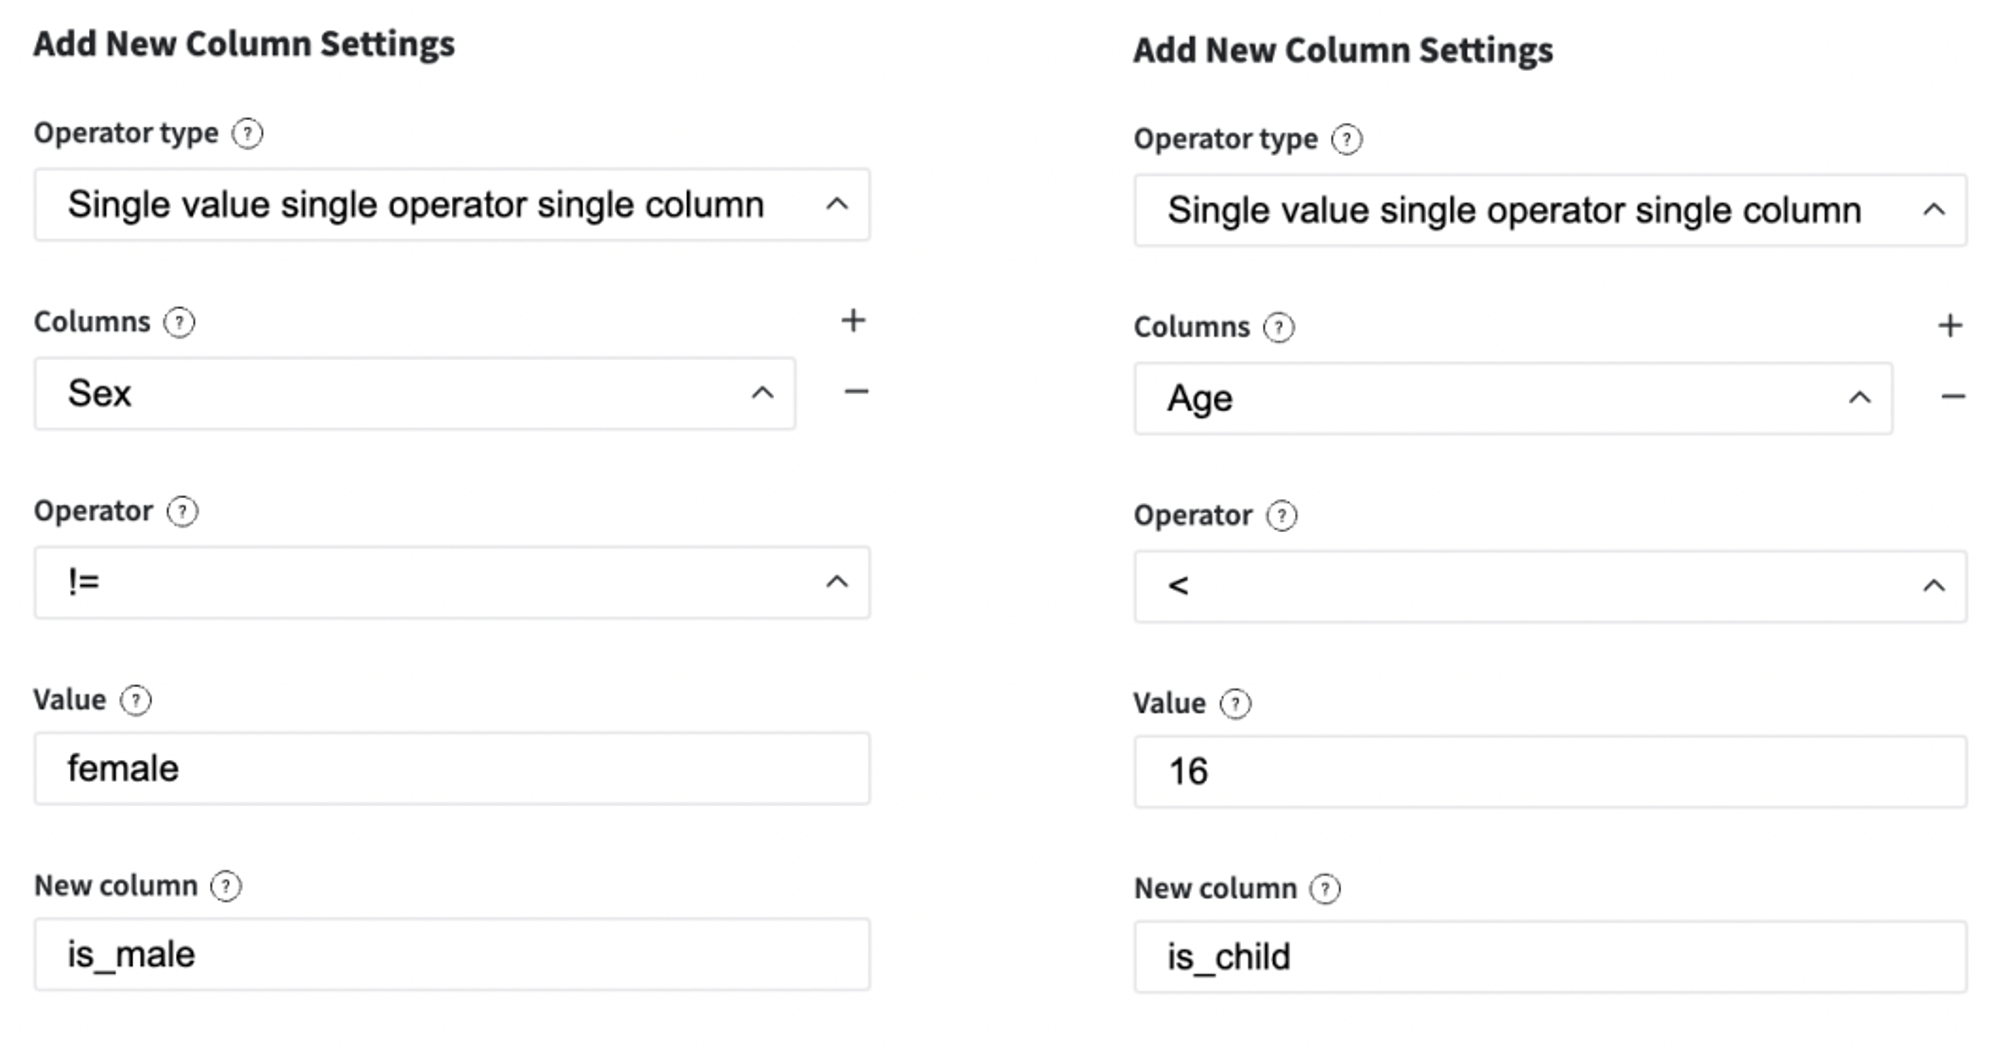
Feature Transformation - change feature values and/or derivite new features
First of all, we should transform the "Sex" variable to the binary view, because it's the most suitable for most machine learning models. In addition, we introduce a new feature - "is_child", which is used for the correct stratified sampling, because the initial sampling is biased to the side of adults.
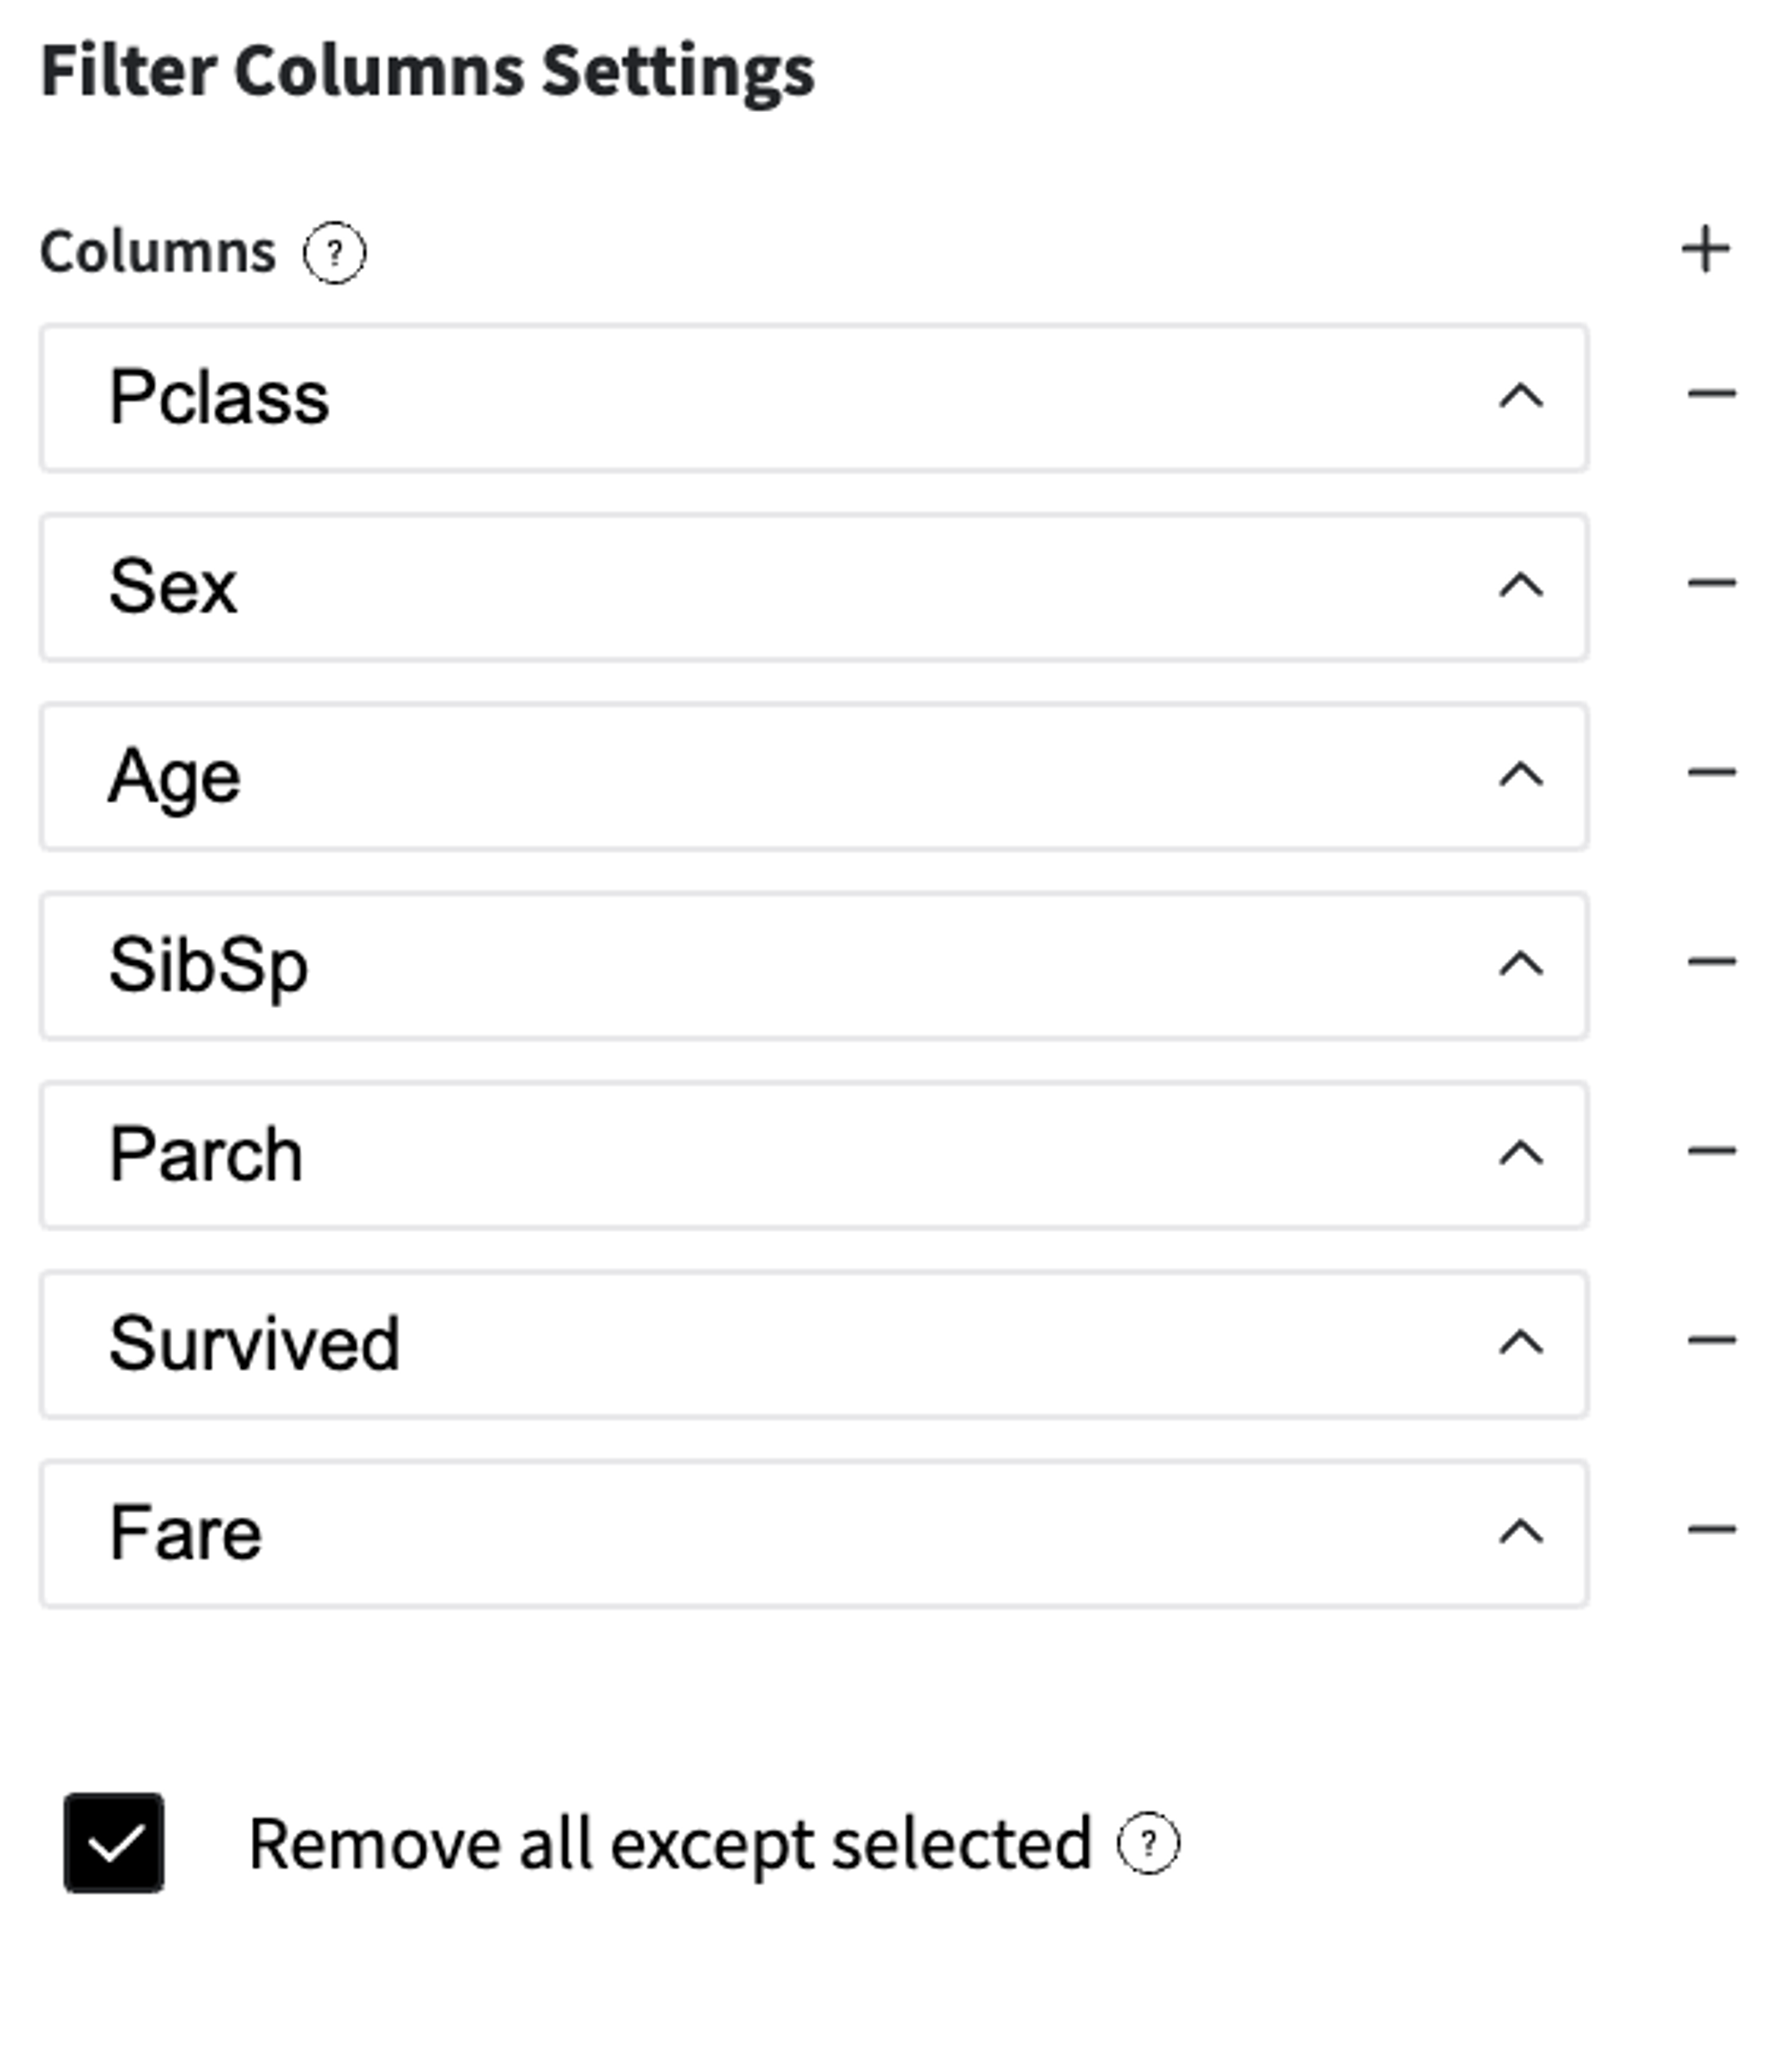
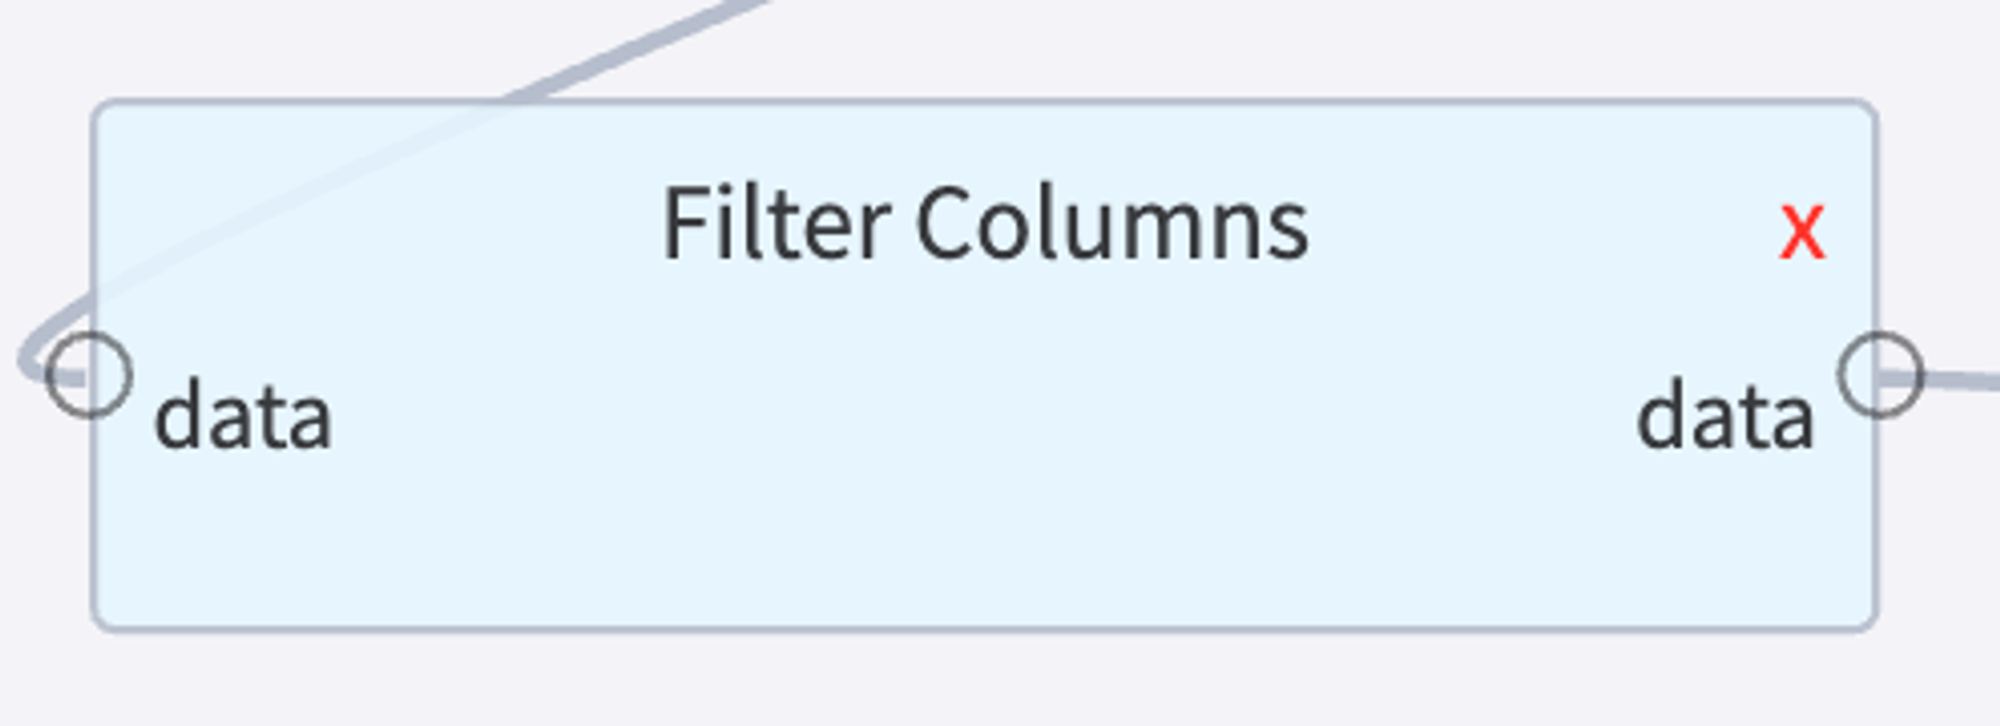
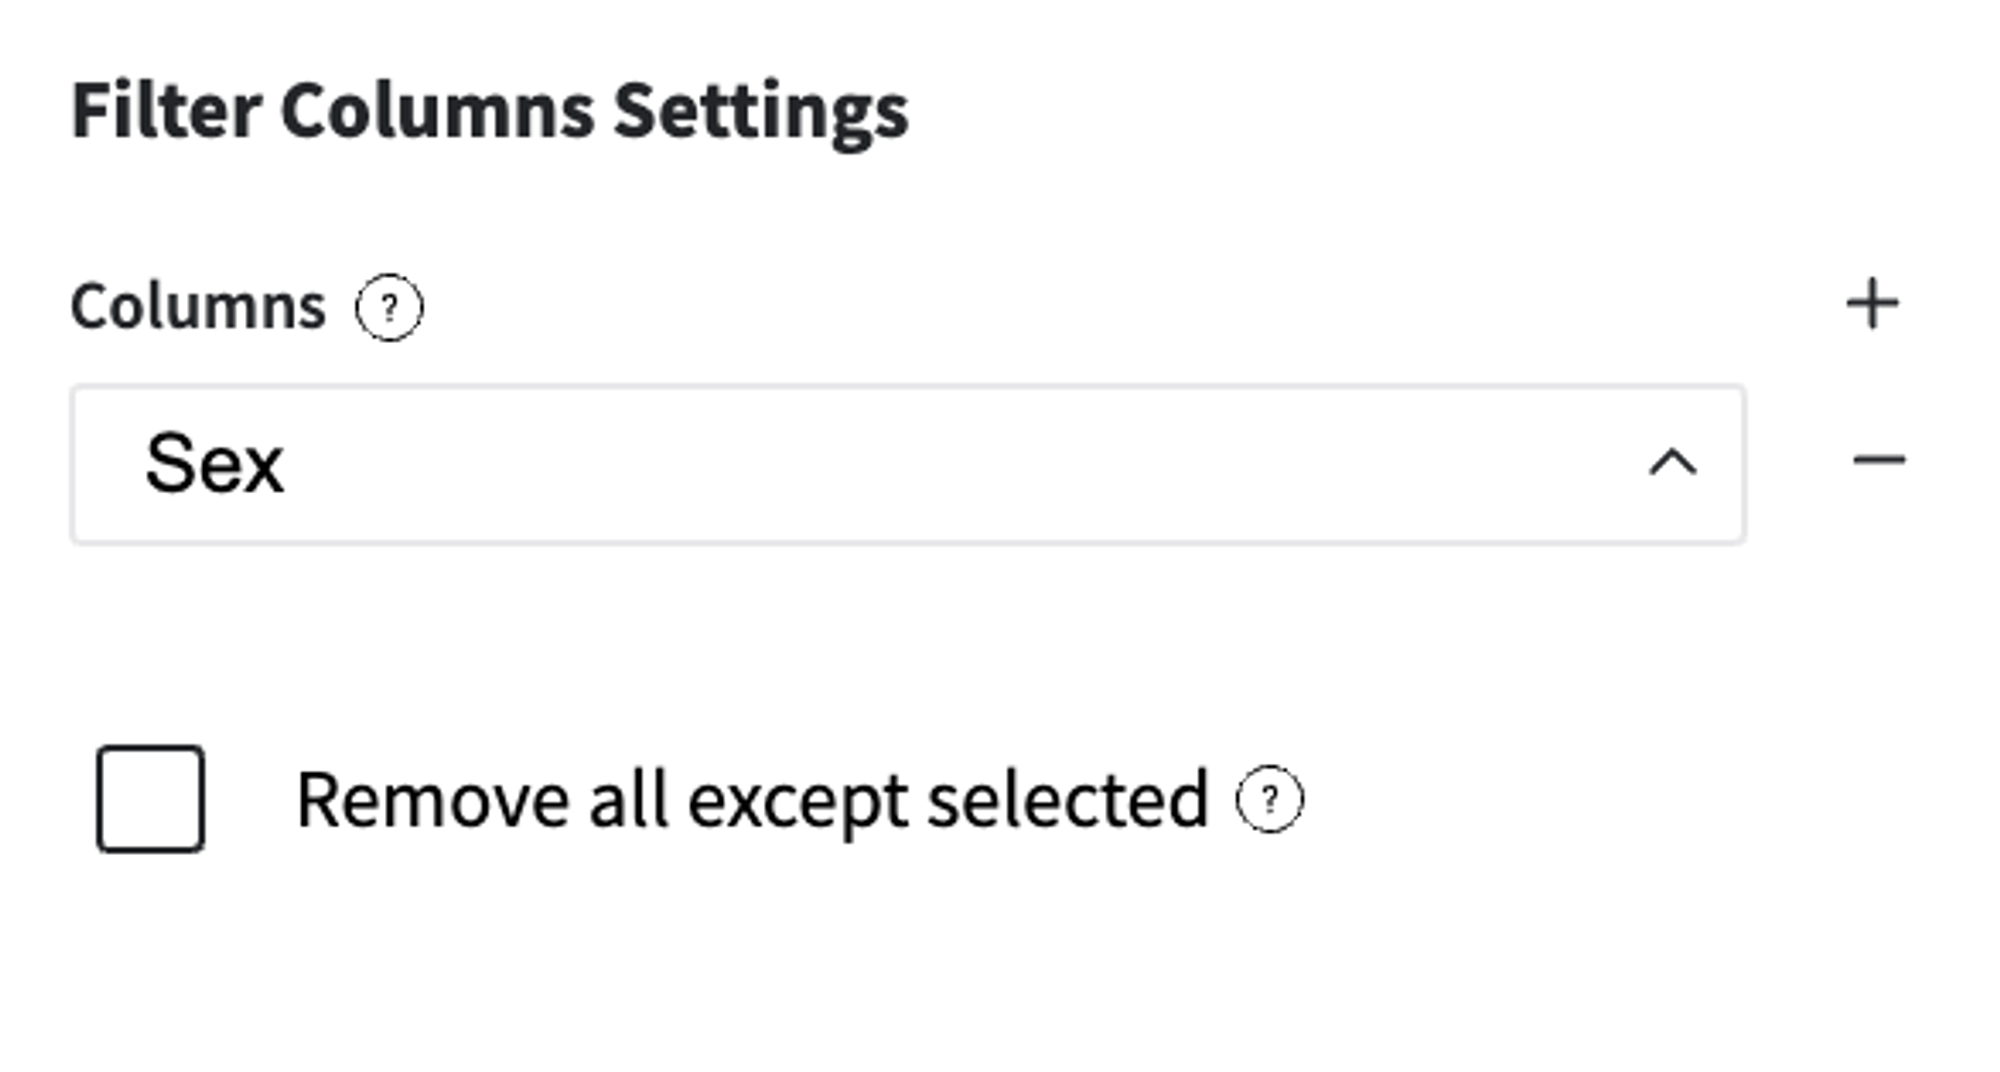
Feature Selection - select features that are used for the model training
As we introduce the new feature that represents the passenger's sex, we should remove the initial one.
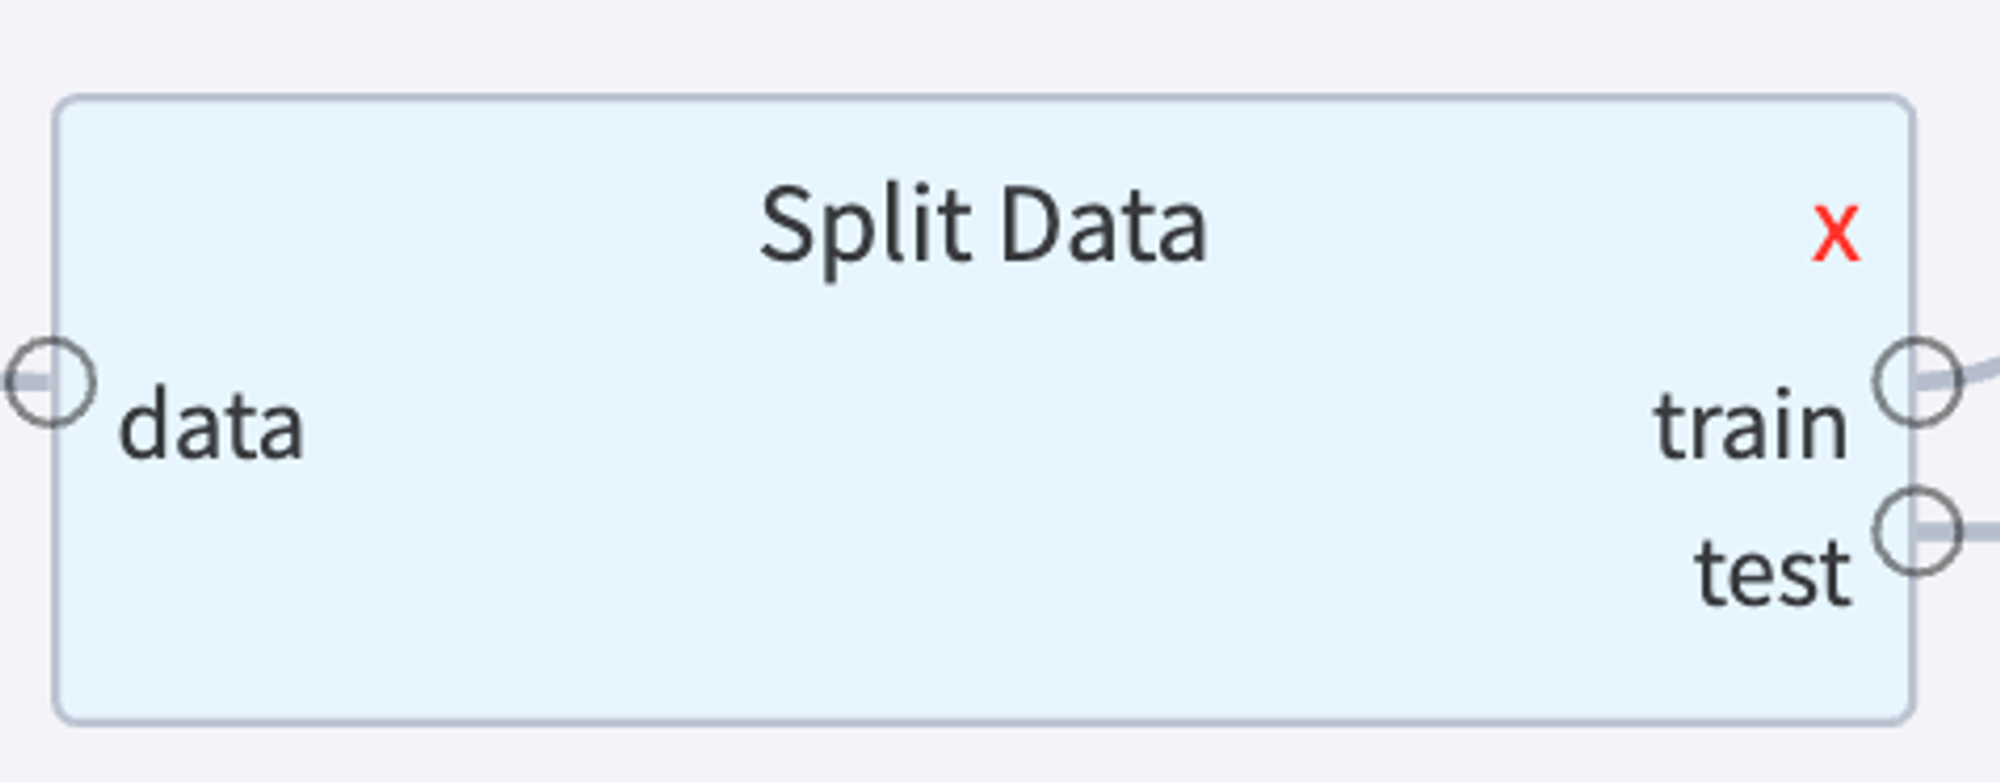
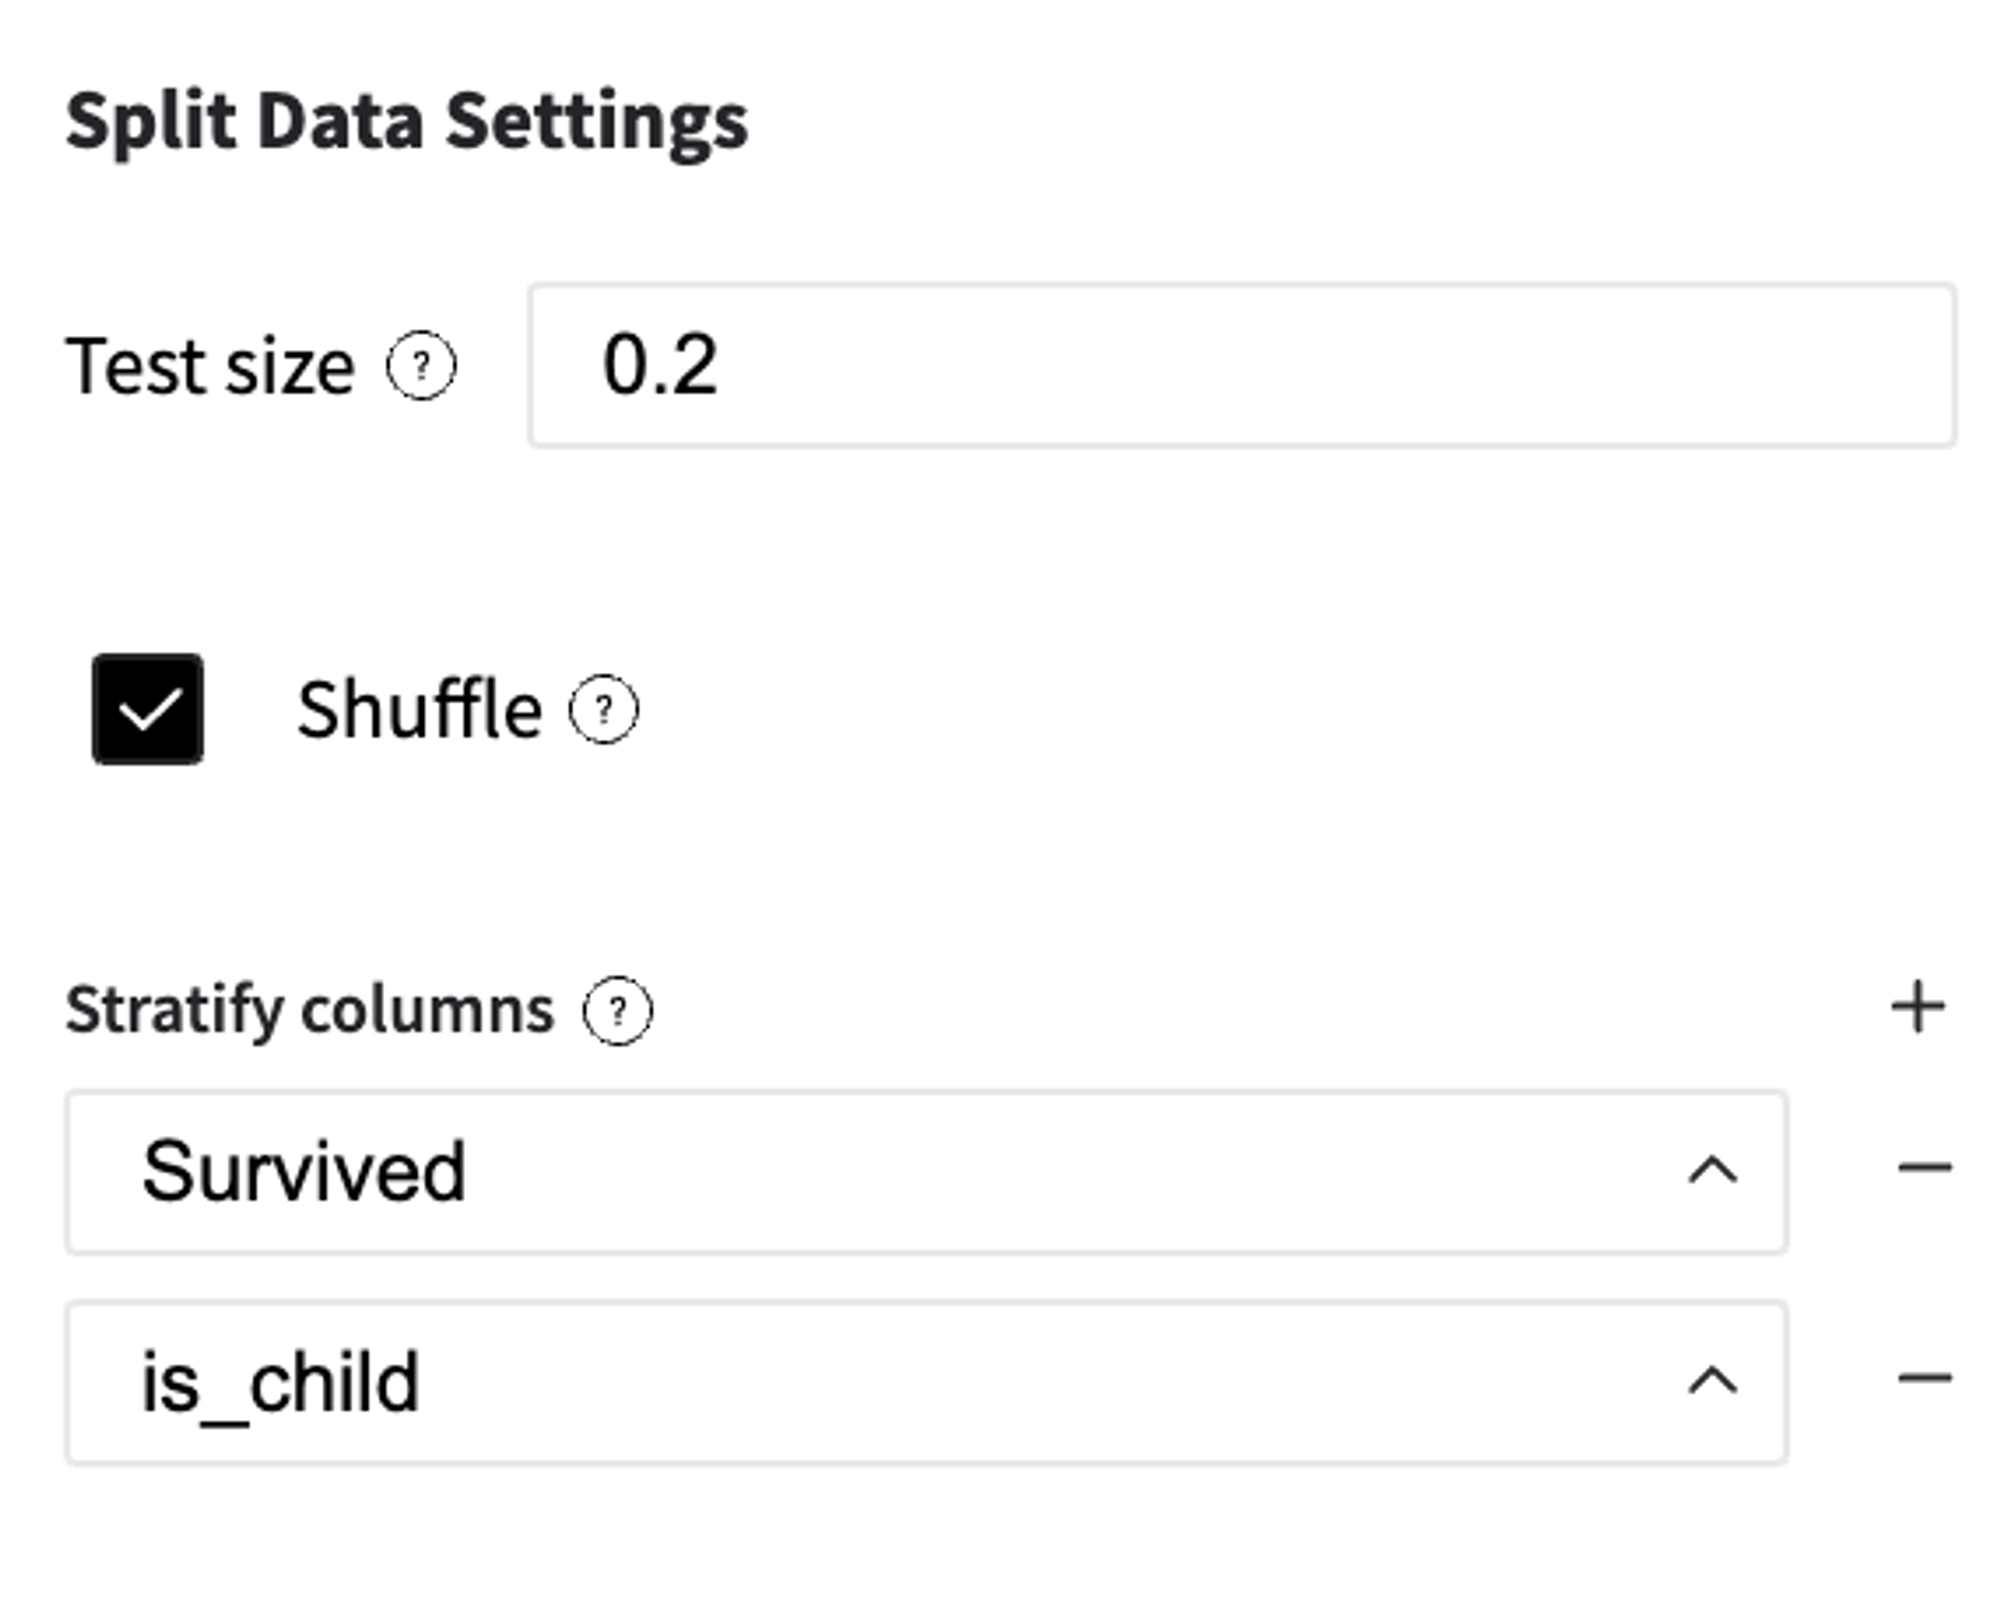
Prepare data sampling for model training and validation
For the model training, we may take 80% of input sampling with the providing of the train/test subgroups homogeneity. That's why we make stratification sampling with respect to the target variable ("survived") and input feature "is_child".
Get final feature set
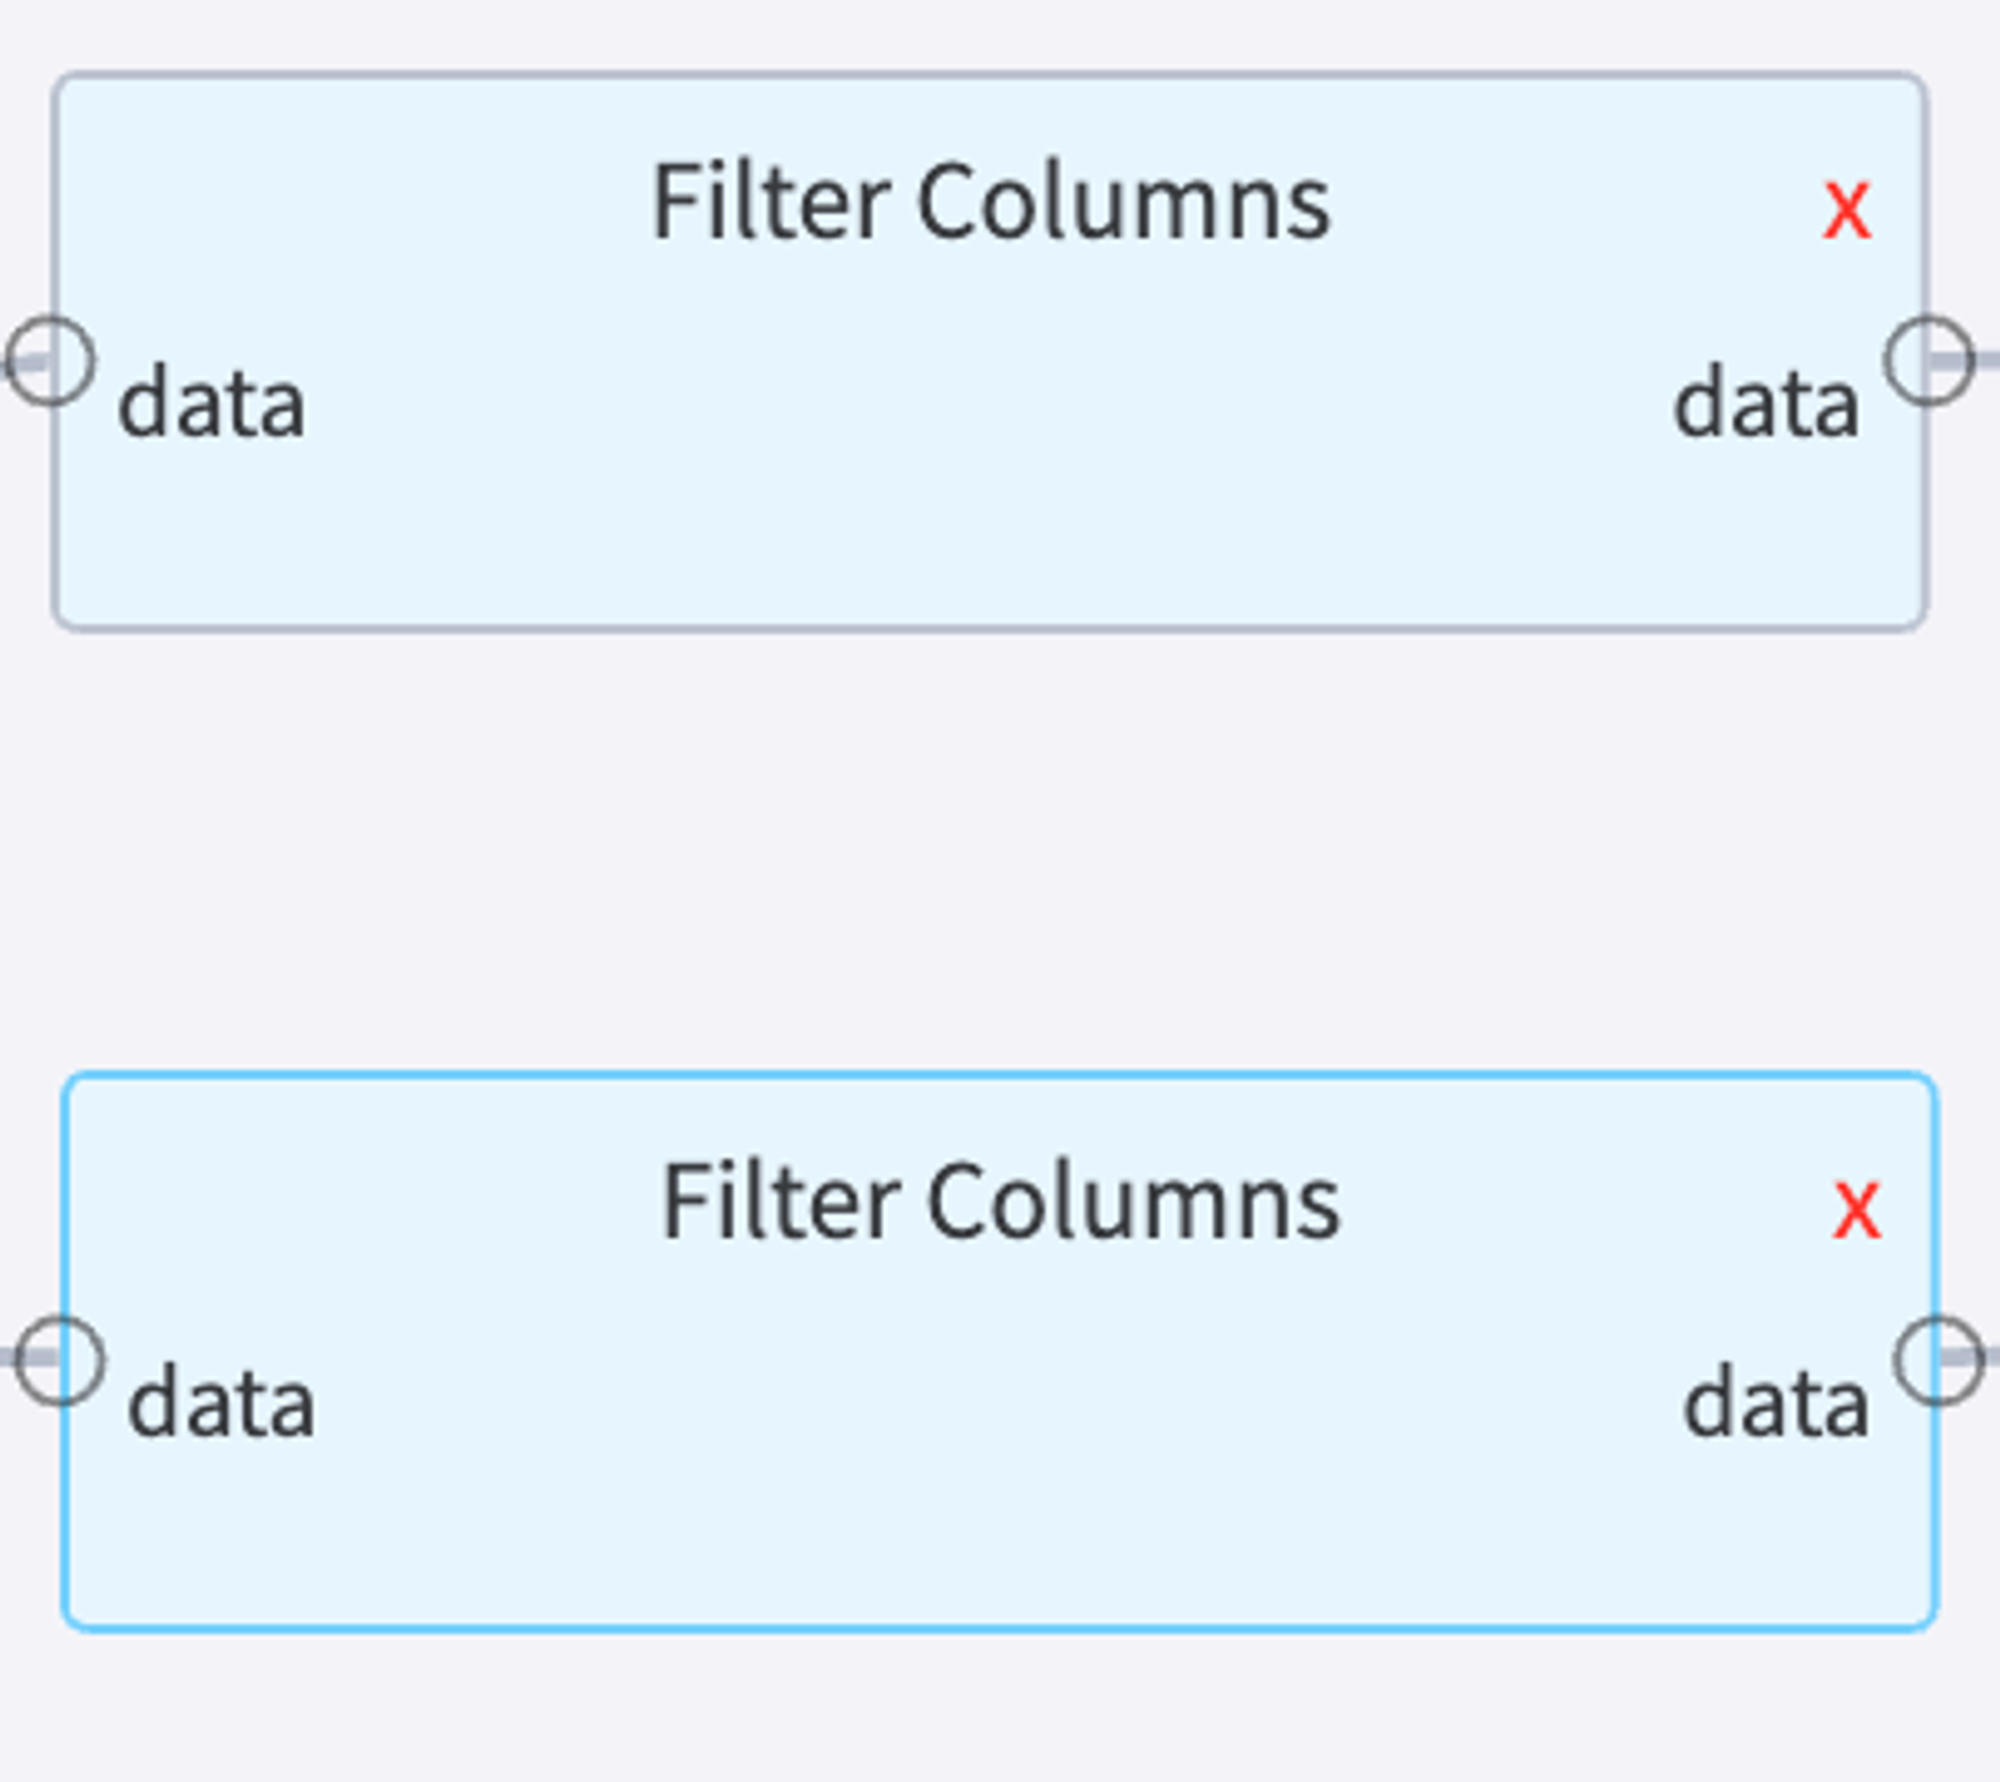
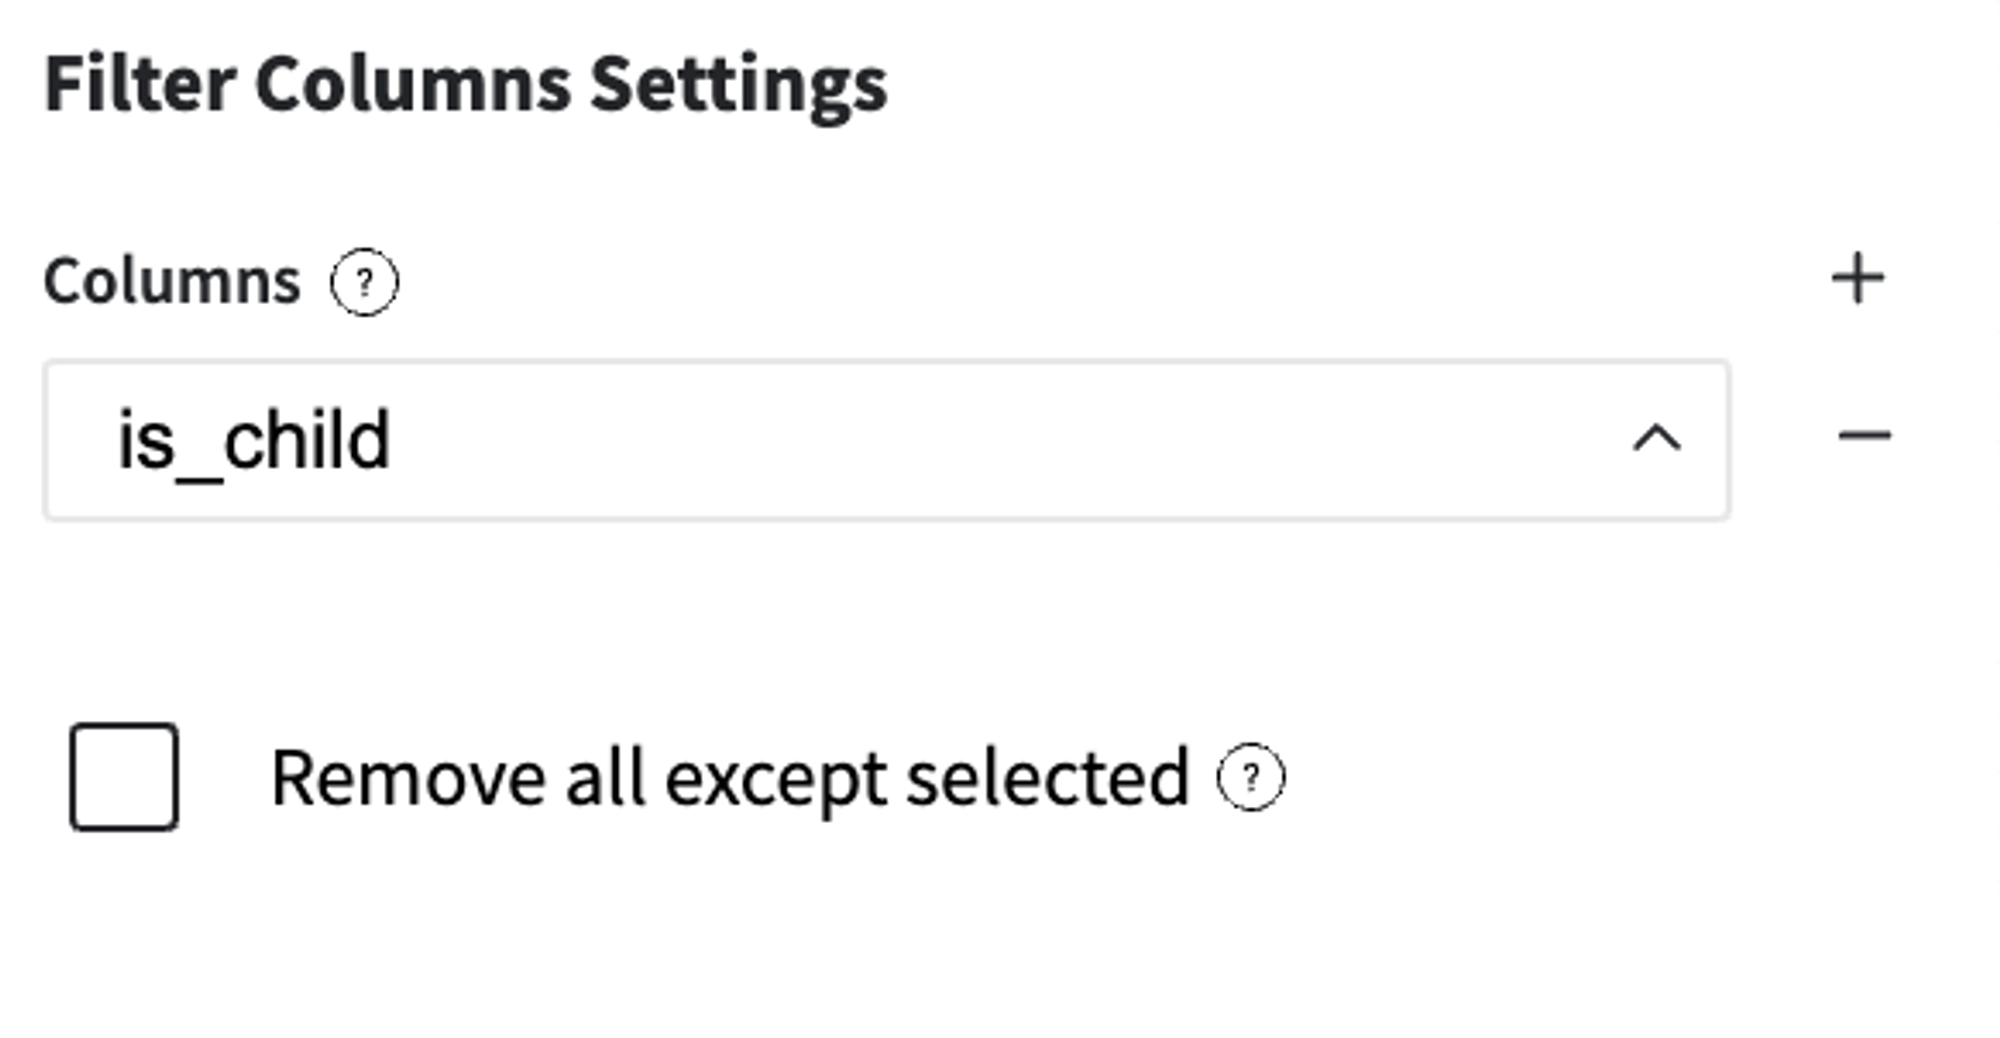
Column "is_child" has a functional dependency with the initial attribute "Age", and was created for the stratification sampling only. That's why we have to delete it from the input feature-set both for train and test samplings.
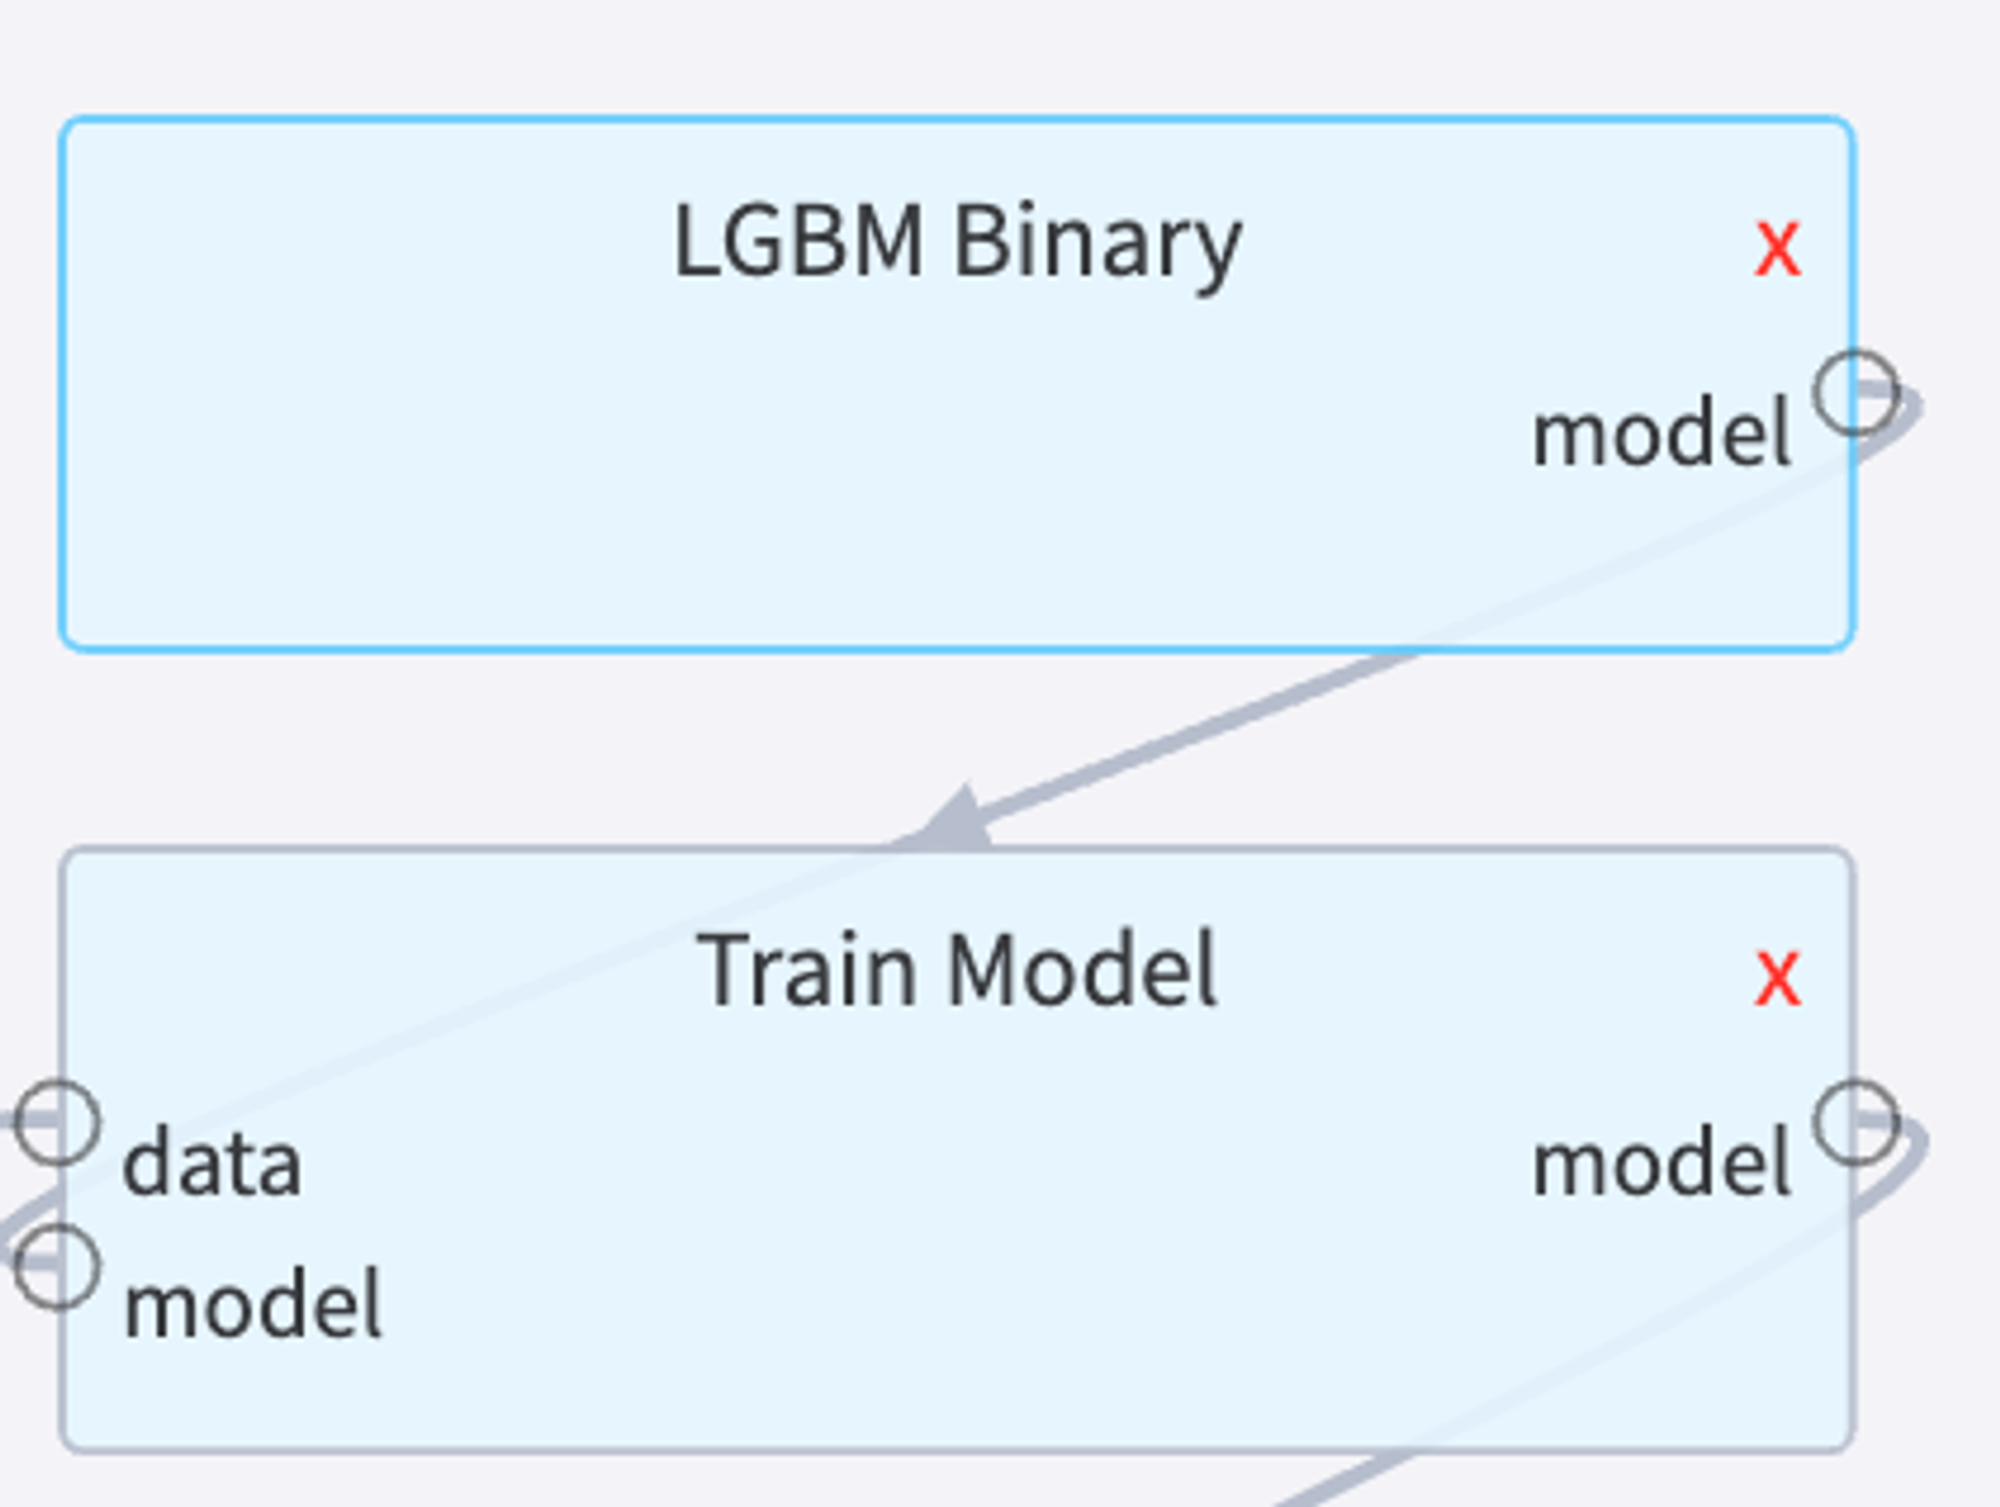
Train model for binary classification
As a core of the proposed solution we decided to use Gradient Boosting Binary Classification Trees, which can be replaced with any other binary classifier, which supports the proposed form of input features. Model parameters:
Learning Rate - 0.1
Number of Iterations - 100
Number of leaves - 31
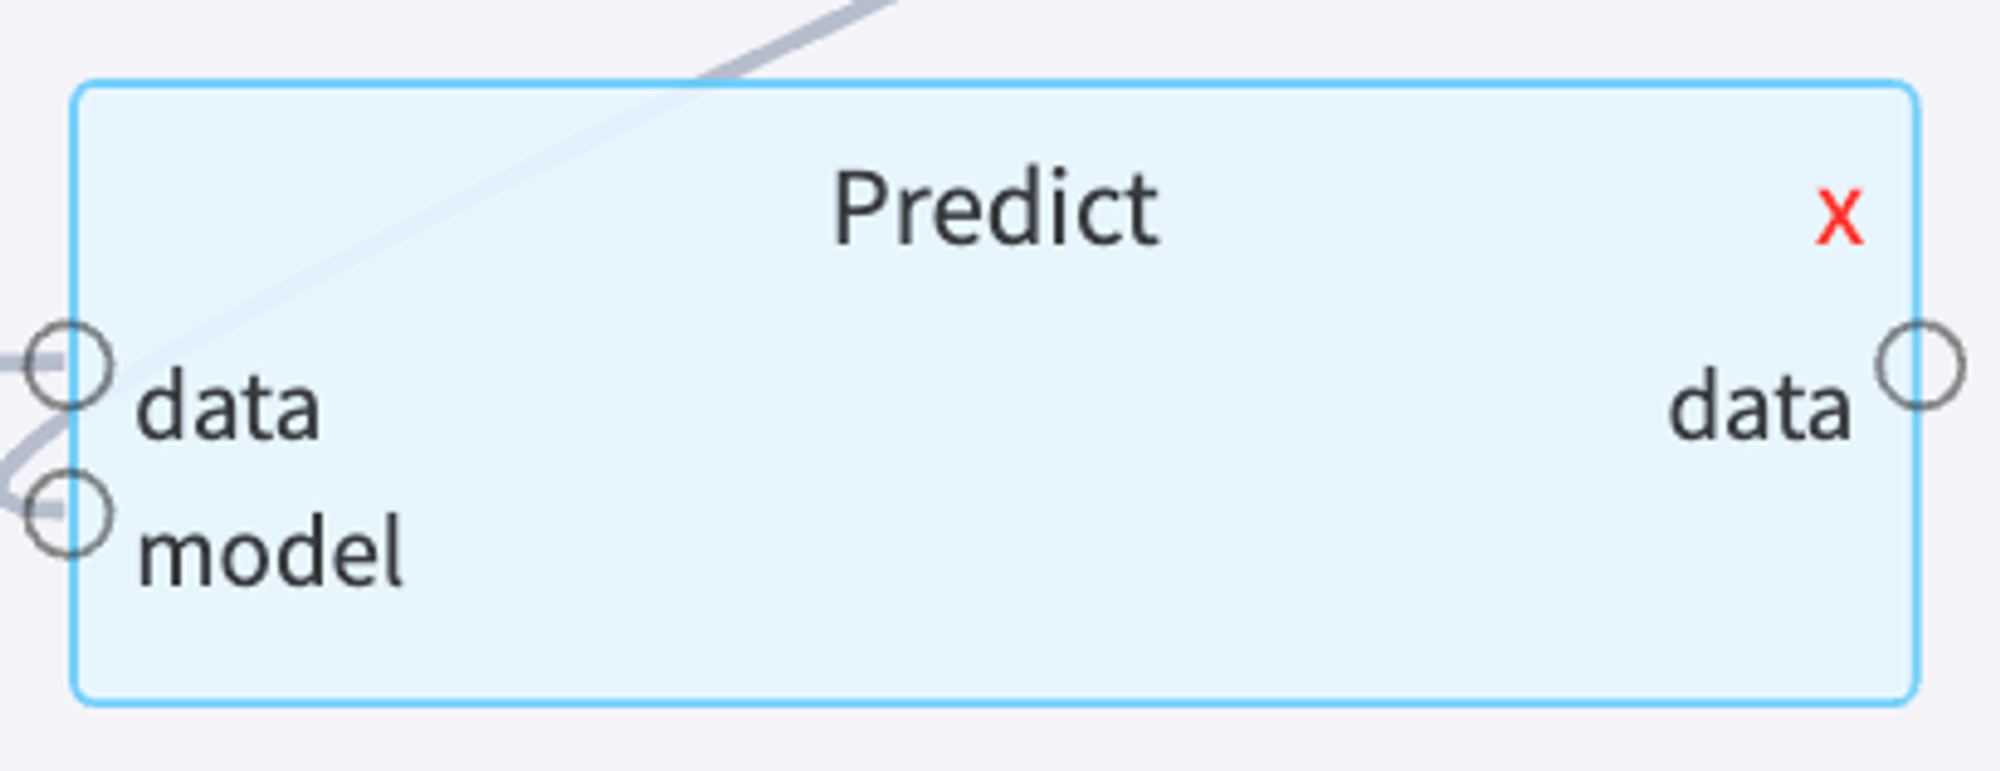
Apply to new data
Pipeline results
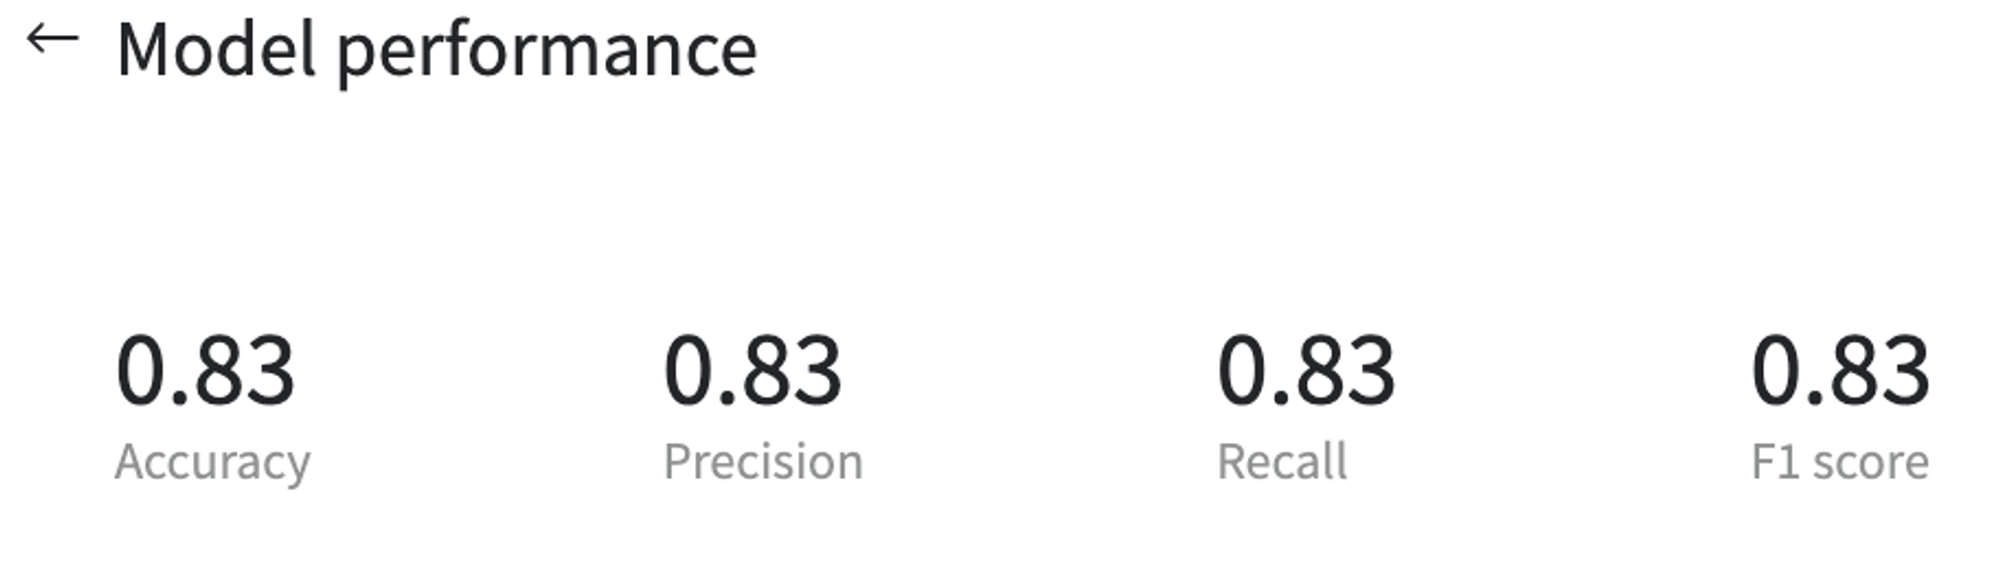
Model performance
The model provides 83% accuracy on the test set. To see the final results, press "Model performance" button on the Predict brick menu.
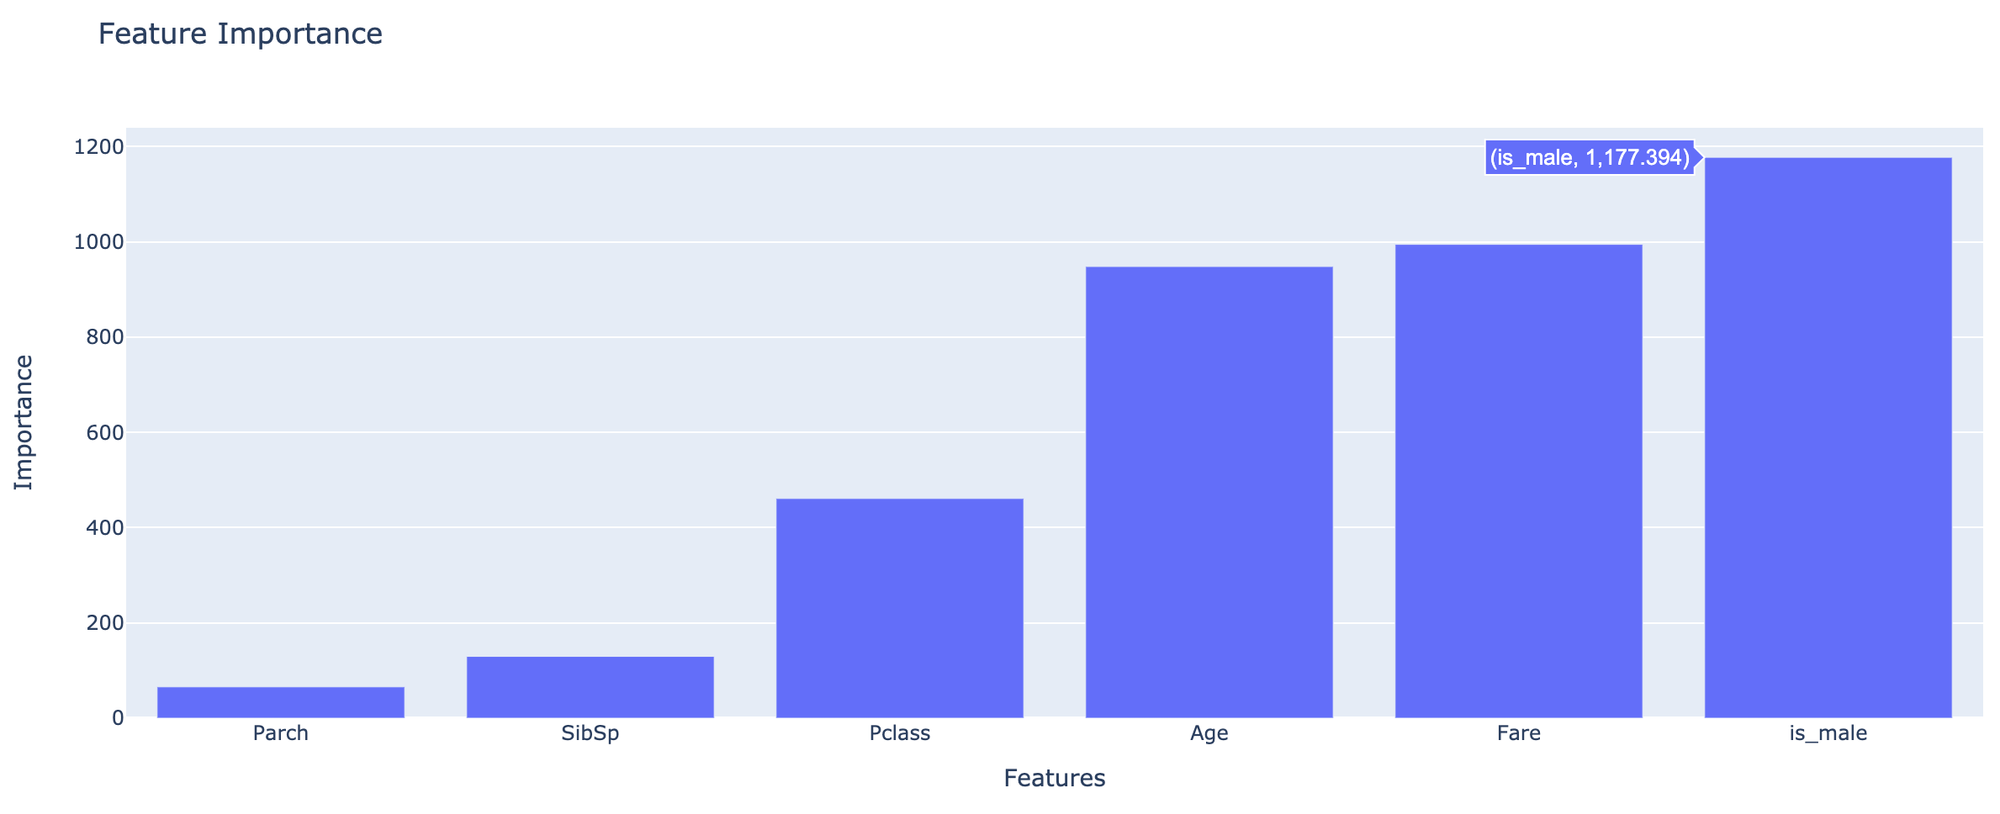
Feature Importance
The predictive importance of the input features for the assessment target variable can be reached via Train Brick→ Model Performance dashboard. As was expected, in our case the most important features are "is_mail", "fare" and "age".
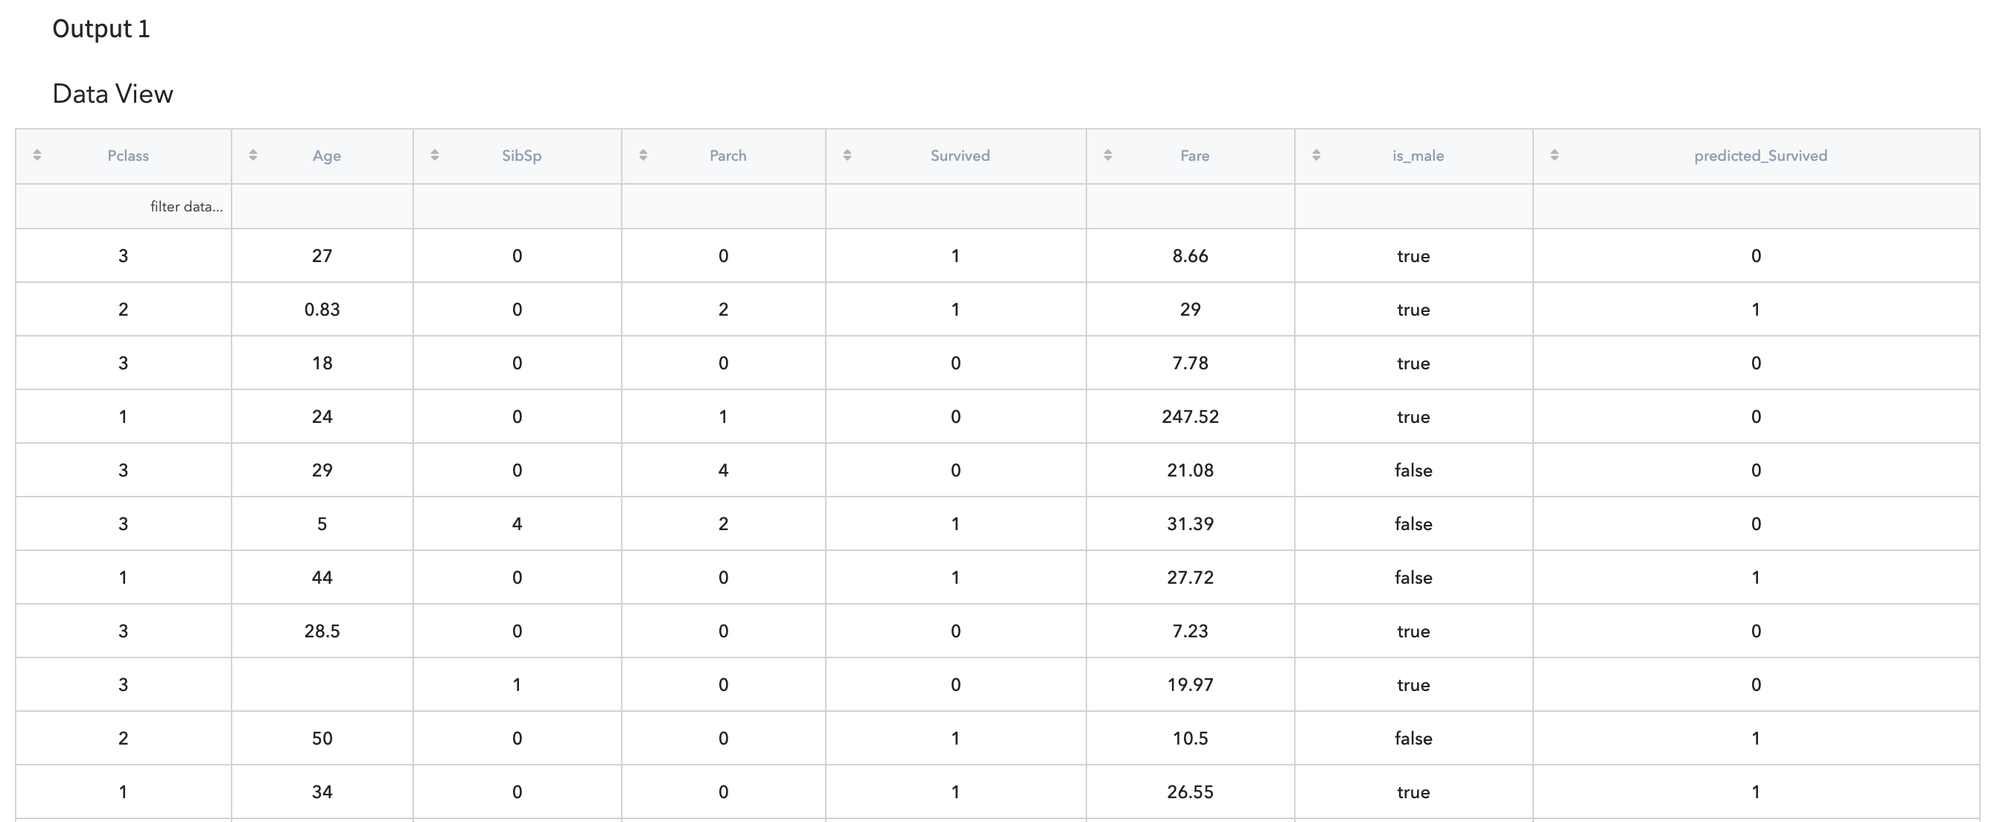
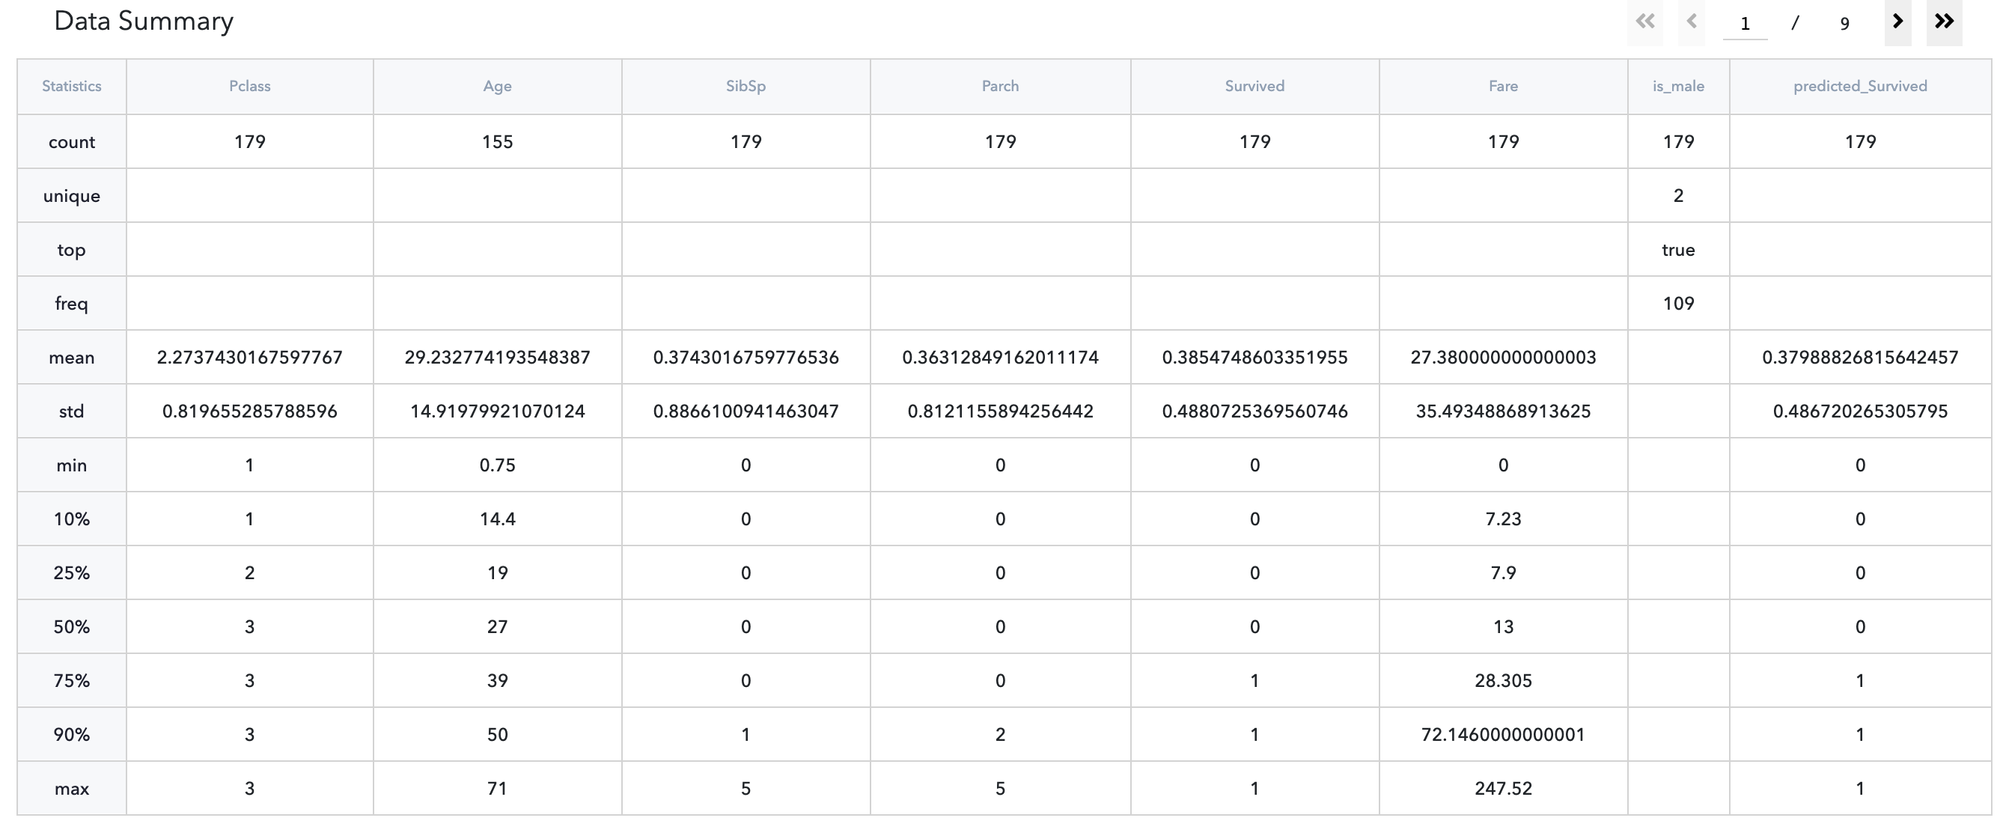
Prediction Results
Model prediction results can be reviewed and analysed in Predict→Output dashboard.