General information
Brick provides an assessment of the predictive power of independent variables with respect to the binary dependent variable via Weight of Evidence (WoE) and Information Value (IV) calculation:
- WoE - reflects the strength of each category in predicting the desired value of the target variable. It is equal to the natural logarithm of the division of the part of all non-events that belong to the category's sub-sampling and the part of events correspondingly:
In the case of continuous variable data is preliminary split into 10 parts - 10 intervals with the equal density.
- IV - a measure of the predictive power of the independent variable based on the separate categories' WoE values:
Information Value explanation
Information Value
Variable Predictiveness
Extremely Weak predictive Power
Weak predictive Power
Moderate predictive Power
Strong predictive Power
Very Strong Predictive Power
Description
Brick Location
Bricks → Analytics → Data Insights → Information Value
Bricks → Analytics → Credit Scoring → Information Value
Bricks → Use Cases → Credit Scoring → Features Engineering → Information Value
Brick Parameters
- Target
A binary variable that is used as a target variable in a binary classification problem. The information value of the separate predictors is calculated with respect to the specified target. The target variable should present in the input dataset and takes two values - (0, 1).
- Columns
- remove all mentioned columns from dataset and proceed with rest ones as with predictors
- use the selected columns as predictors and proceed with them
List of possible columns for selection. It is possible to choose several columns for filtering by clicking on the '+' button in the brick settings and specify the way of their processing:
- Remove all except selected
The binary flag, which determines the behaviour in the context of the selected columns
- Method
- Information Value with WoE - detailed information about predictors that includes the information value of the variable, information value of its separate categories, and their weight of evidence scores
- Information Value only - the short representation of the Information Value brick results, which includes the listing of the selected predictors with their information values with respect to the specified target variable
The property, which determines the view of the final results representation:
Brick Inputs/Outputs
- Inputs
Brick takes the dataset, which contains the binary target variable and independent predictors
- Outputs
Brick produces the result as a new dataset, with the the following columns:
Mode: Information Value with WoE
Column
Description
Name of the analysed predictor
Separate value of the analysed variable (category)
Number of event in the subsample defined with category
Number of non-event in the subsample defined with category
Percent of events that belong to the subsample defined with category
Percent of non-events that belong to the subsample defined with category
Weight of Evidence of the correspondent category
Information Value of the correspondent category
Information Value of th predictor
Additional information related to the predictor
Mode: Information Value only
Example of usage
Let's consider the binary classification problem Binary classification : Titanic. the inverse target variable takes two values - survived (0) - good or non-event case / not-survived (1) - bad or event case. The general information about predictors is represented below:
- passengerid (category) - ID of passenger
- name (category) - Passenger's name
- pclass (category) - Ticket class
- sex (category) - Gender
- age (numeric) - Age in years
- sibsp (numeric) - Number of siblings / spouses aboard the Titanic
- parch (category) - Number of parents / children aboard the Titanic
- ticket (category) - Ticket number
- fare (numeric) - Passenger fare
- cabin (category) - Cabin number
- embarked (category) - Port of Embarkation
Assessment Information Values of the predictors
First of all, we may get a general assessment of the predictors in the context of their ability to predict the target variable. For this purpose we should:
- pass the input data set to the Information Value brick
- define the target (survived column)
- choose the "Information Value only" mode
- run pipeline
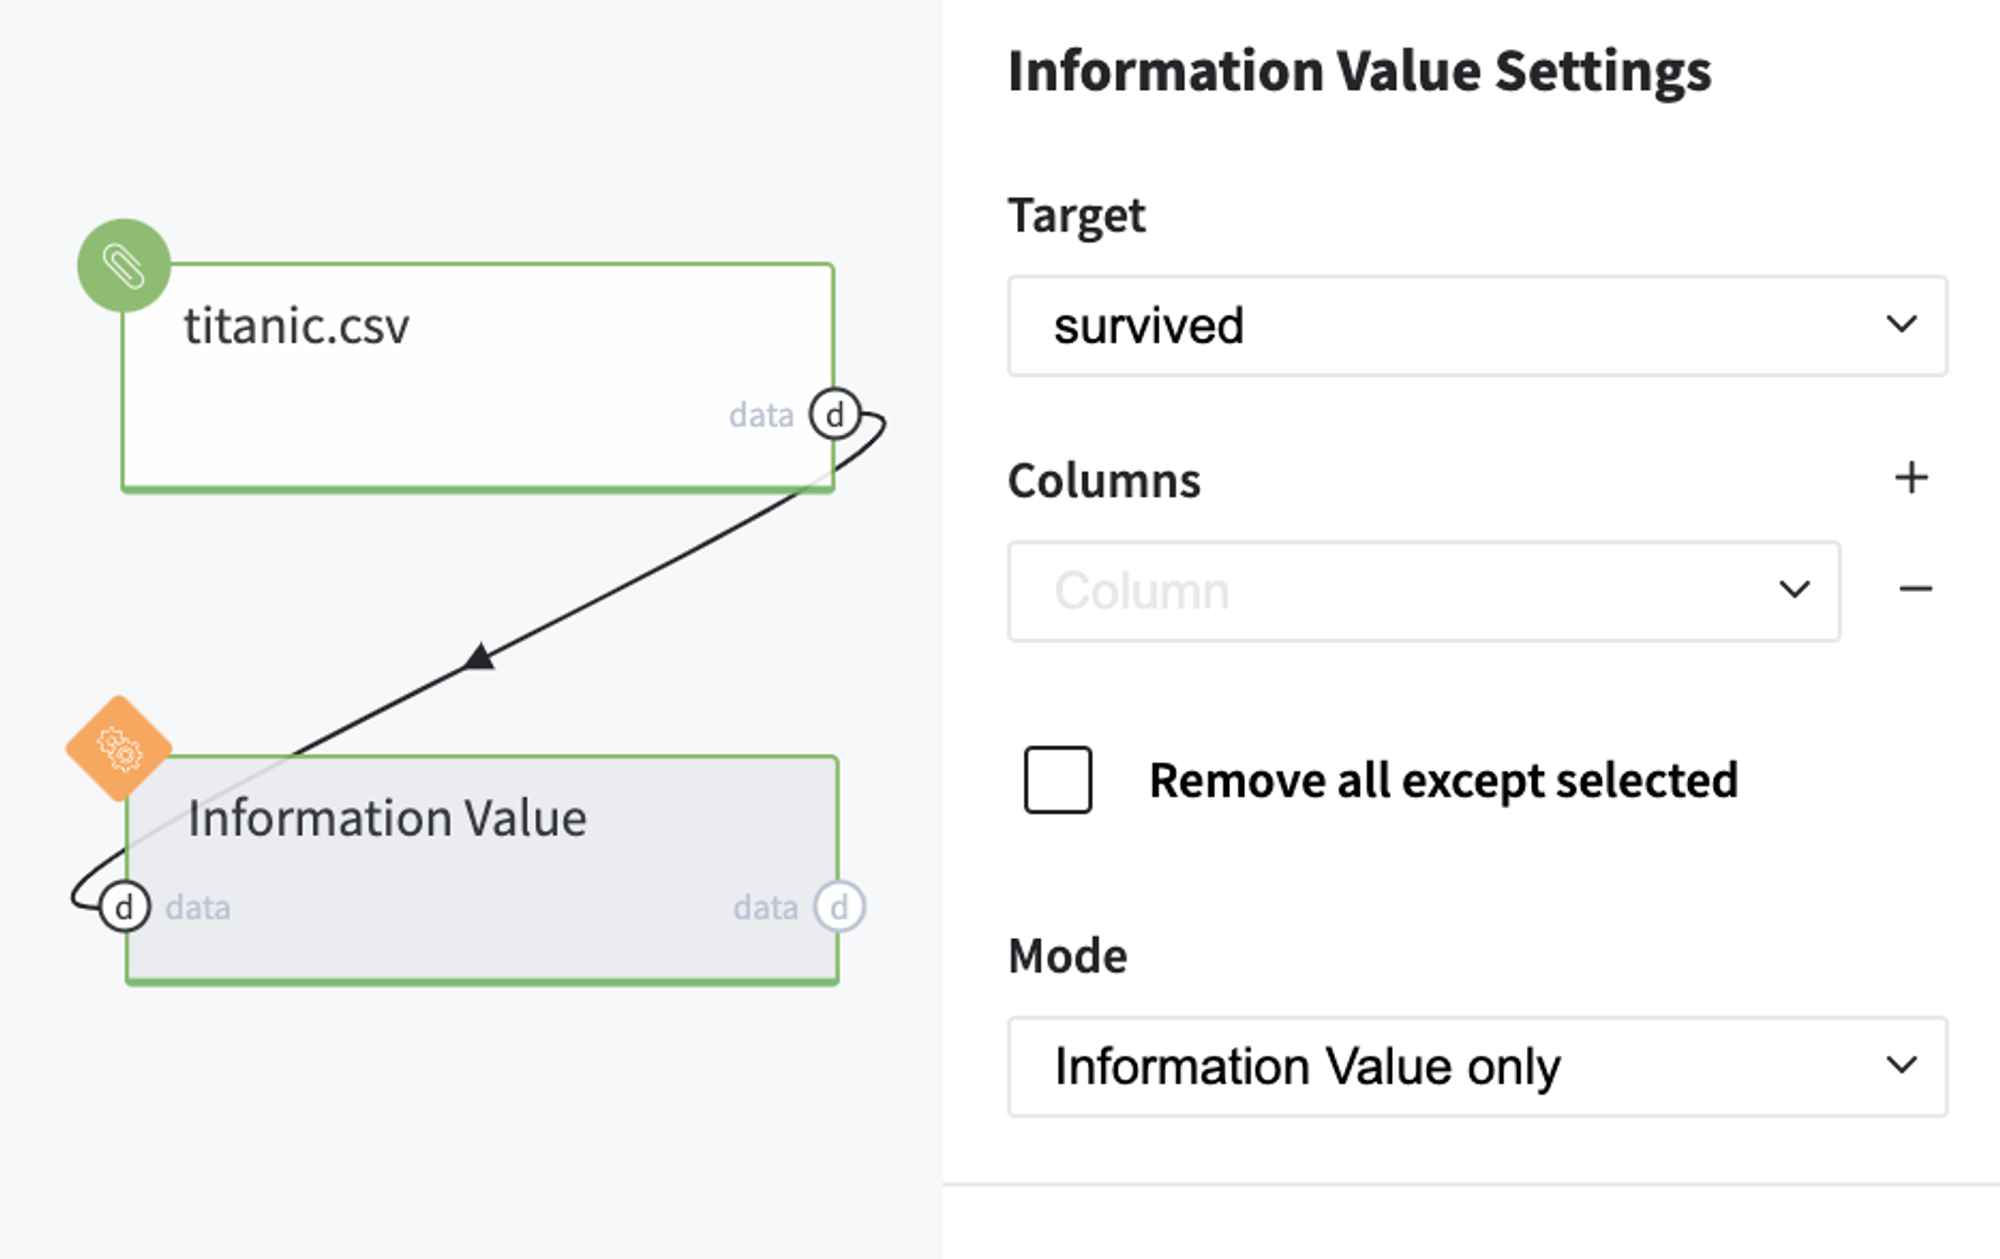
In order to see the assessment result, you should open the Output data previewer on the right sidebar.

The result is depicted in the table:
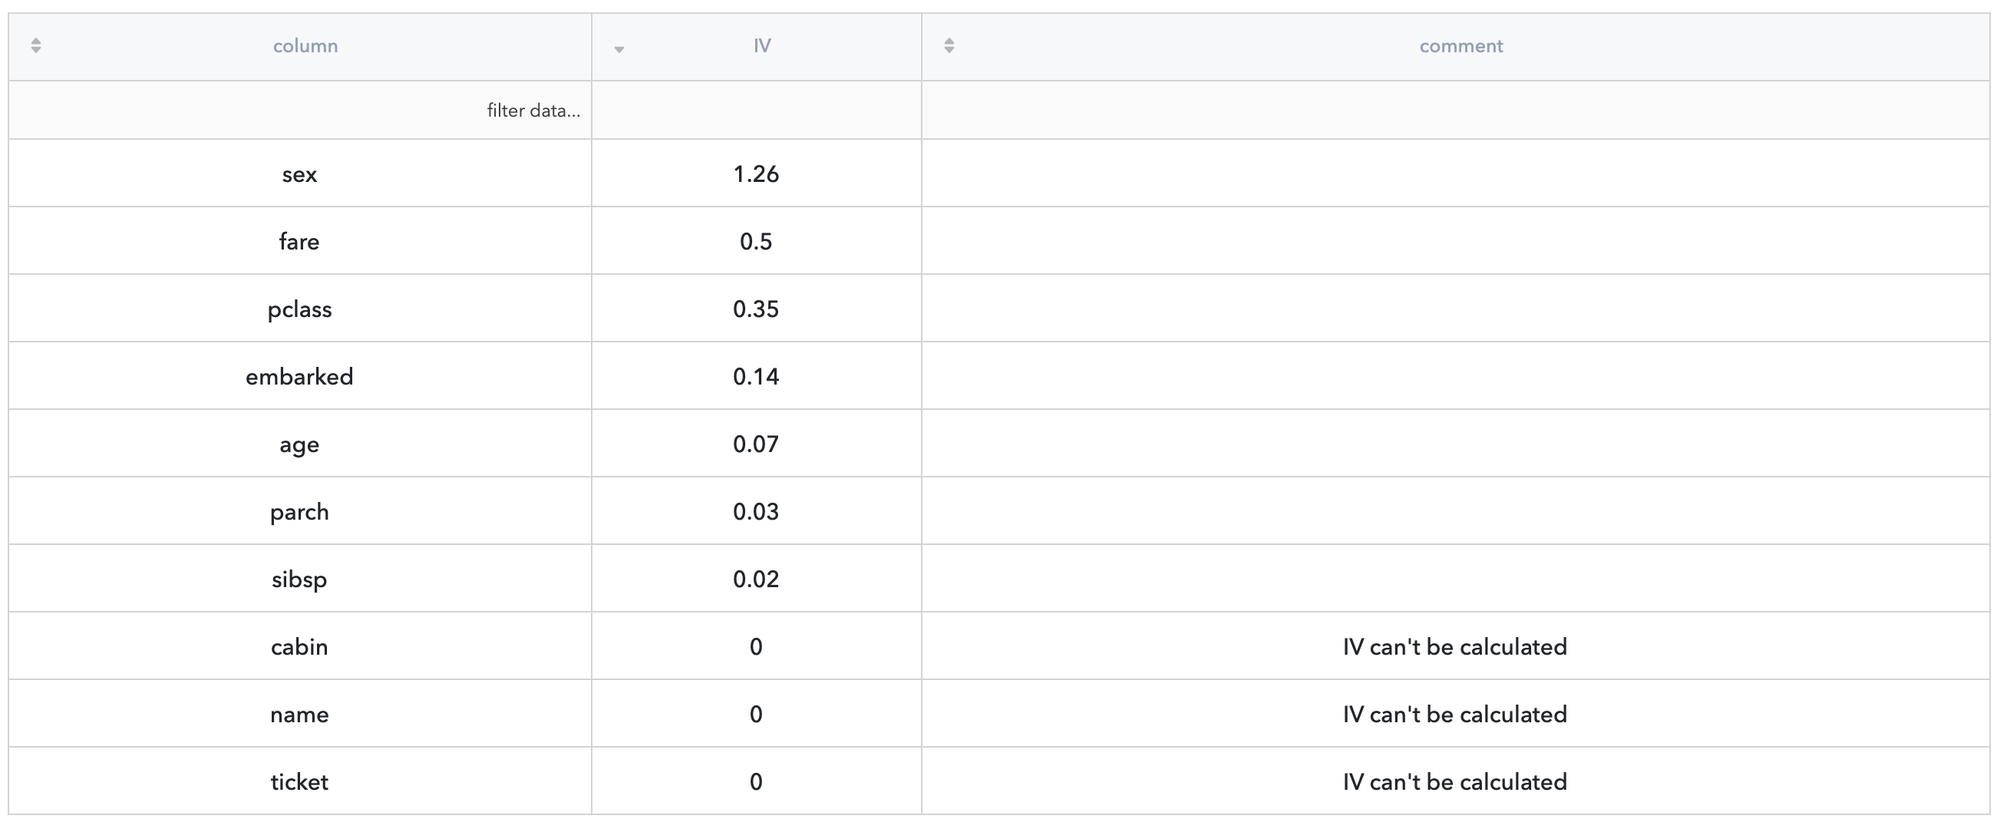
As we can see, the variables cabin, name and ticket are non-informative - they have too many unique values, that's why they can't be used in the robust solution. Because of these reasons, the information value of the variables can't be calculated and they got IV score equals 0.
The most informative most appropriate predictors are sex and fare - they are characterized with IV scores higher than 0.5 which corresponds to the very strong predictive power case. At the same time the predictors pclass and embarked have strong and moderate predictive powers, but age, parch and sibsp are variables with weak predictive power.
So, the most appropriate solution for us might be the limitation of the predictors' list by sex, fare, pclass and embarked only.
Detailed Analysis of the predictor
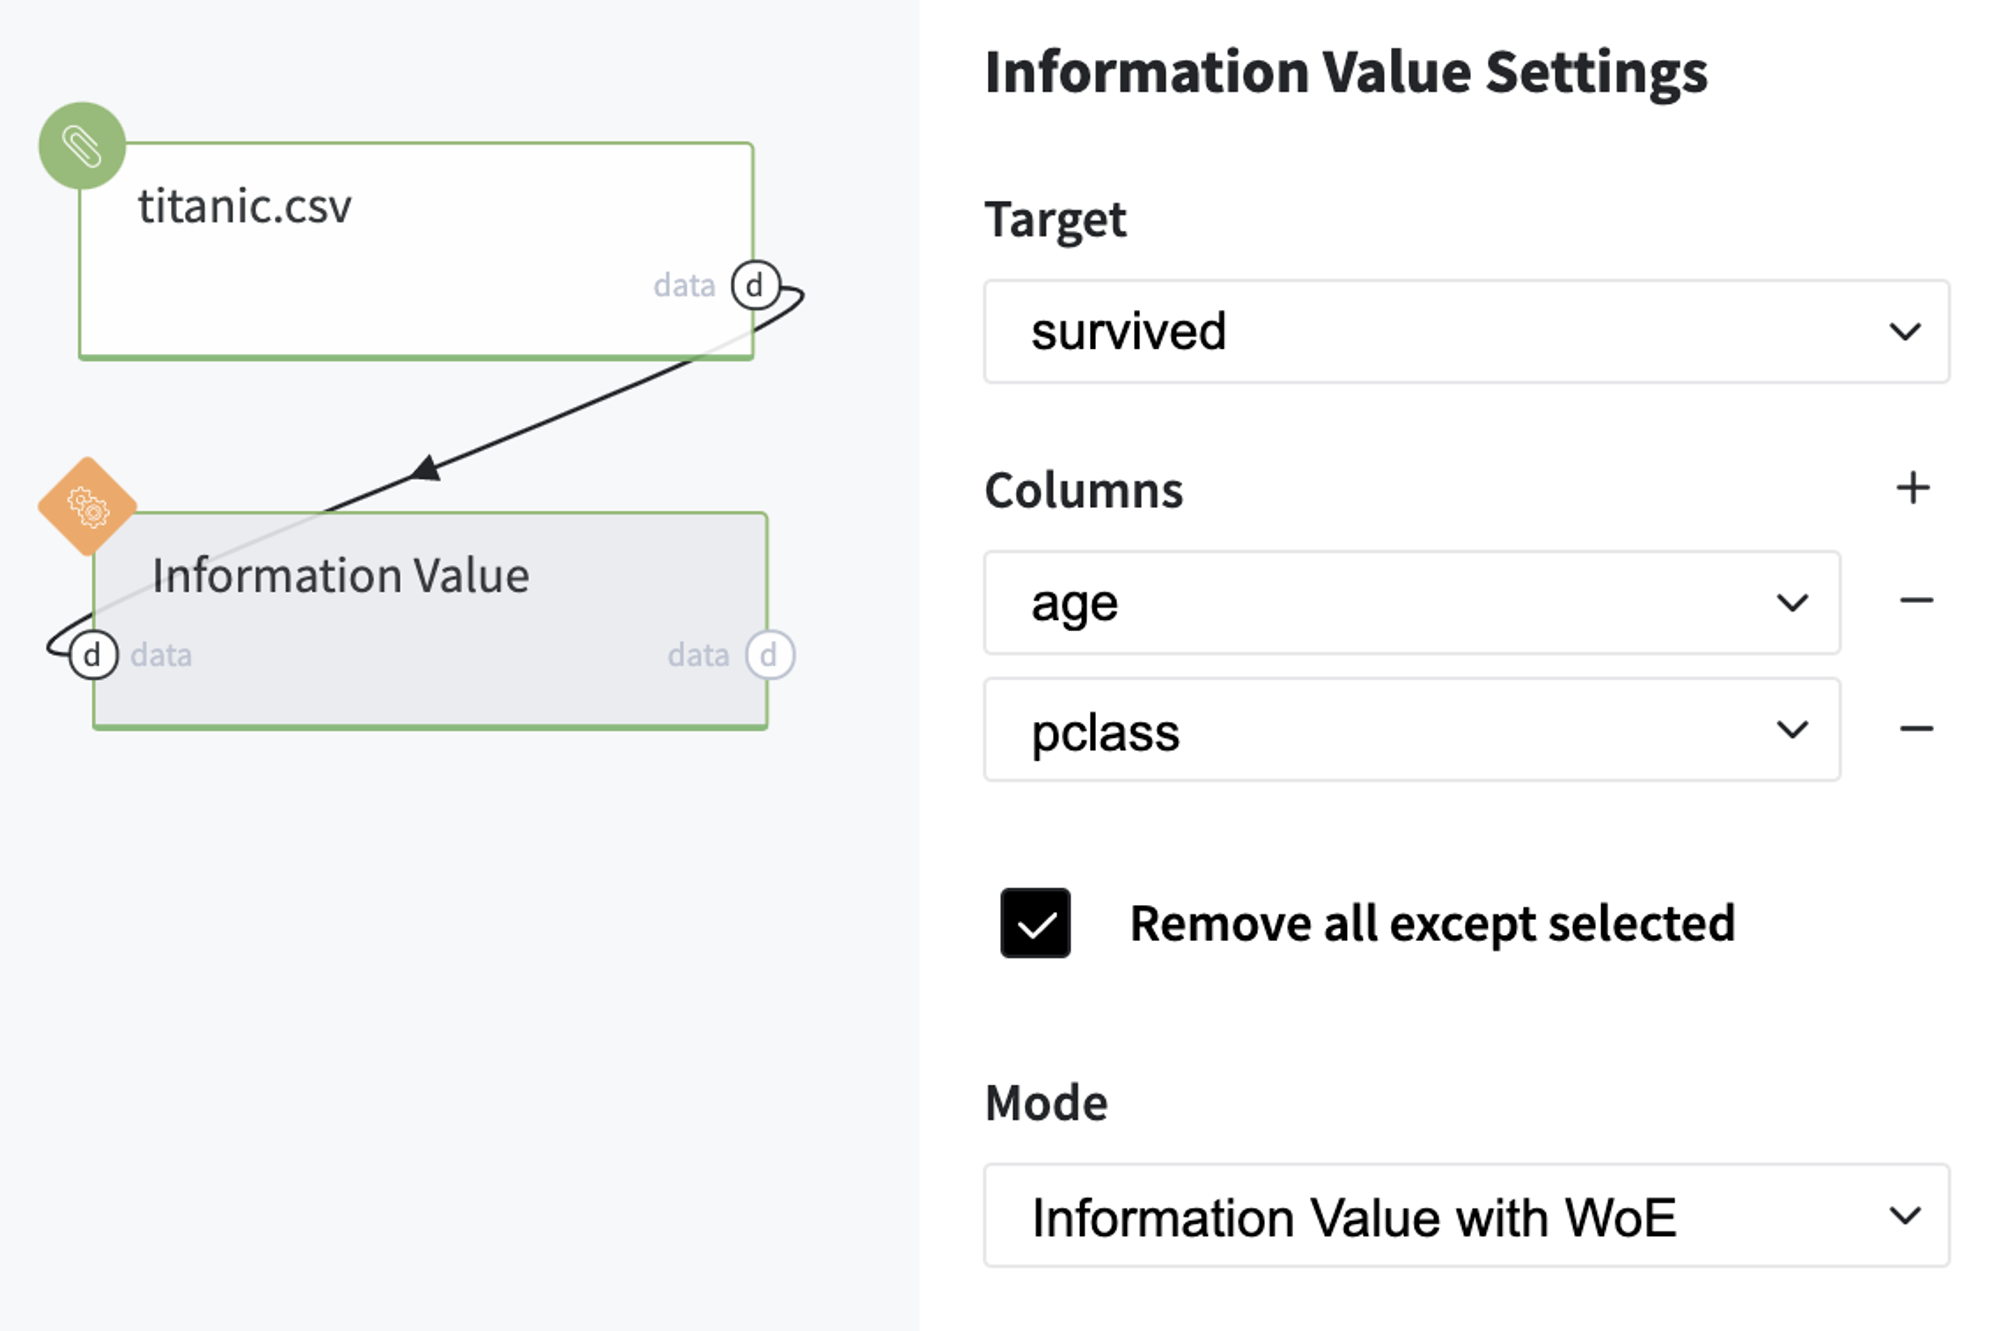
Sometimes there is a necessity to understand which categories are related to the specific variable bring the strongest impact to the predictive ability of the variable, and, in the case of a numerical variable, understand if the variable binning was made in the best way. For this purpose, we should select the variables for the analysis and execute brick with "Information Value with WoE" mode. For instance, we want to investigate pclass and age variables:
- pass the input data set to the Information Value brick
- define the target (survived column)
- add pclass and age to the Columns list
- choose Remove all except selected option
- choose the "Information Value with WoE" mode
- run pipeline
Let's look at the results:
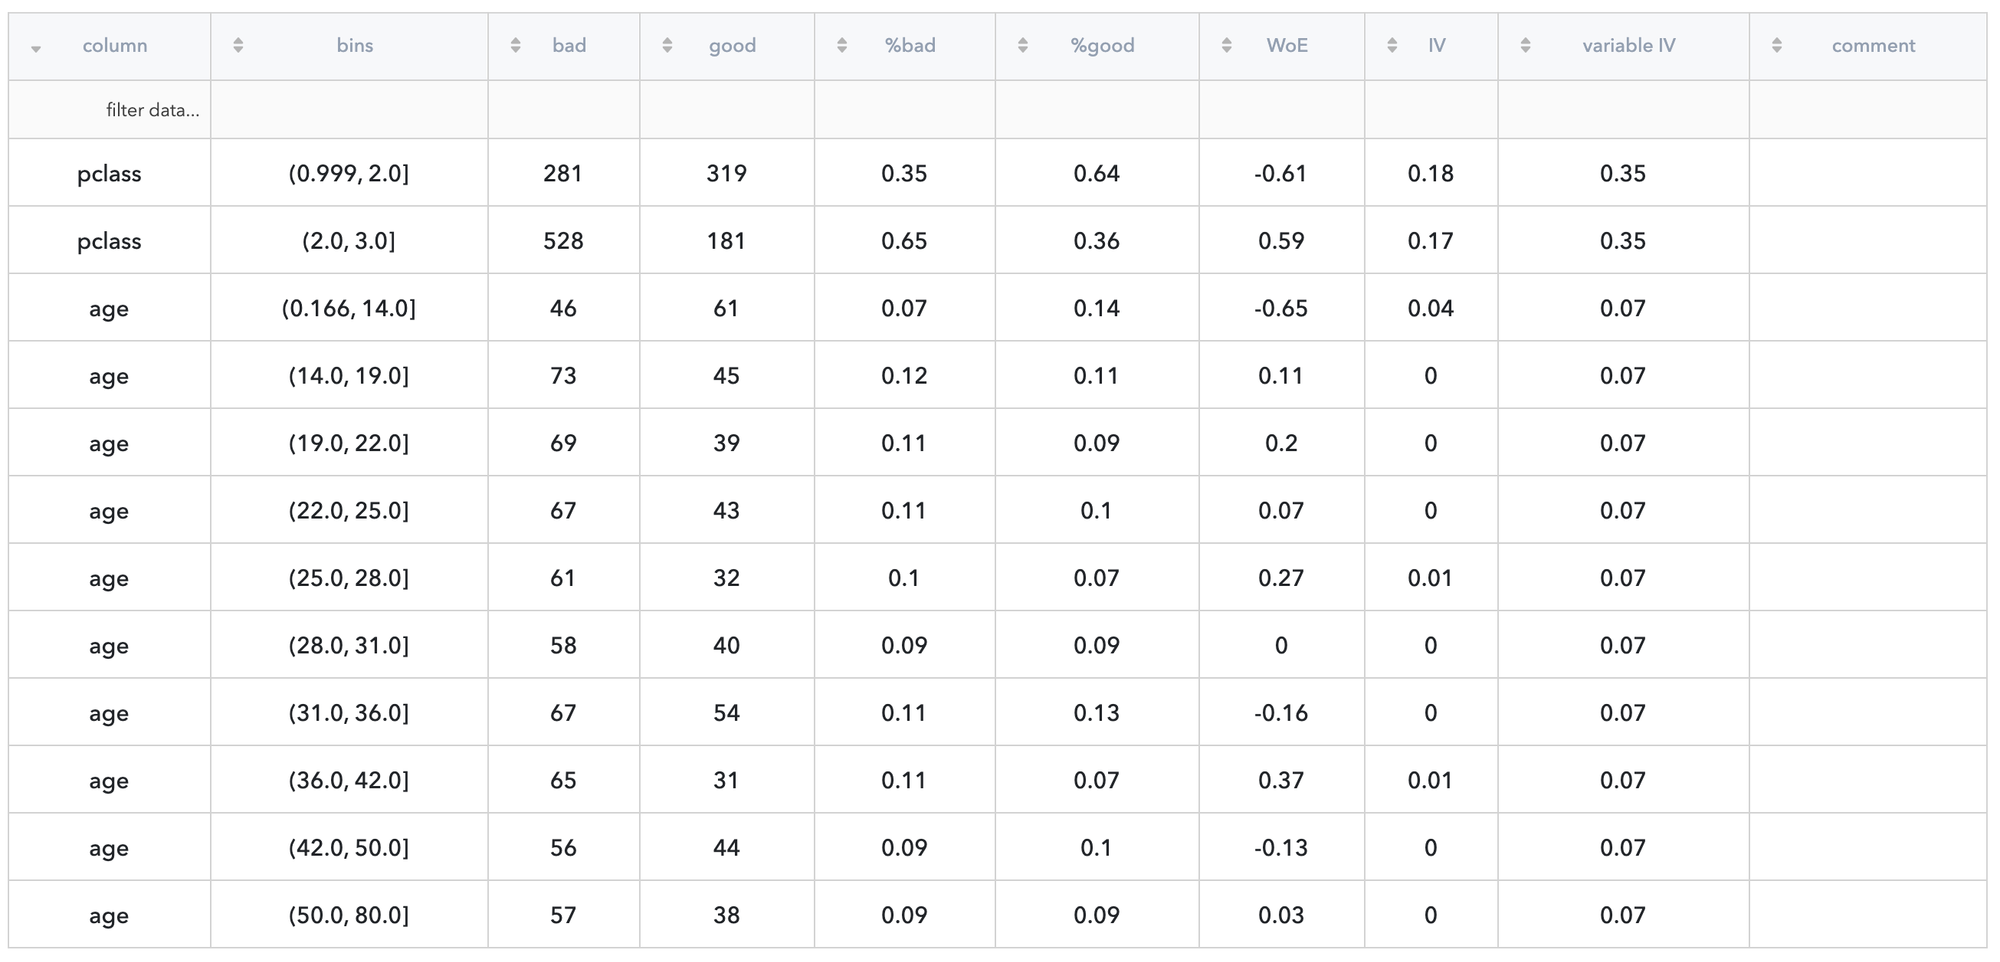
We may see, that passengers of the first and second classes have more chance to survive than the passengers of third class (negative and positive WoE correspondingly) and both categories make an equal contribution to the final information value of the predictor. As for age category, the strongest contribution to the variable information value makes the category of passengers younger than 14 years old - according to the data children have more chance to survive in comparison with adult people, but for the adult people group, we can't provide an unambitious answer and the additional information is required.