General information
Isolation Forest is an unsupervised ensemble learning algorithm for anomaly detection that works on the principle of isolating anomalies in the leaves.
Isolation Forest isolates observations by randomly selecting a feature and then randomly selecting a split value between the minimum and maximum values of the selected feature.
The path length from the root node to the terminating node averaged over a forest of such random trees, is a measure of normality and our decision function.
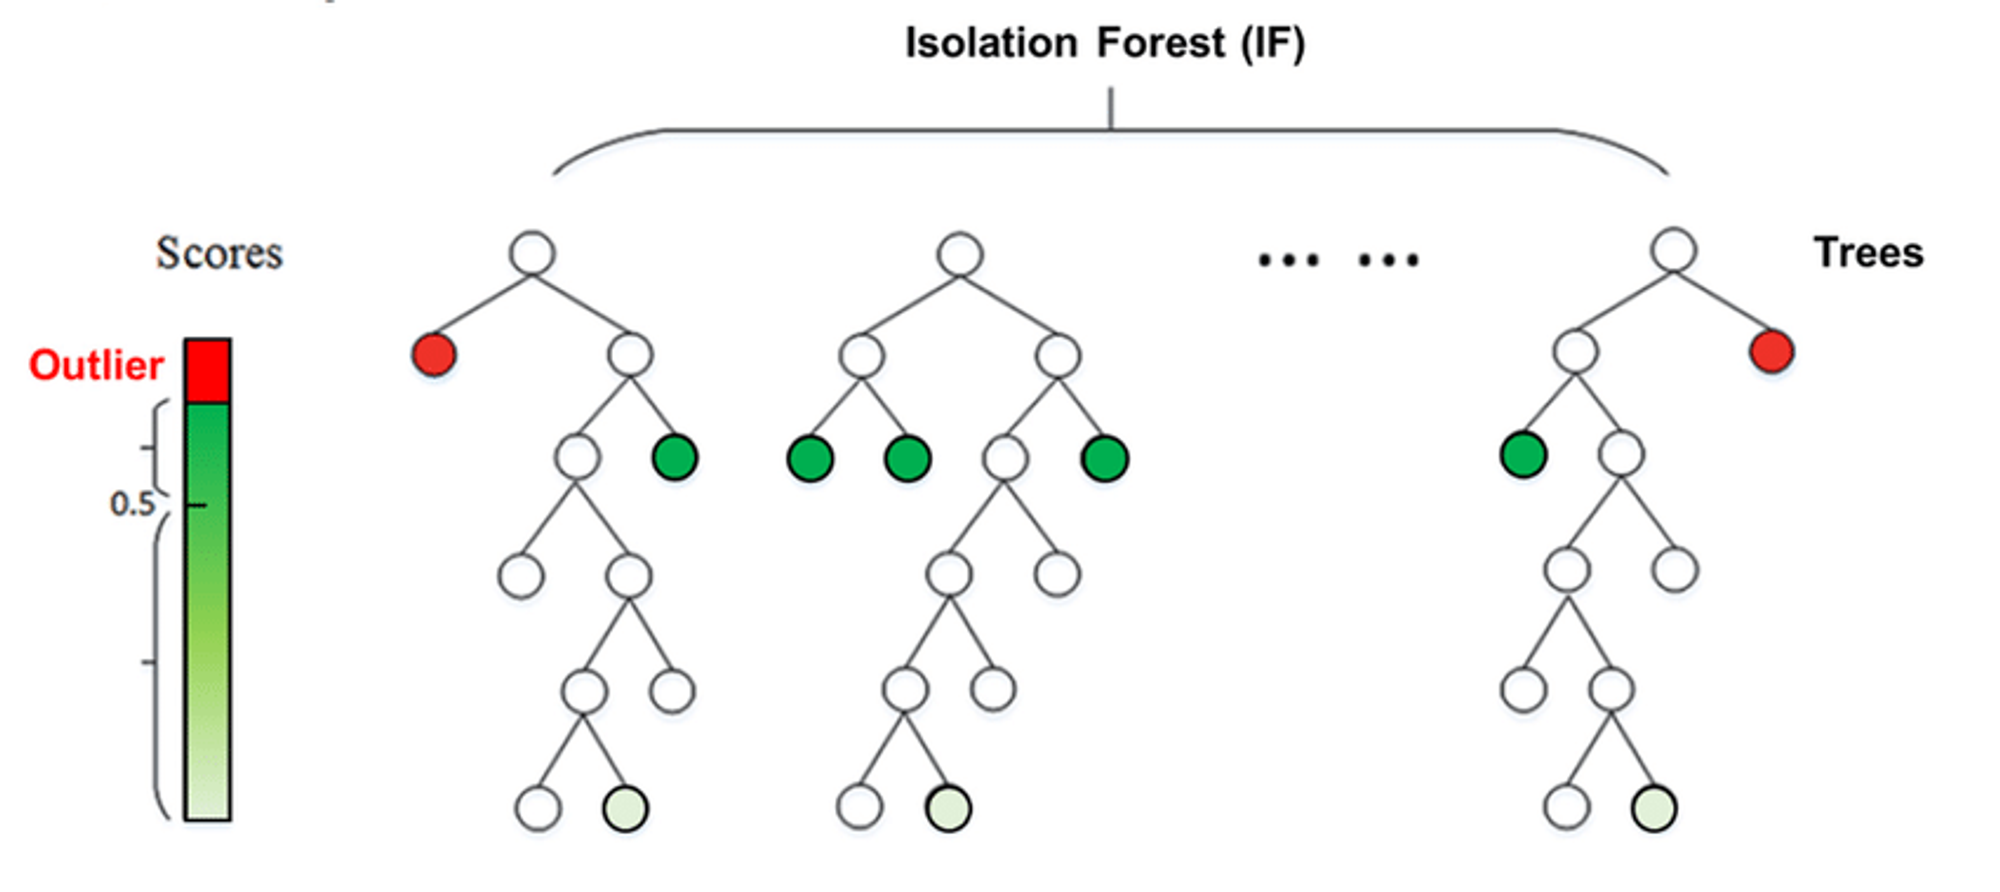
Random partitioning produces noticeably shorter paths for anomalies. Hence, when a forest of random trees collectively produces shorter path lengths for particular samples, they are very likely to be anomalies.
Description
Brick Locations
Bricks → Machine Learning → Isolation Forest
Brick Parameters
- Number of estimators
The number of base estimators in the ensemble (100 by default).
- Contamination
The amount of contamination of the dataset, i.e. the expected proportion of outliers in the dataset (0.1 by default).
- Columns
Columns from the dataset that are ignored by the algorithm. However, they will be present in the resulting set. Multiple columns can be selected by clicking the + button.
In case you want to remove a large number of columns, you can select the columns to keep and use the flag ‘Remove all except selected’.
Brick Inputs/Outputs
- Inputs
Brick takes the dataset
- Outputs
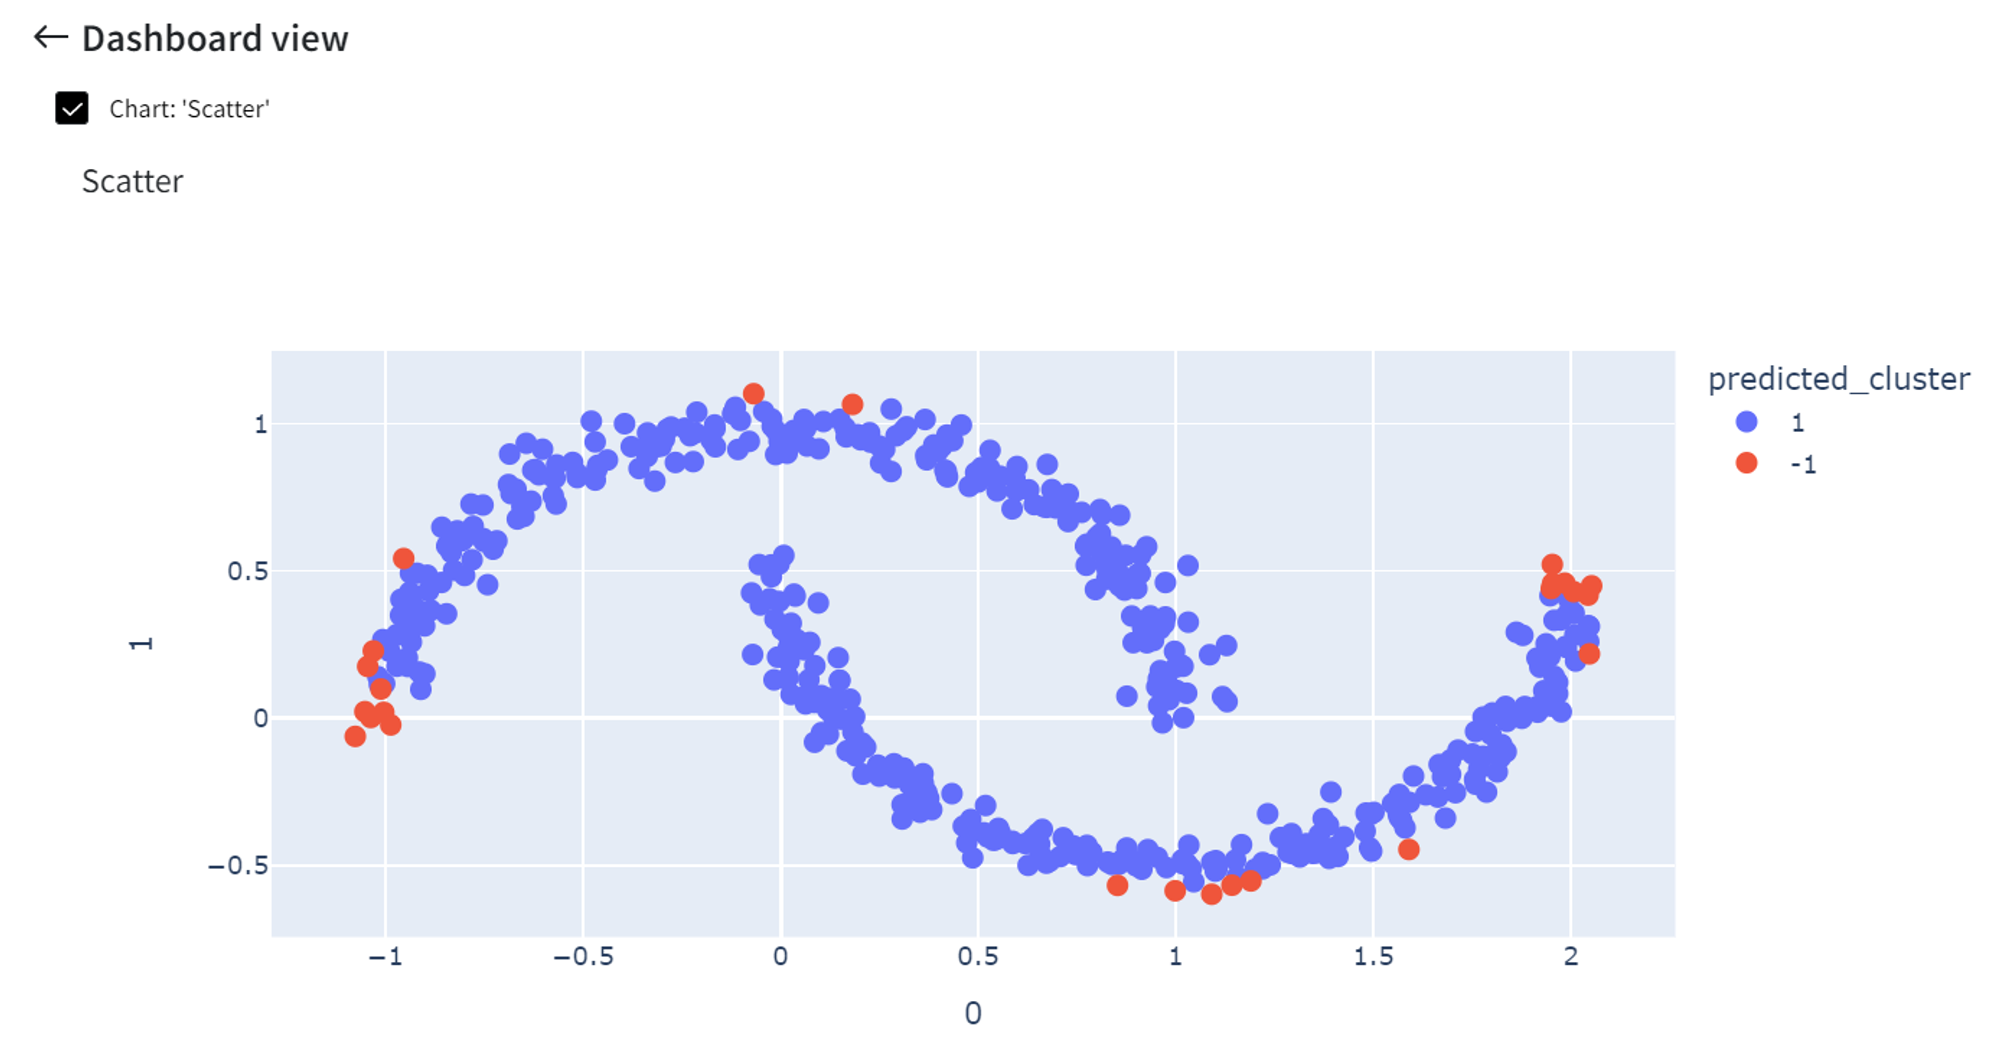
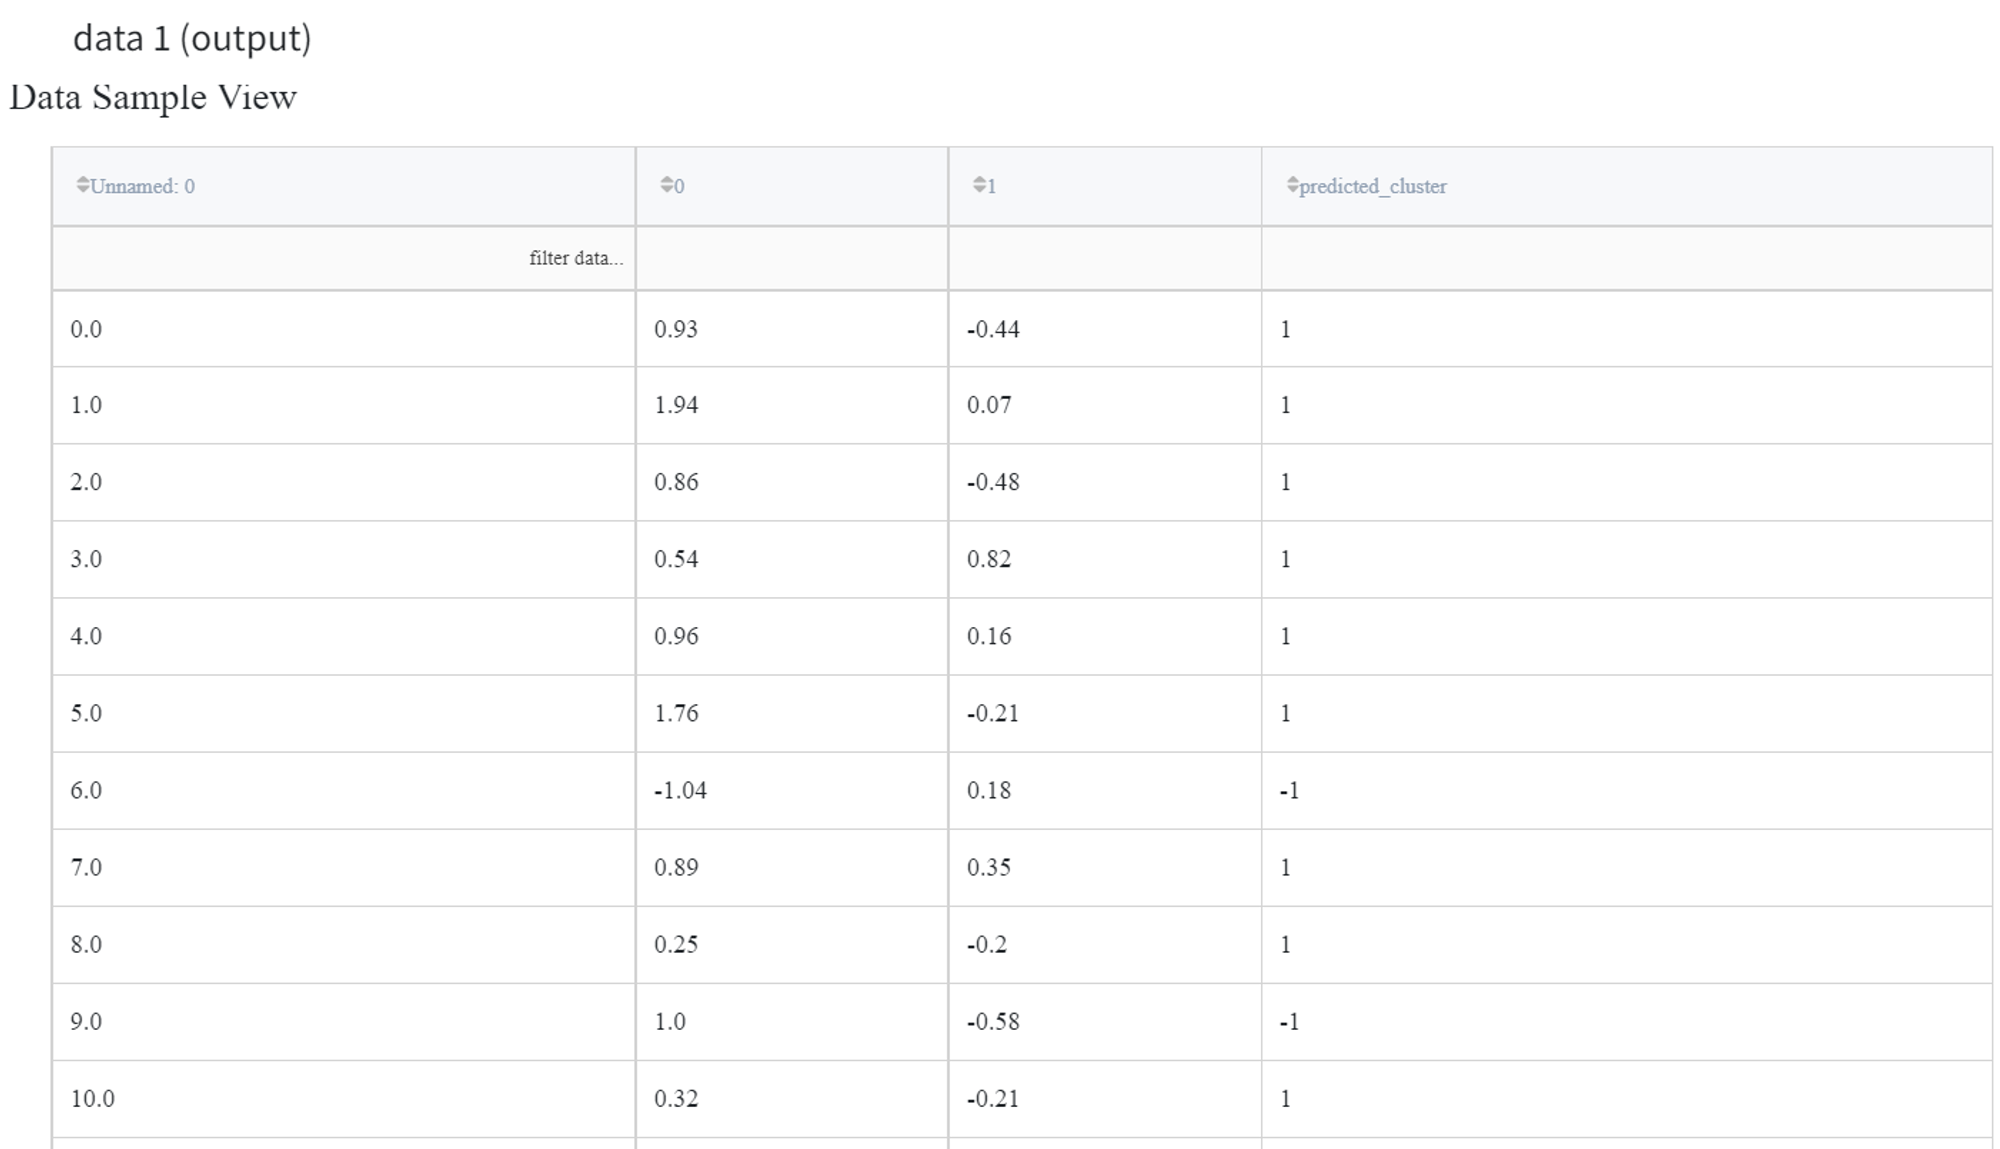
- Brick produces the dataset with an extra column called ‘predicted_cluster’, where cluster ‘-1’ indicates the outlier and ‘1’ is a normal point
- A model that can be used in other bricks as an input
Example of usage
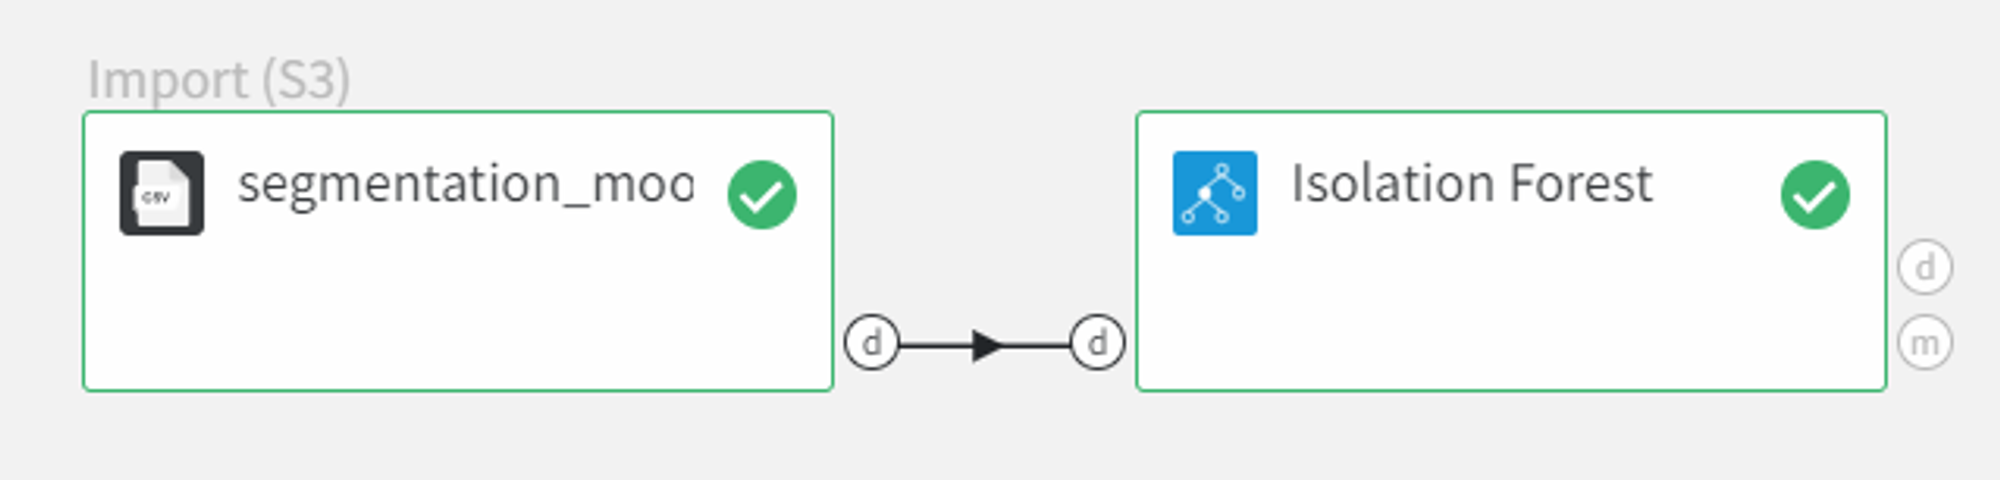
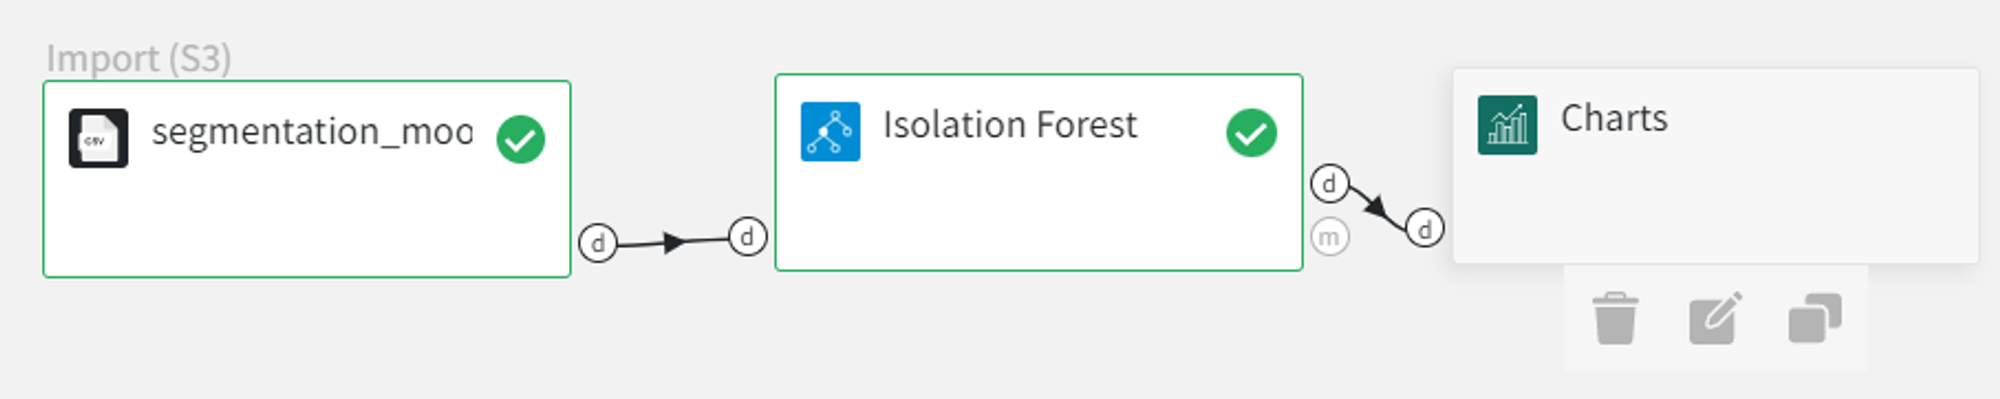
Let’s try to indicate anomalies in the data from the ‘segmentation_moons.csv’ dataset using the Isolation Forest algorithm. The dataset consists of 3 columns: ‘Unnamed: 0’, ‘0’ and ‘1’.
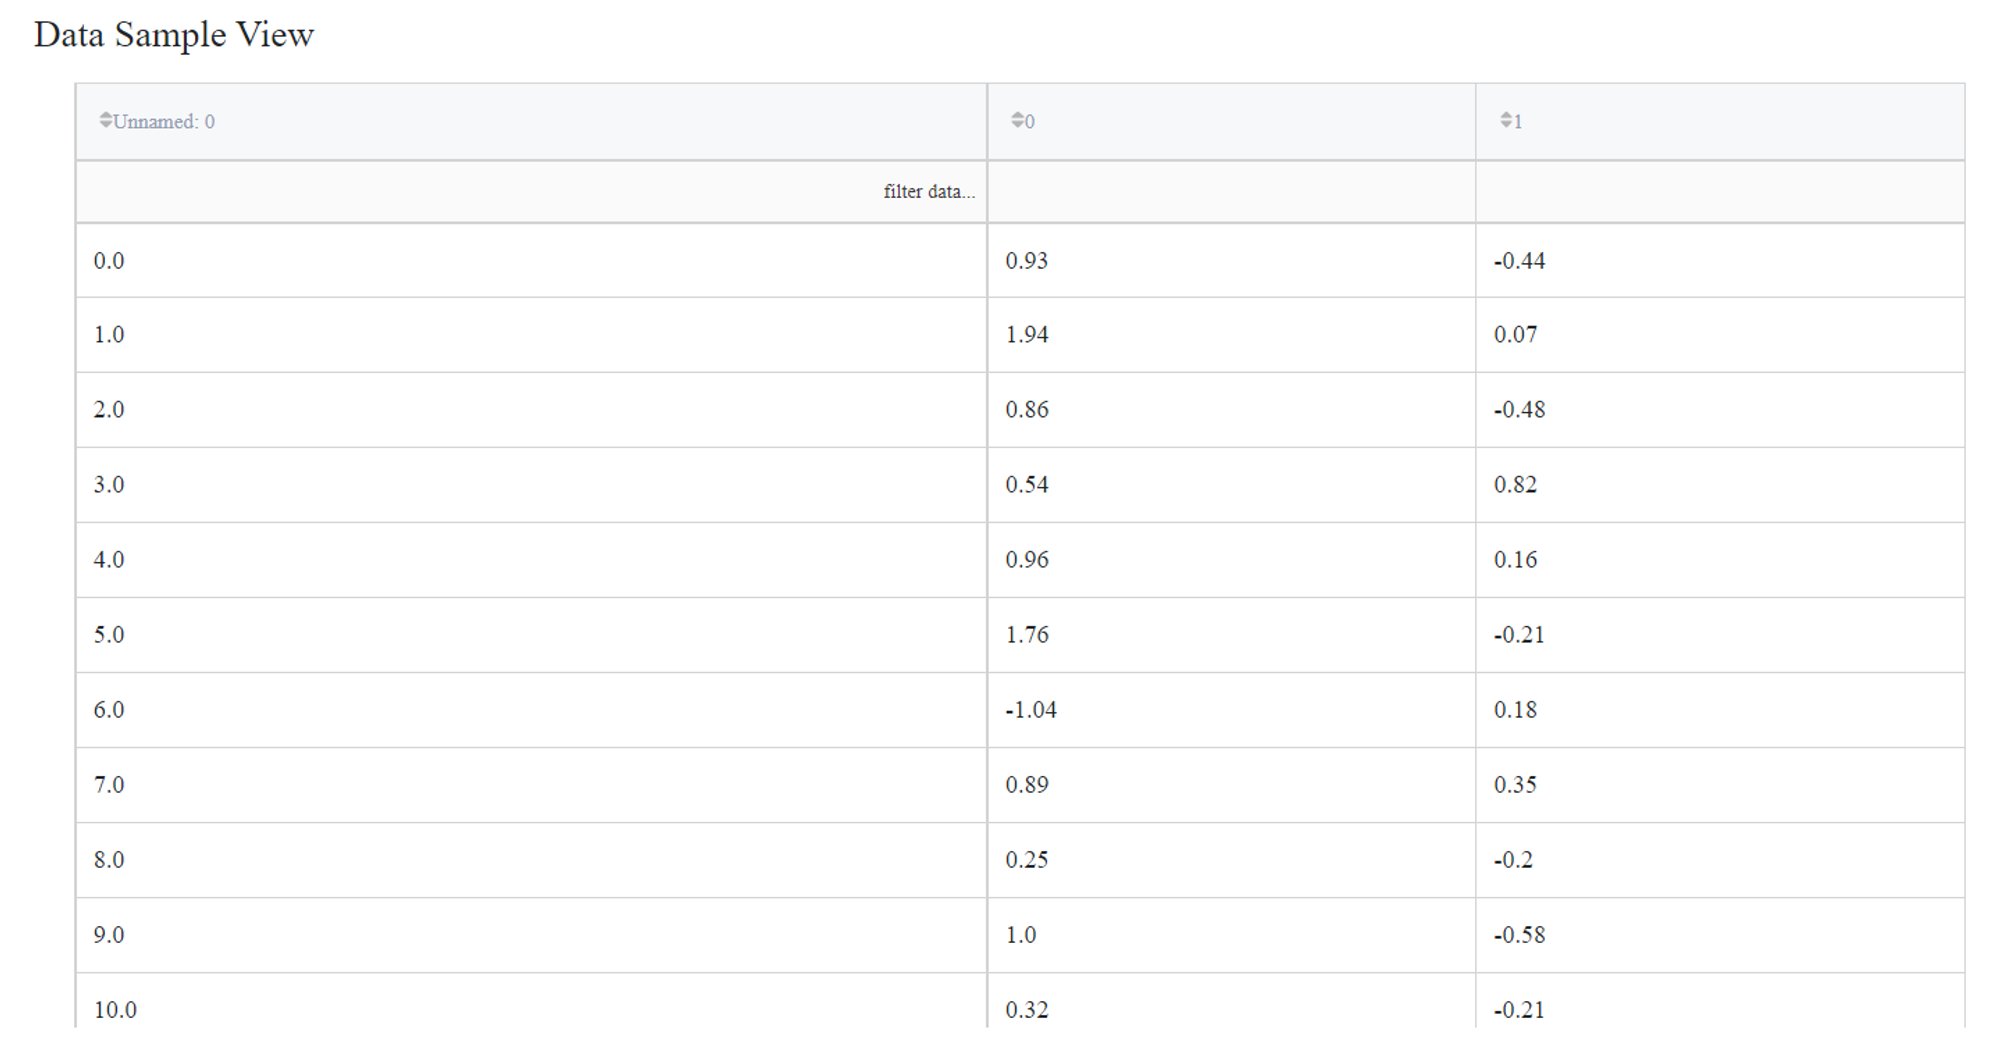
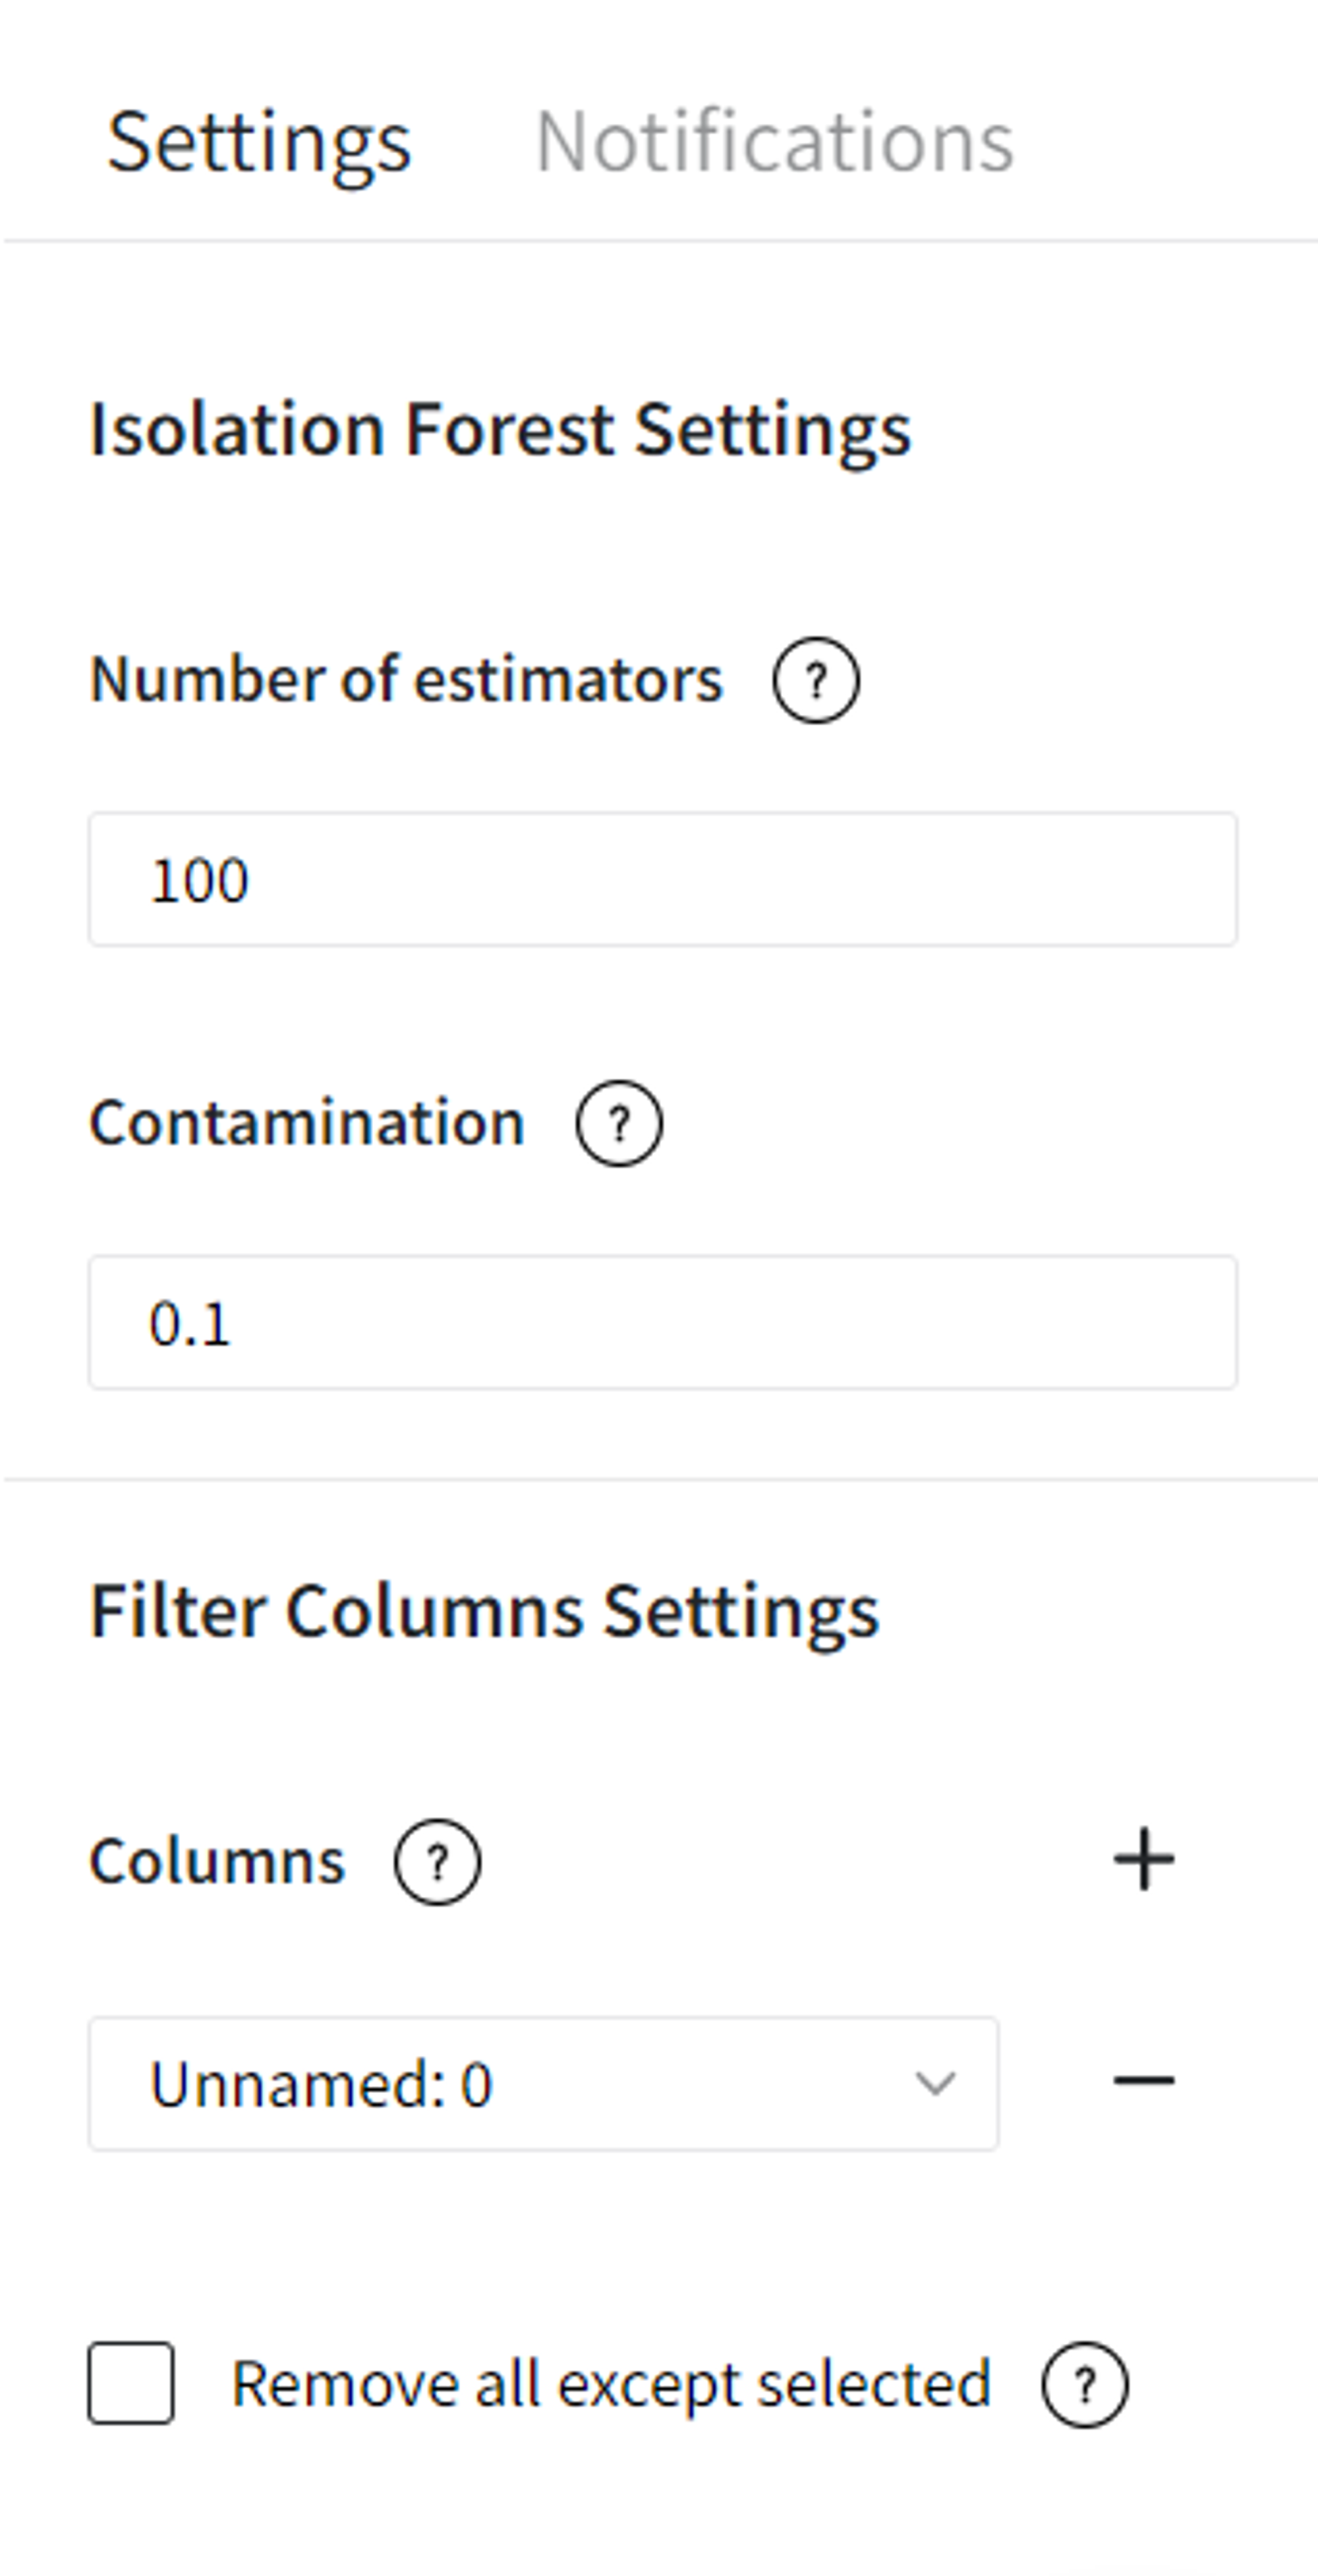
We can connect this dataset directly to the Isolation Forest Brick and leave the default parameter values for the ‘Number of estimators’ as 100 and the ‘Contamination’ equal to 0,1. Also, we should filter column ‘Unnamed: 0’ as it sets the index of the record and doesn’t represent any feature of the sample.
The output dataset looks like this:
We can visualize the model predictions using the Charts Brick with the following settings:
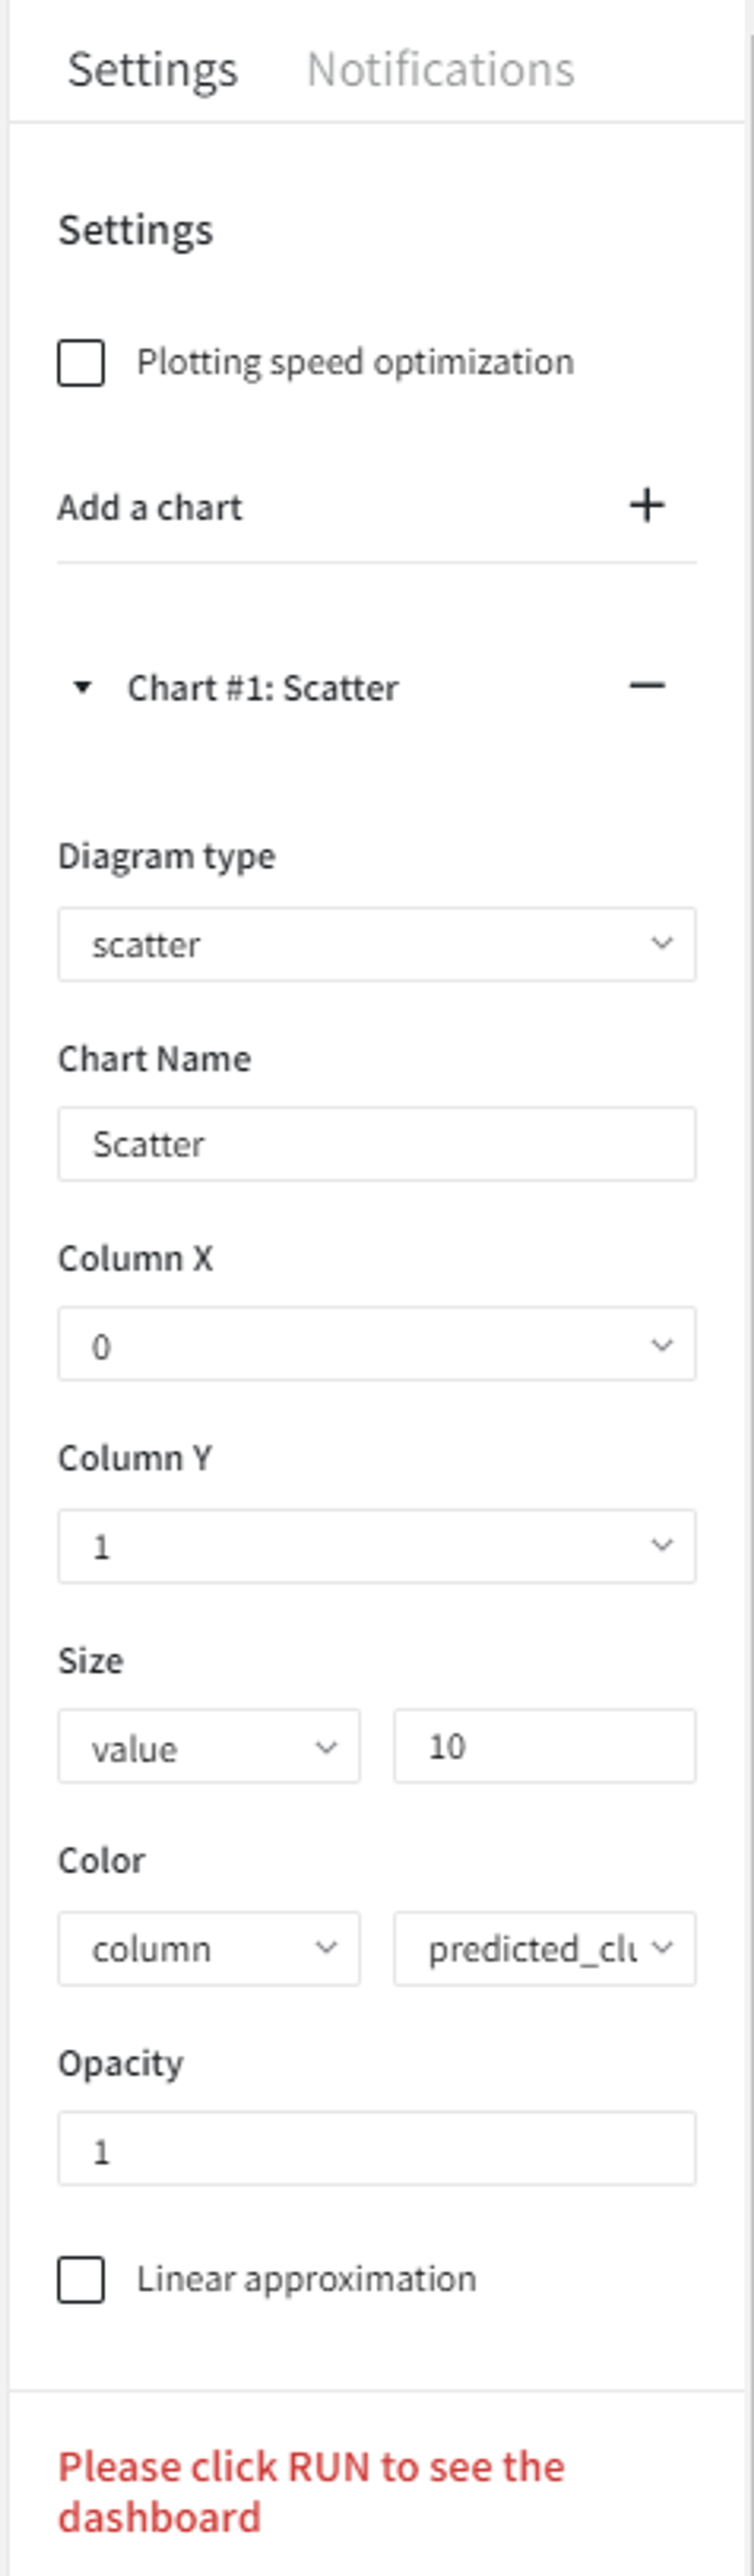
After running the pipeline we get a scatterplot with the predicted anomalies.
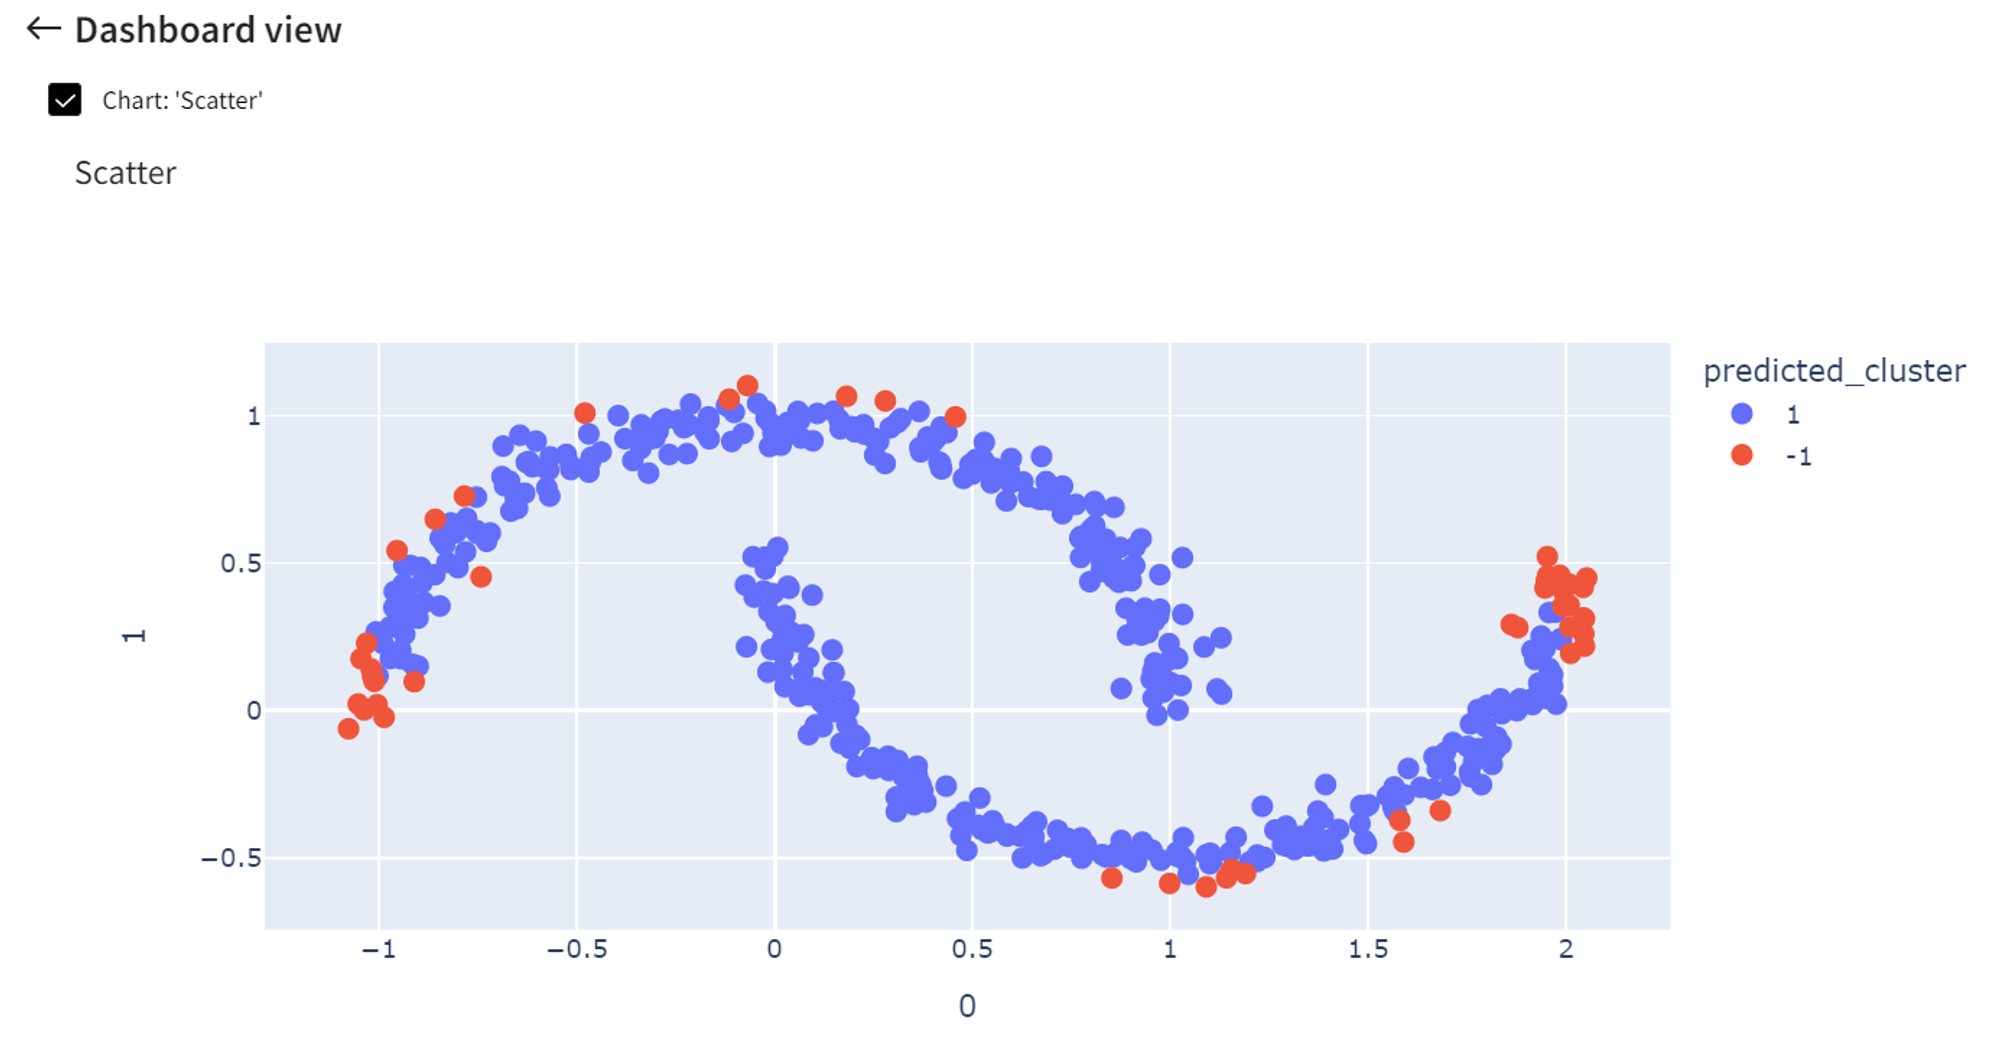
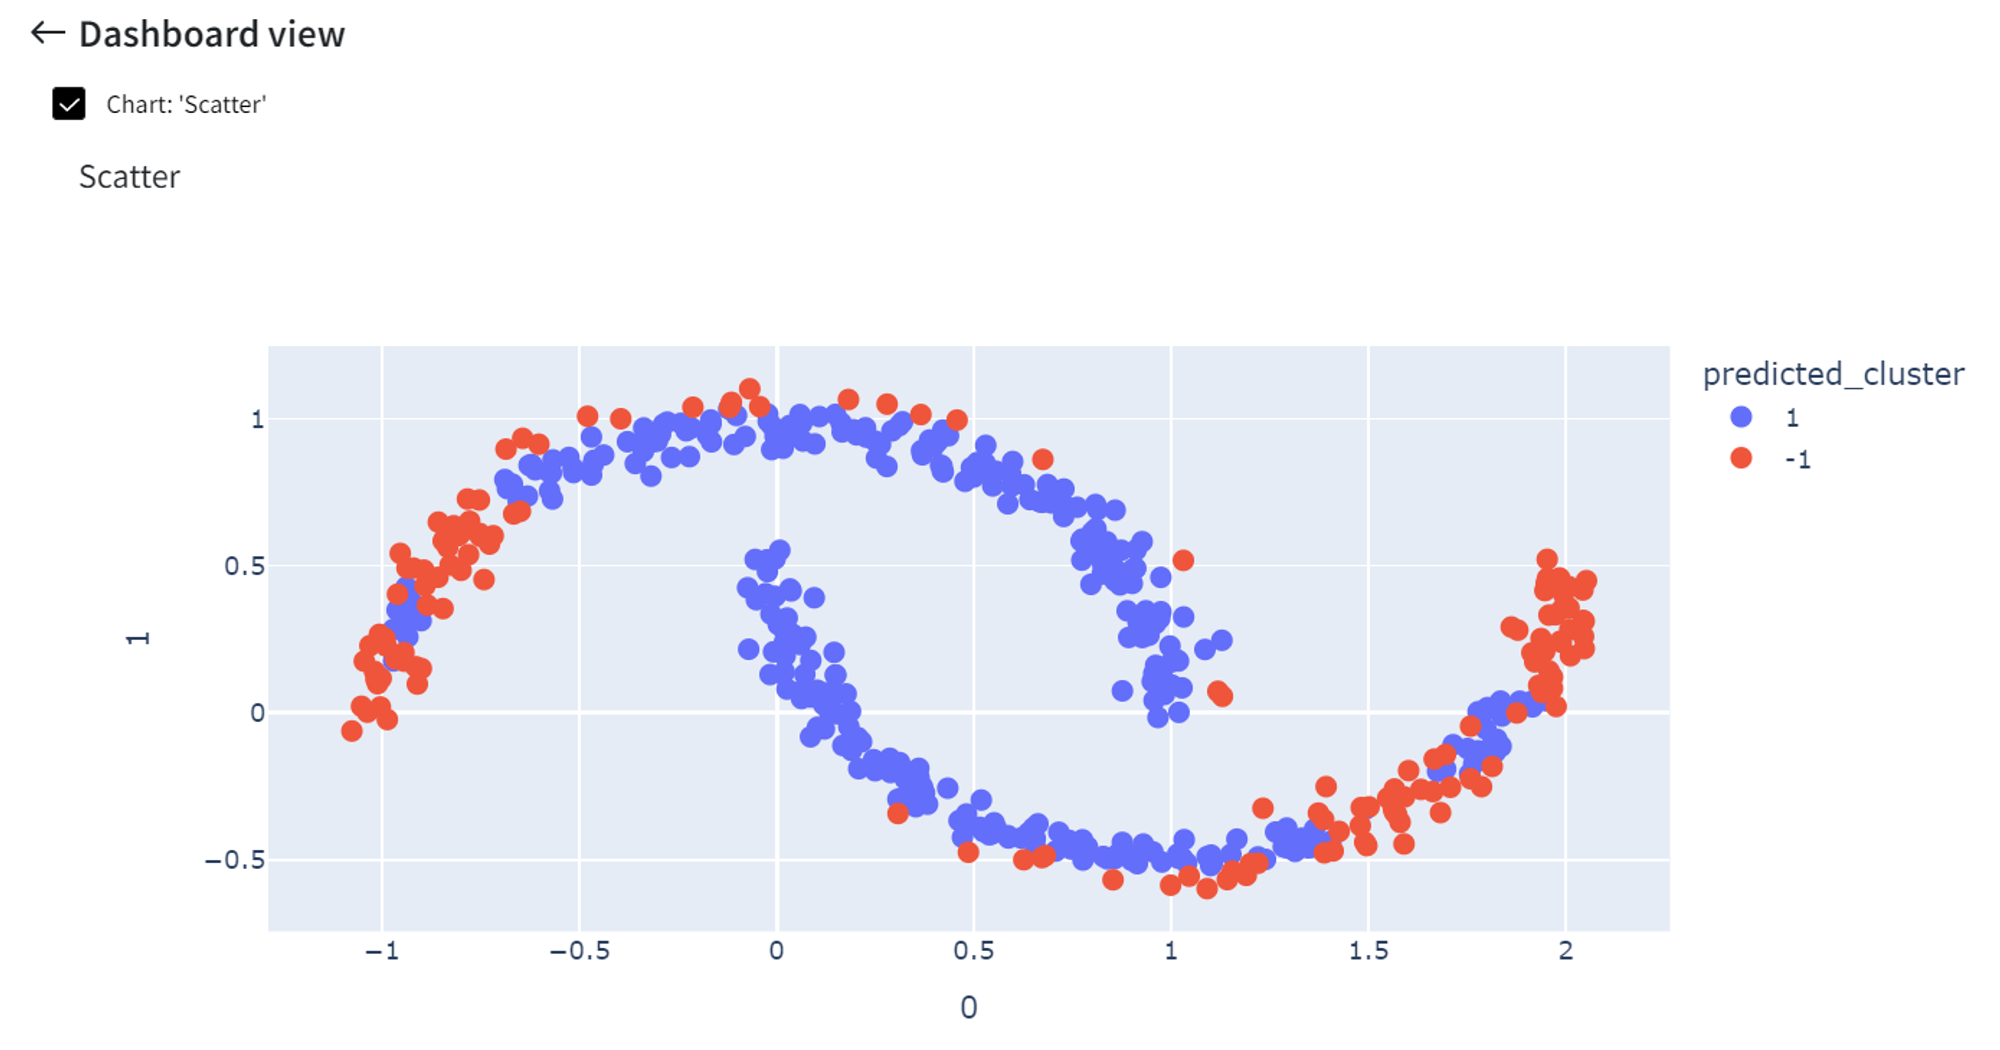
Increasing the ‘Contamination’ rate to 0.3 will cause more points to be indicated as anomalies.
On the other hand, if ‘Contamination’ is a small number like 0.05, fewer points are highlighted as anomalies.