General information
Linear regression is one of the simplest ML models for regression tasks. Its main principle is in finding linear dependence between one dependent and multiple independent variables (features).
Linear Regression fits a linear model with coefficients to minimize the residual sum of squares between the observed targets in the dataset, and the targets predicted by the linear approximation.
Description
Brick Locations
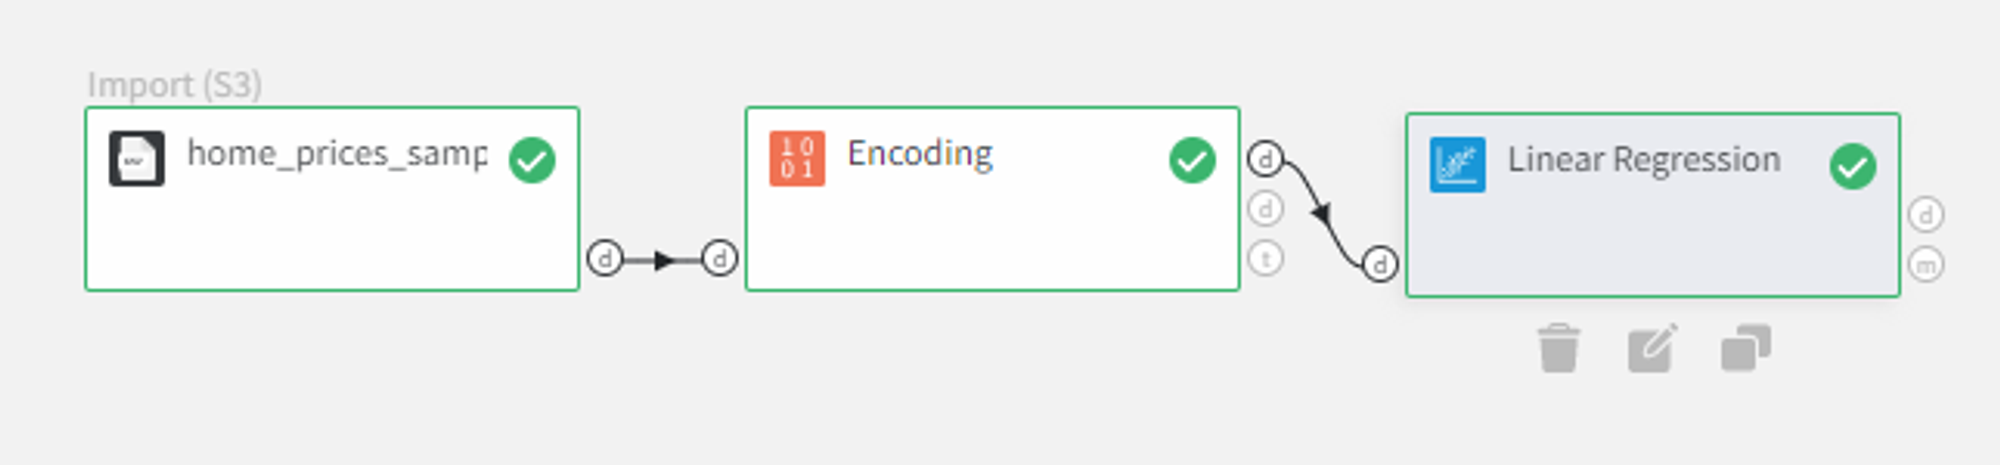
Bricks → Machine Learning → Linear Regression
Brick Parameters
Simple mode
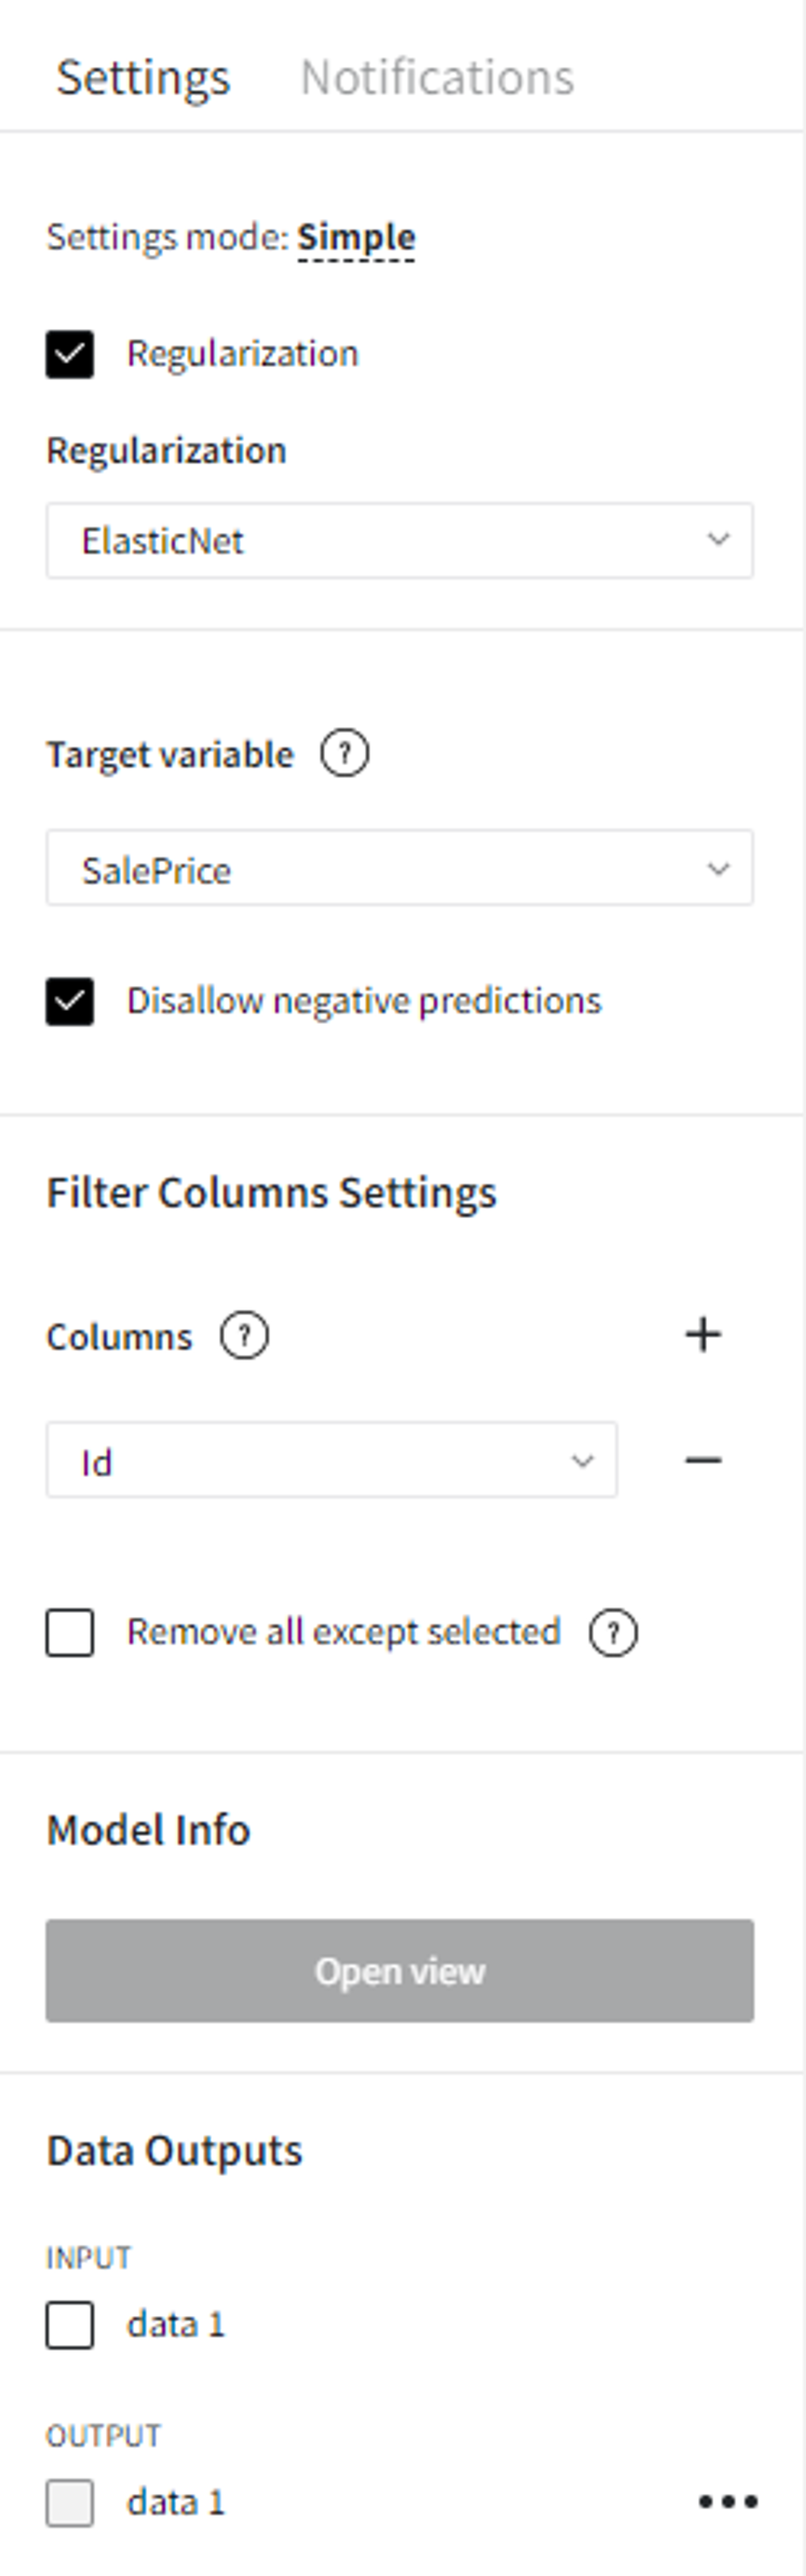
- Regularization
- Lasso Regression (L1) Least Absolute Shrinkage and Selection Operator, is a type of linear regression that uses shrinkage. Shrinkage is where data values are shrunk towards a central point like “mean”. The lasso procedure encourages simple, sparse models (i.e. models with fewer parameters). This particular type of regression is well-suited for models showing high levels of multicollinearity or when you want to automate certain parts of model selection, like variable selection/parameter elimination. The cost function for Lasso regression is:
- Ridge Regression (L2) - (also known as Tikhonov regularization), ridge regression shrinks the coefficients and it helps to reduce the model complexity and multi-collinearity
- ElasticNet - linearly combines both the L1 and L2 penalties of the Lasso and Ridge methods.
Regularization is a technique used for tuning the function by adding a penalty term in the error function, which reduces overfitting. The model supports the following types of regularization:
- Target variable
The column which contains values for the model to predict.
- Disallow negative predictions
This checkbox forces the model to round up negative values to be equal to 0.
- Columns
Columns from the dataset that are ignored during training. However, they will be present in the resulting dataset. Multiple columns can be selected by clicking the + button.
In case you want to remove a large number of columns, you can select the columns to keep and use the flag ‘Remove all except selected’.
Advanced mode
Has the same set of parameters as in the simple mode with one additional parameter:
- Train Explainer
If checked, the model explainer for API usage is built.
Brick Inputs/Outputs
- Inputs
Brick takes the dataset
- Outputs
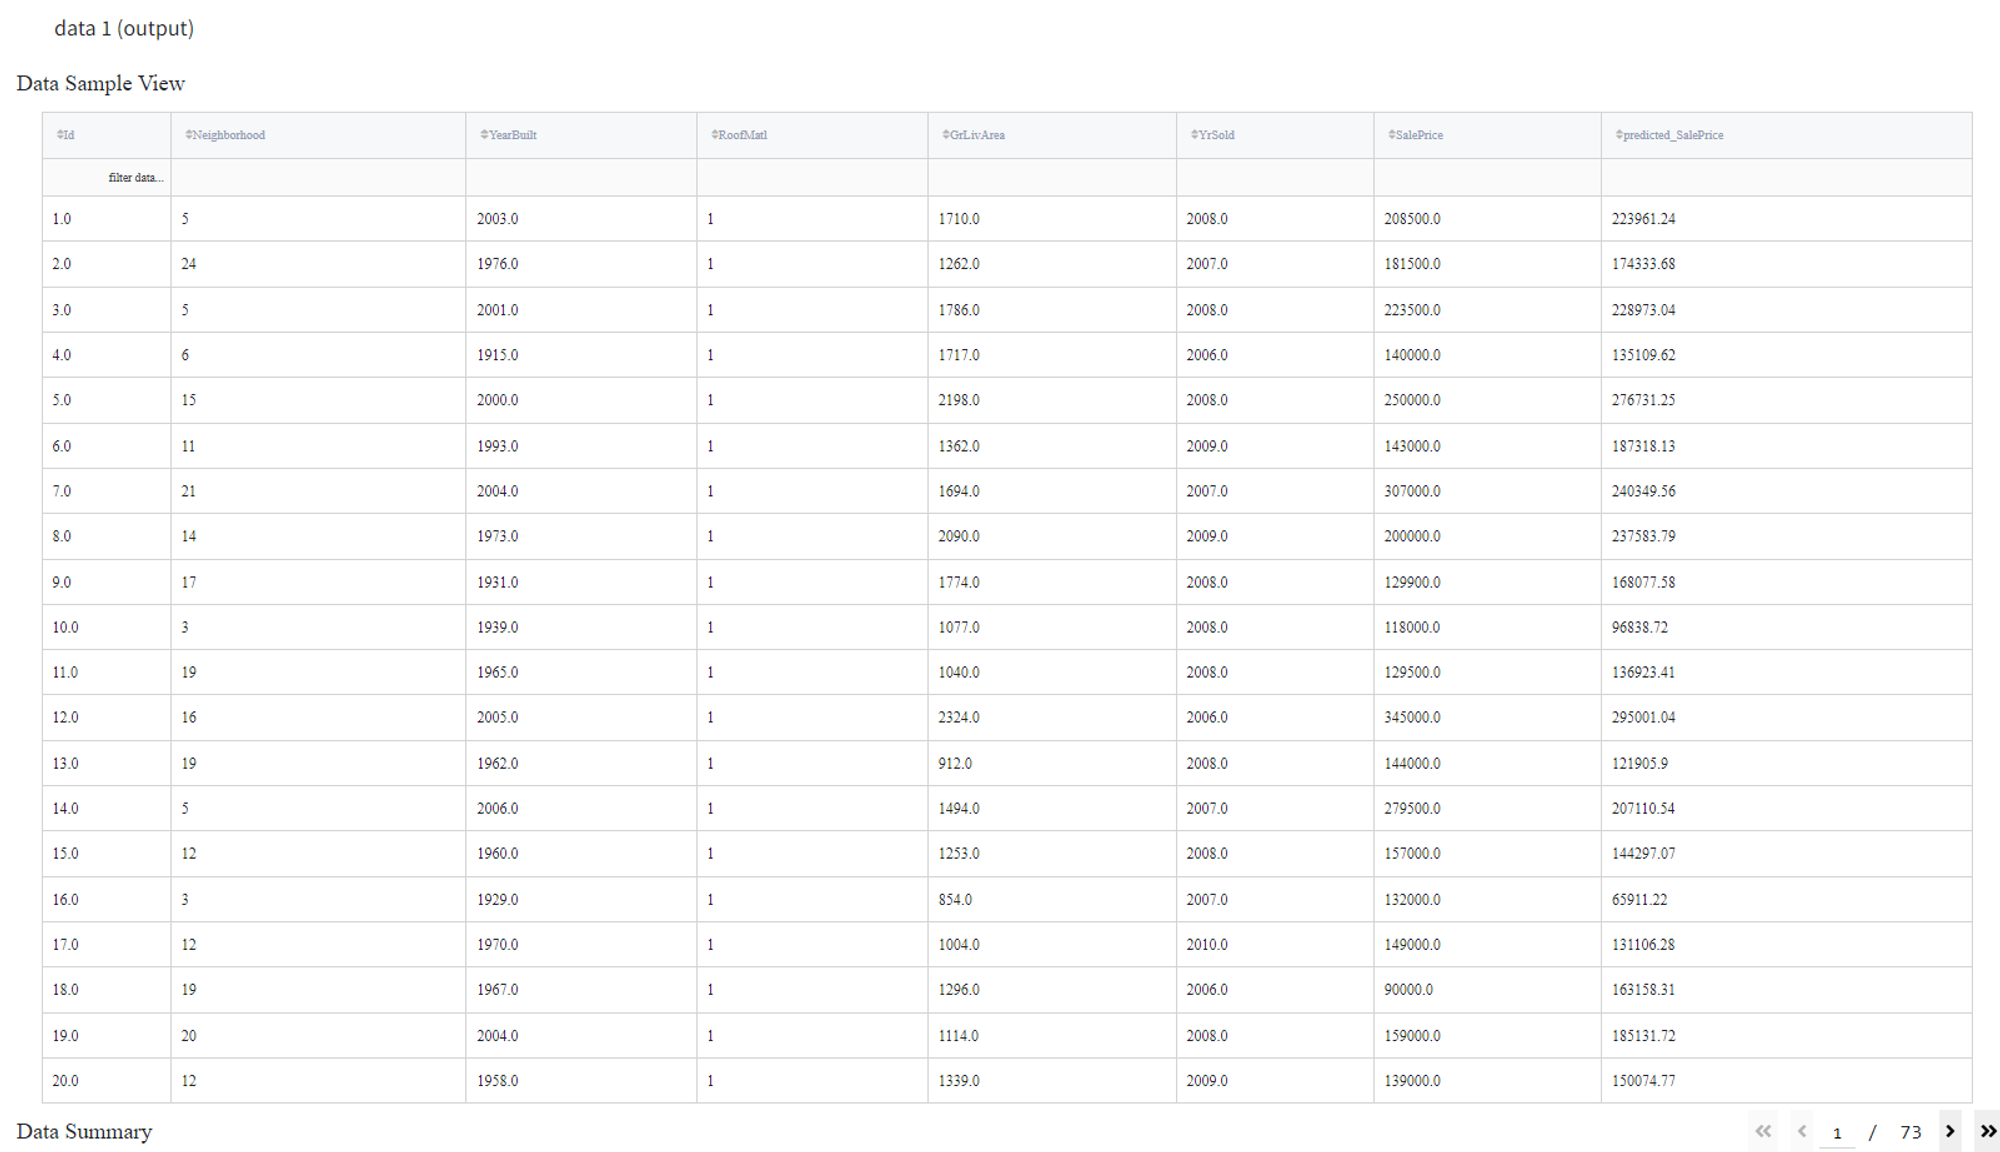
- Brick produces the dataset with an extra column for predicted target value by the model
- A trained model that can be used in other bricks as an input
Additional Features
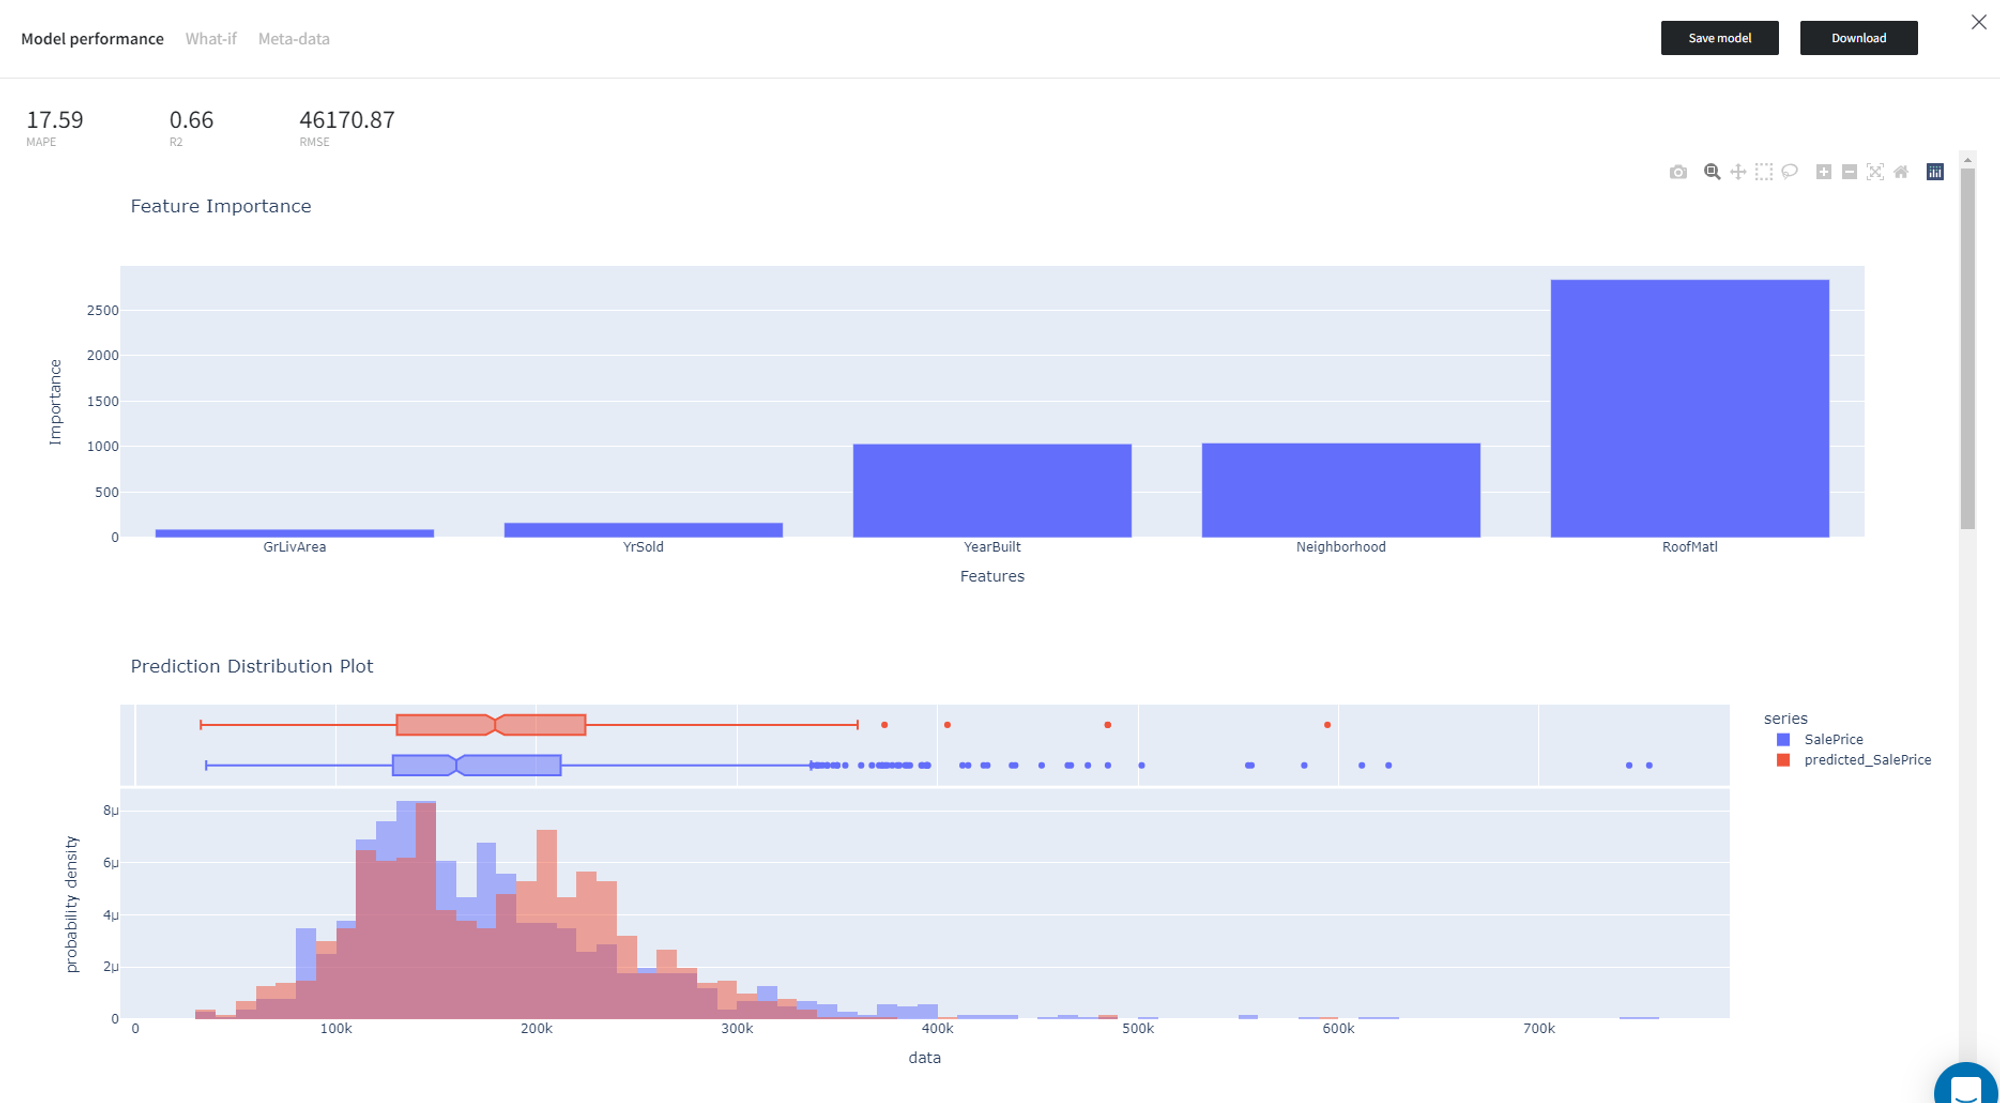
- Model performance
Gives you a possibility to check the model's performance (a.k.a. metrics) to then adjust your pipeline if needed. Available after successful brick run.
Supported metrics: MAPE (Mean Average Percentage Error), R2, RMSE (Root Mean Square Error).
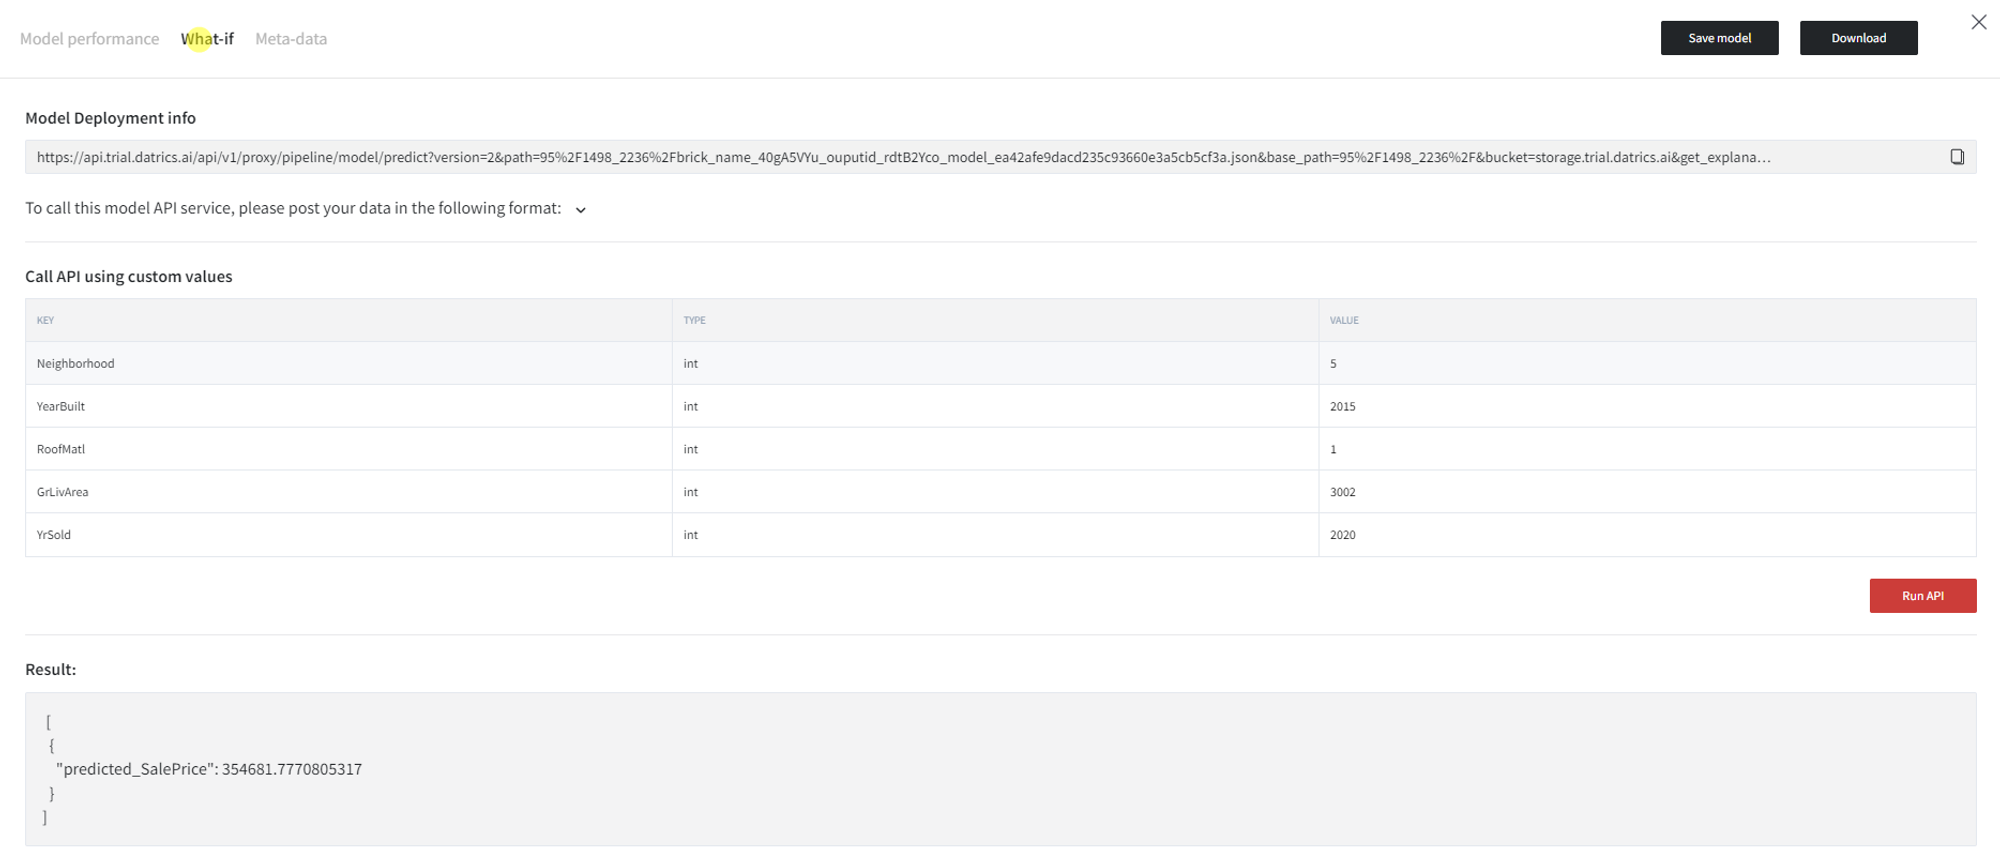
- What-if
This option gives access to the information for the Model Deployment service, as well as a possibility to call API using custom values.
- Meta-data
Access metadata for the pipeline.
- Save model
This option provides a mechanism to save your trained models to use them in other projects.
- Download
Use this feature, if you want to download the model's asset in JSON format to use it outside the Datrics platform.
Example of usage
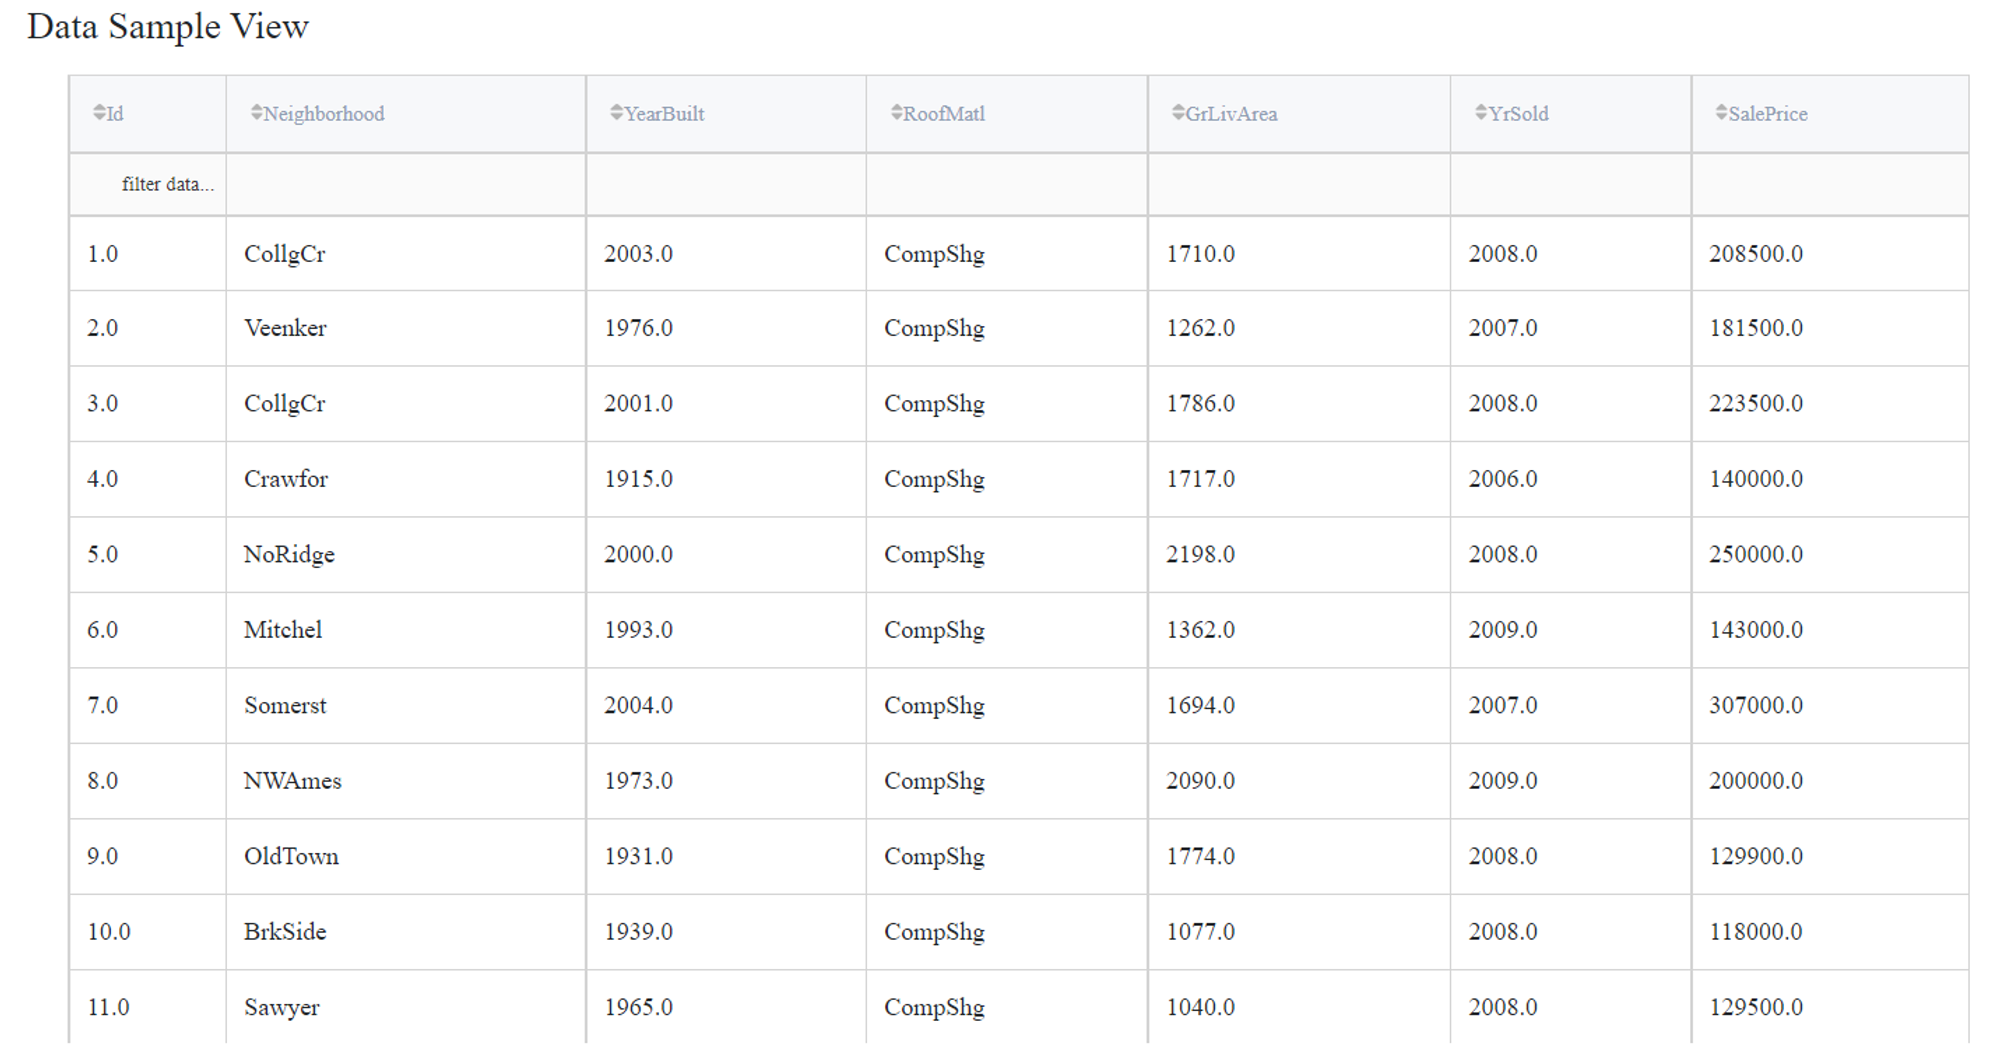
Let's consider a simple regression problem, where we know the characteristics of some houses and want to know their sale price. The dataset ‘home_prices_sample.csv’ contains the next variables:
- Id (category/int) - Sale's ID
- Neighborhood (category/string) - House neighborhood name
- YearBuilt (int) - The year when a house has been built
- RoofMatl (category/string) - The materials used to construct the roof
- GrLivArea (int) - The living area
- YrSold (int) - The year when a house was sold
- SalePrice (int) - The price at which the house was sold - target variable.
Linear Regression model supports only numerical values in the input dataset. In this case, columns ‘Neighborhood’ and ‘RoofMatl’ are strings, so that they can be turned into labels with the Encoding Brick. Apart from it, column ‘Id’ does not represent the characteristics of the house, so it will be filtered out during the training.
As for the model parameters, let’s check ‘Regularization’ with ElasticNet, set ‘SalePrice’ to be the target variable, check ‘Disallow negative predictions’ to ensure that predictions will not be less than 0, and filter the ‘Id’ column.
After running the pipeline we can view the output dataset in the Data Outputs section.
To see the model's performance, click the ‘Open view’ button on the Model Info panel.
In the ‘What-if’ tab, you can write down some custom parameters to the model and click ‘Run API’ to generate the prediction.
Also, you can save your trained model to reuse it later in other projects. For this, click on the ‘Save model’ and specify the model's name or you can create a new version of an already existing model (you will need to choose the existing model and specify the new version's name), and, finally, submit with the ‘Save’ button.