General information
The brick provides a possibility to create your own logistic regression model to solve classification problems. The logistic regression model uses the logistic function to squeeze the output of a linear equation between 0 and 1. The logistic function is defined as:
This model can help you predict the likelihood of an event happening or a choice being made. For example, you may want to know the likelihood of a visitor choosing an offer made on your website — or not. Logistic model in our interpretation is used to solve binary classification problem.
Description
Brick Location
Bricks → Machine Learning → Logisitc Regression
Brick Parameters
Simple mode
- Regularization
- Lasso Regression (L1) - Least Absolute Shrinkage and Selection Operator, is a type of linear regression that uses shrinkage. Shrinkage is where data values are shrunk towards a central point like “mean”. The lasso procedure encourages simple, sparse models (i.e. models with fewer parameters). This particular type of regression is well-suited for models showing high levels of multicollinearity or when you want to automate certain parts of model selection, like variable selection/parameter elimination. The cost function for Lasso regression is:
- Ridge Regression (L2) - (also known as Tikhonov regularization), ridge regression shrinks the coefficients and it helps to reduce the model complexity and multi-collinearity
Optional parameter for regularization where you can choose between L1 and L2 terms. L1 and L2 terms are regularization techniques to prevent model overfitting. The main idea is quite simple we just add another term to our cost function both regularization presented below:
Regularization is a technique used for tuning the function by adding penalty term in the error function, which helps overcome overfitting. The model supports the next types of regularization:
- Balancing
There are three options for balancing parameter: none, auto, weighting. This parameter helps to balance your classes so that they become equal or at least close to equal. In case of choosing none or auto there is no need to do anything else but when you choose weighting it engage you to also choose a column with weights.
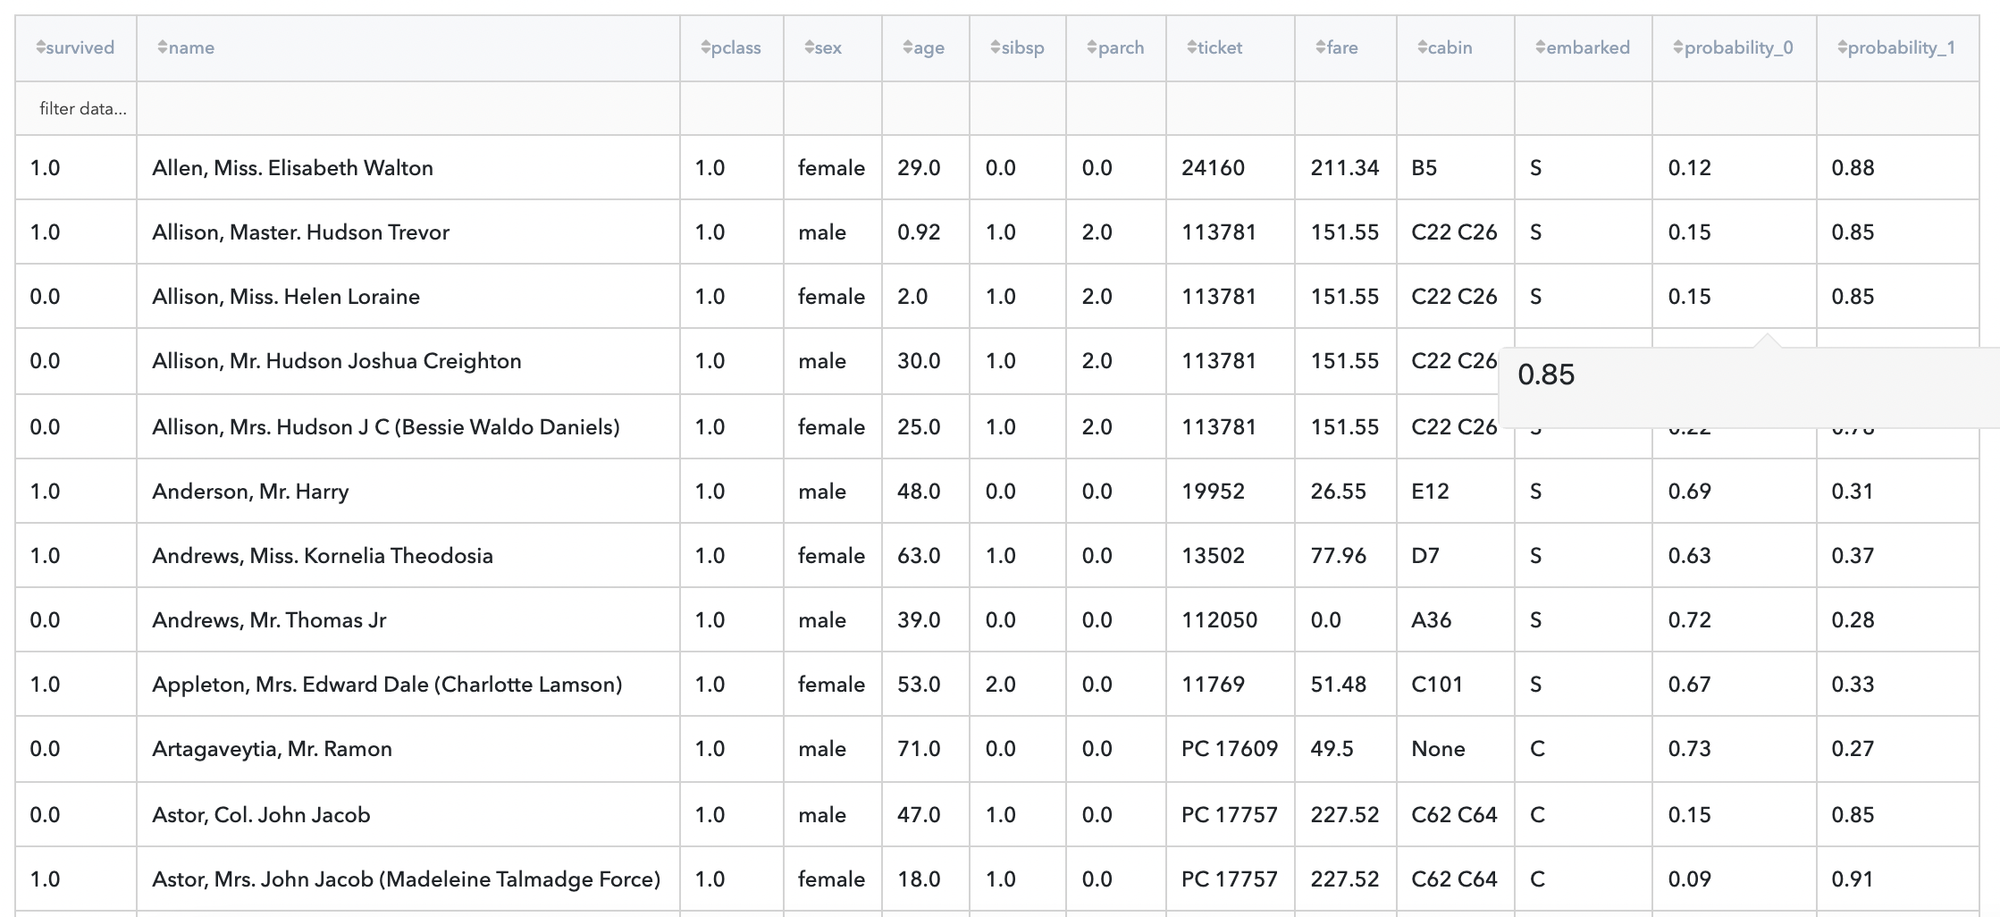
- Class/Probability of class
There is an option where you can choose output as a class predicted or probability of class.
- Target variable
Parameter to choose target column from all columns so that the model can learn how to classify objects.
- Filter column setting (columns)
If you have columns in your data that need to be ignored (but not removed from the data set) during the training process (and later during the predictions), you should specify them in this parameter. To select multiple columns, click the '+' button in the brick settings.
In addition, you can ignore all columns except the ones you specified by enabling the "Remove all except selected" option. This may be useful if you have a large number of columns while the model should be trained just on some of them.
Advanced mode
Looks the same except there are two more parameters to control:
- Optimization mode
There is Recursive Features Elimination that we help to deal with useless features in your data
- Train Explainer
It is parameter that will build model explainer for API usage, you can learn more deatails here.
Additional Features
- What-if This option gives access to the information for the Model Deployment service, as well as a possibility to call API using custom values.
- Model Performance
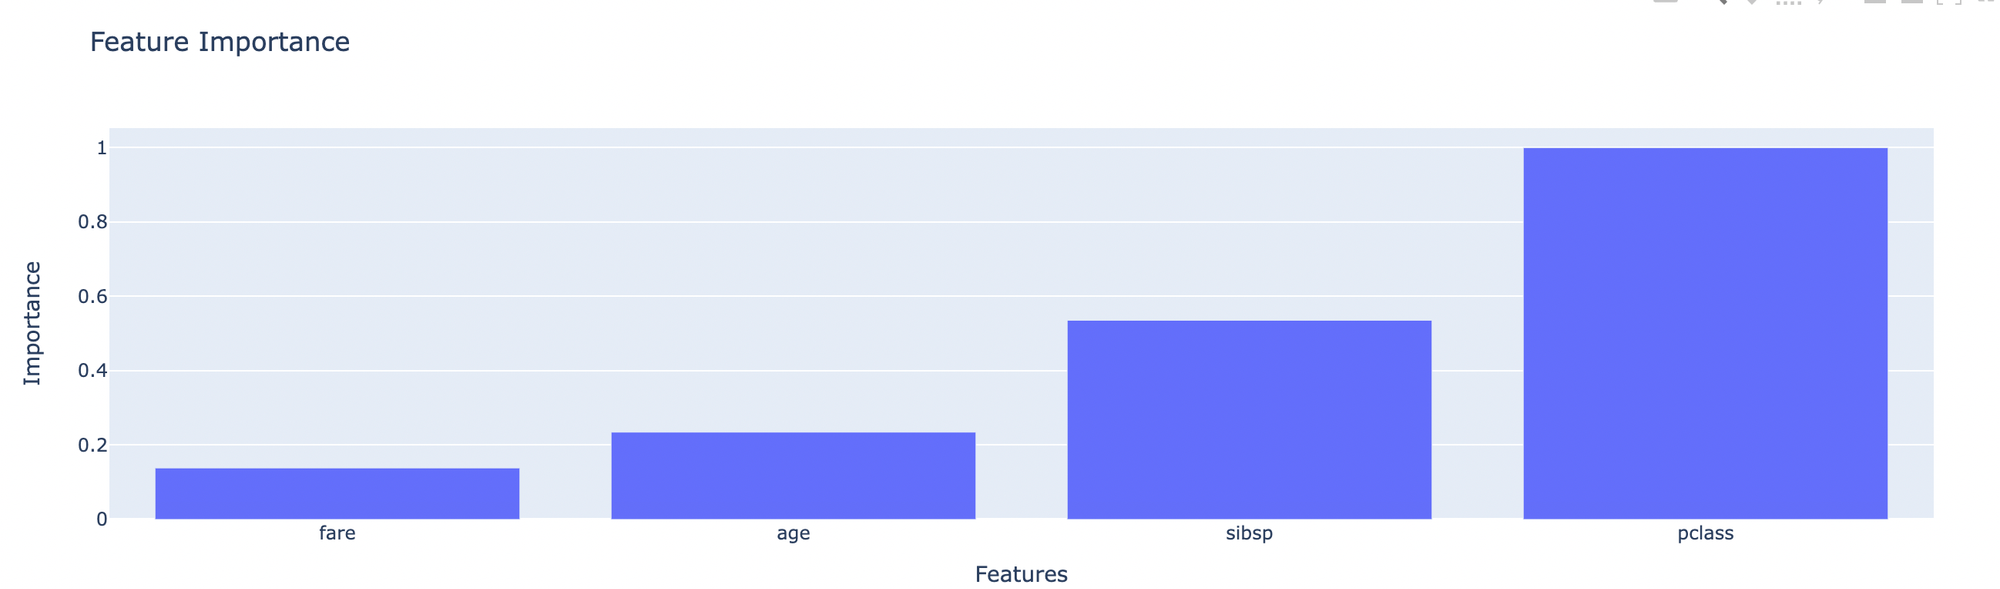
- Feature Importance - shows how many influence each feature has for final prediction
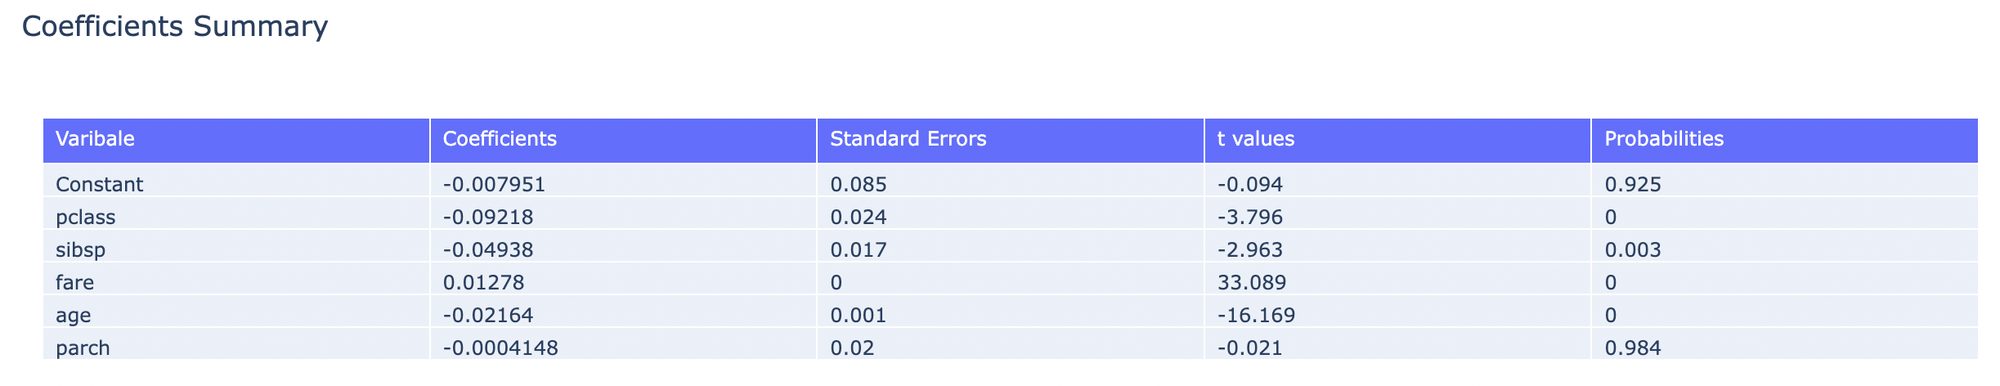
- Coefficients Summary - matrix of some coefficients for some features
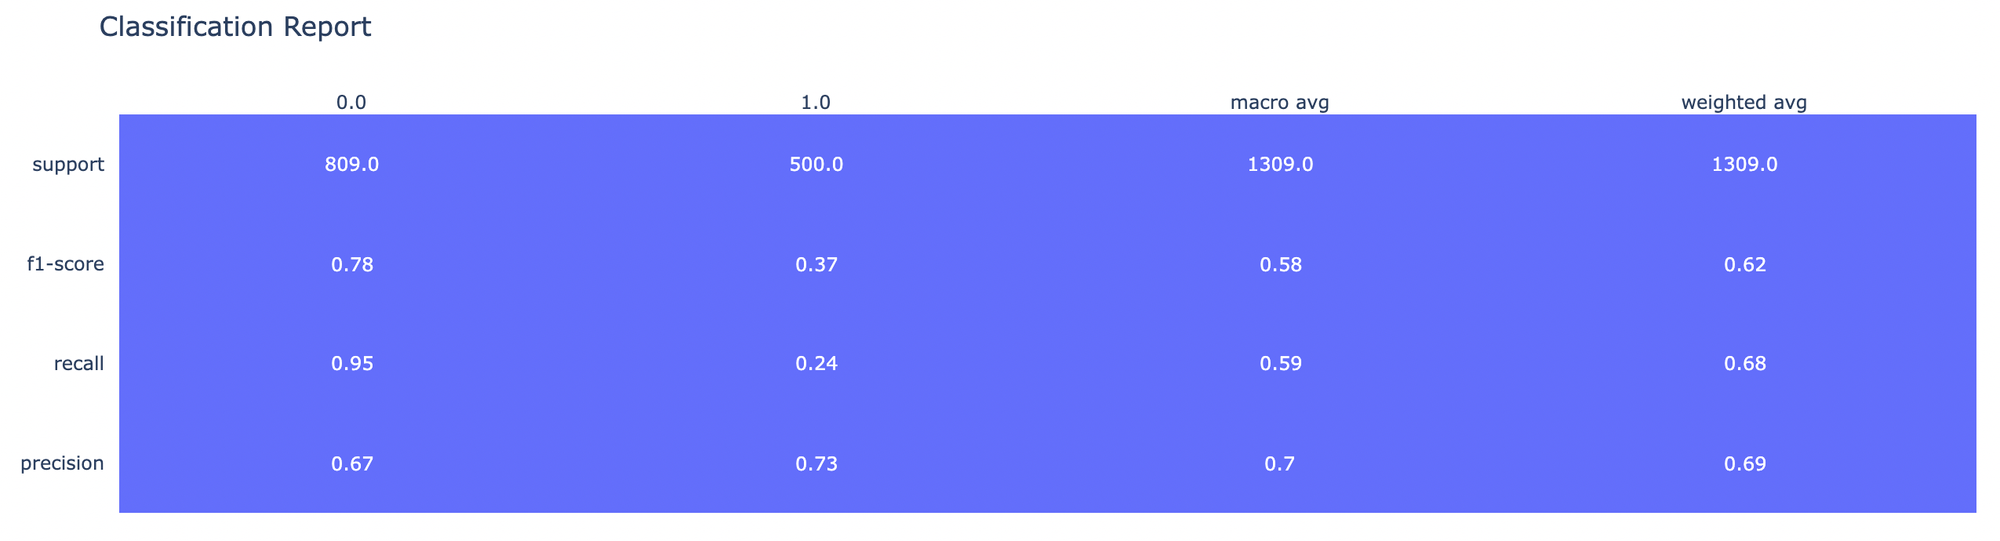
- Classification Report - stats for classification results
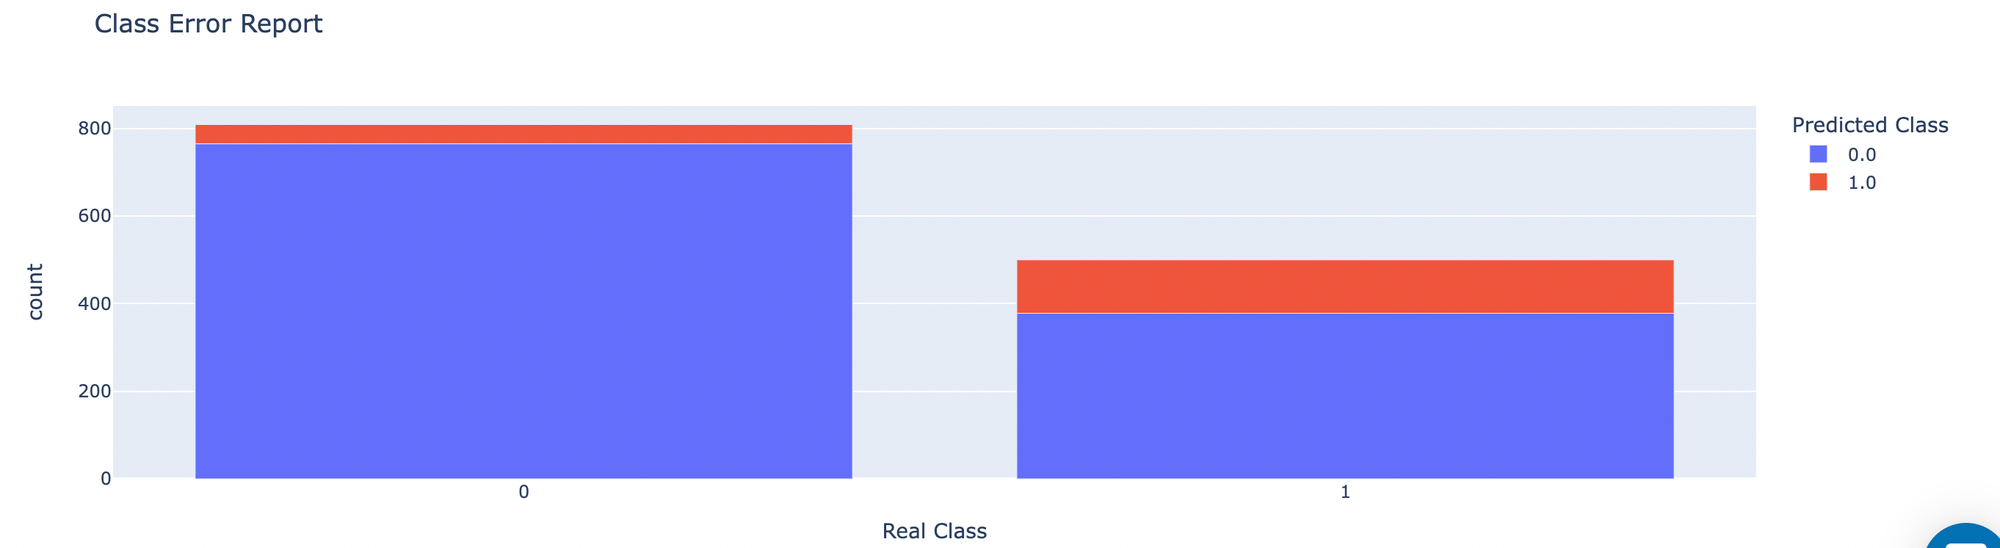
- Class Error Report - shows histogram of errors
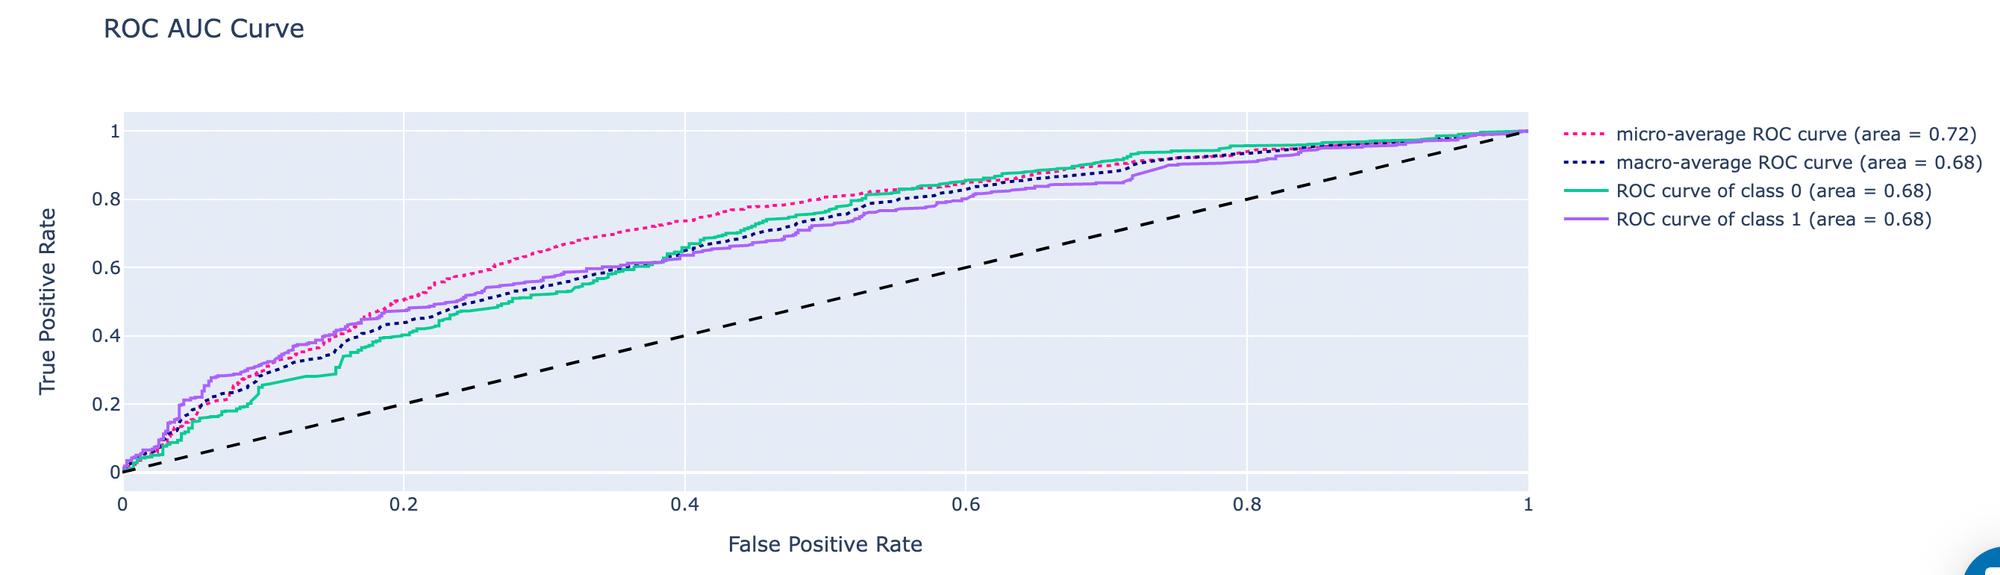
- ROC AUC Curve - ROC metric is generally good for measuring model performance
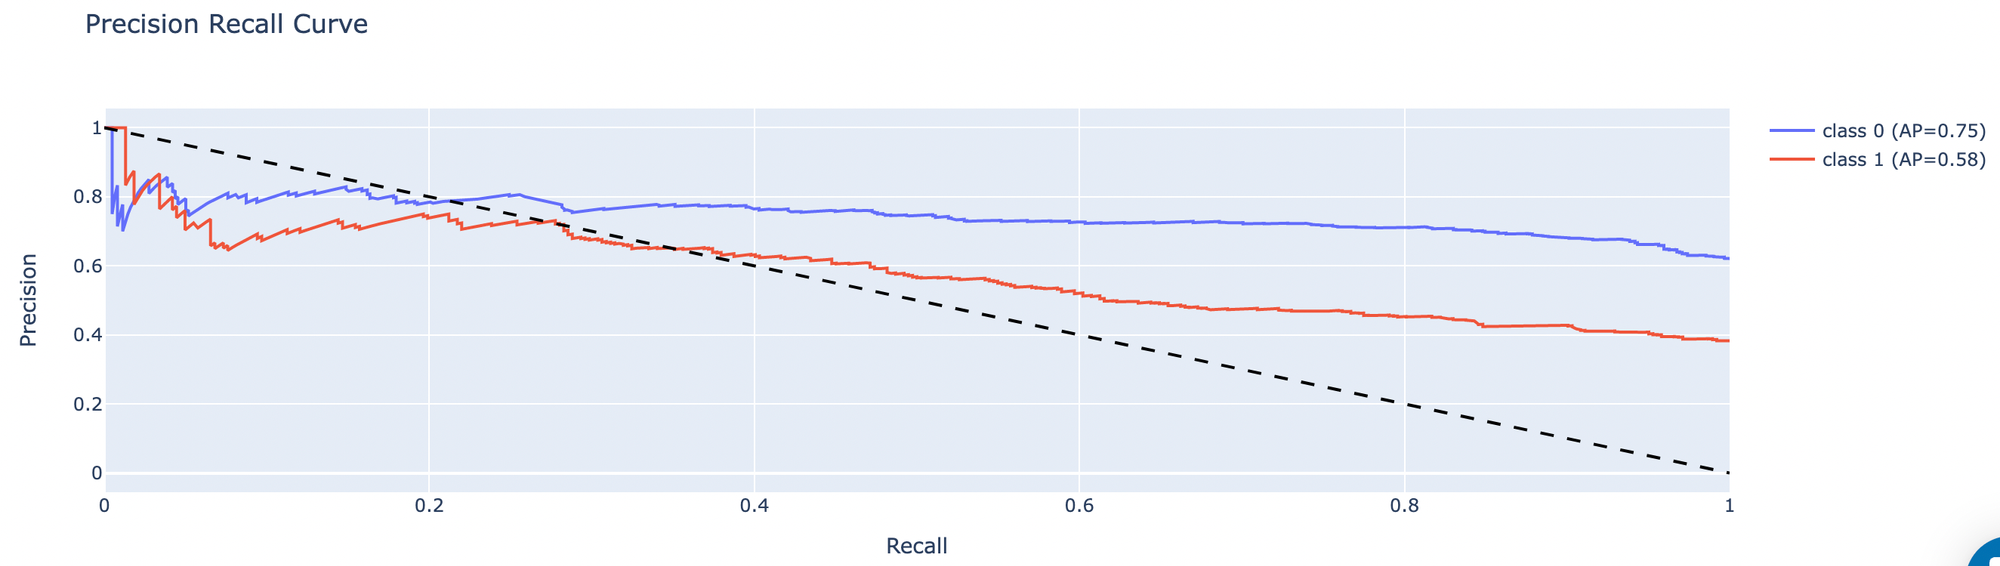
- Precision Recall Curve - graph for precision and recall metrics
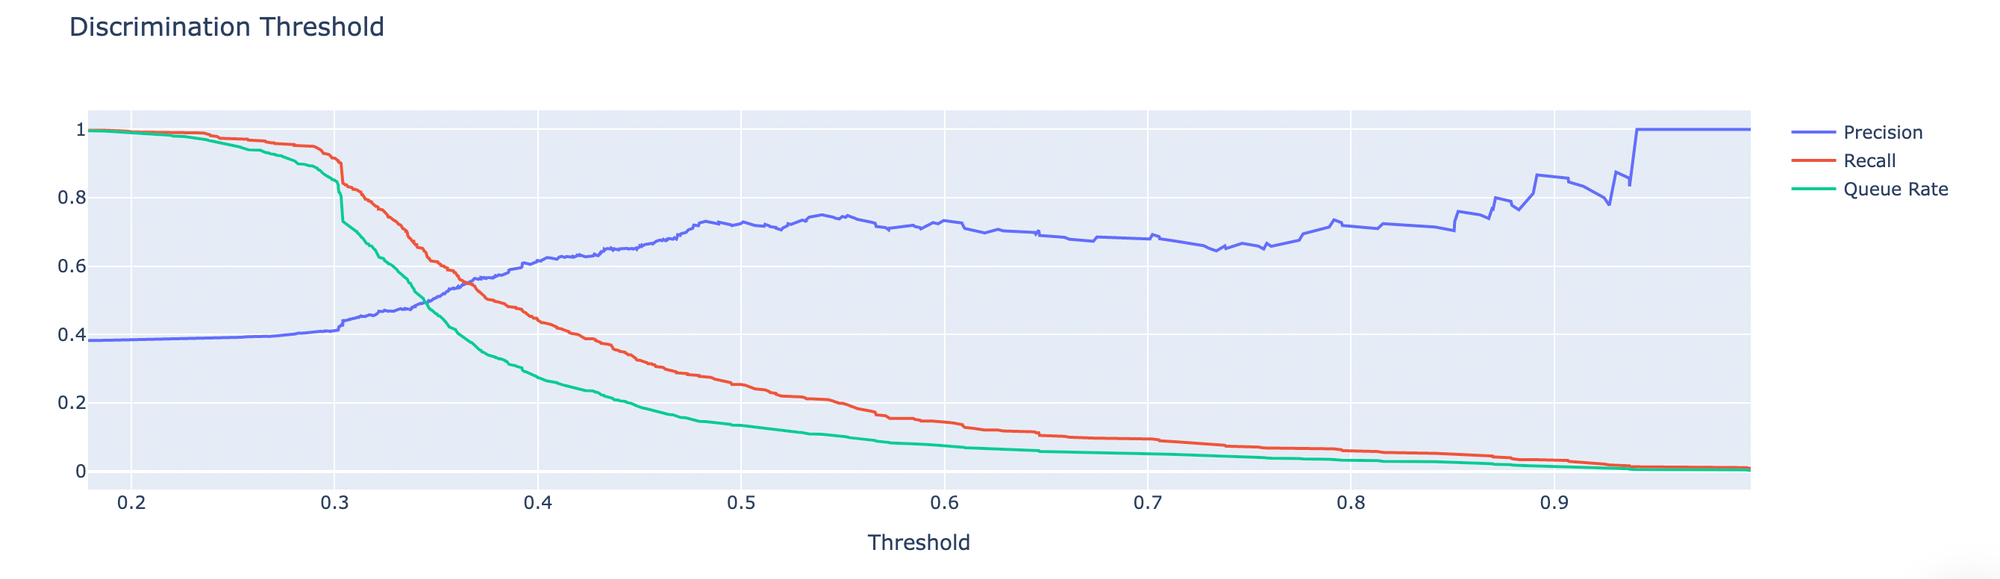
- Discrimination Report - ??
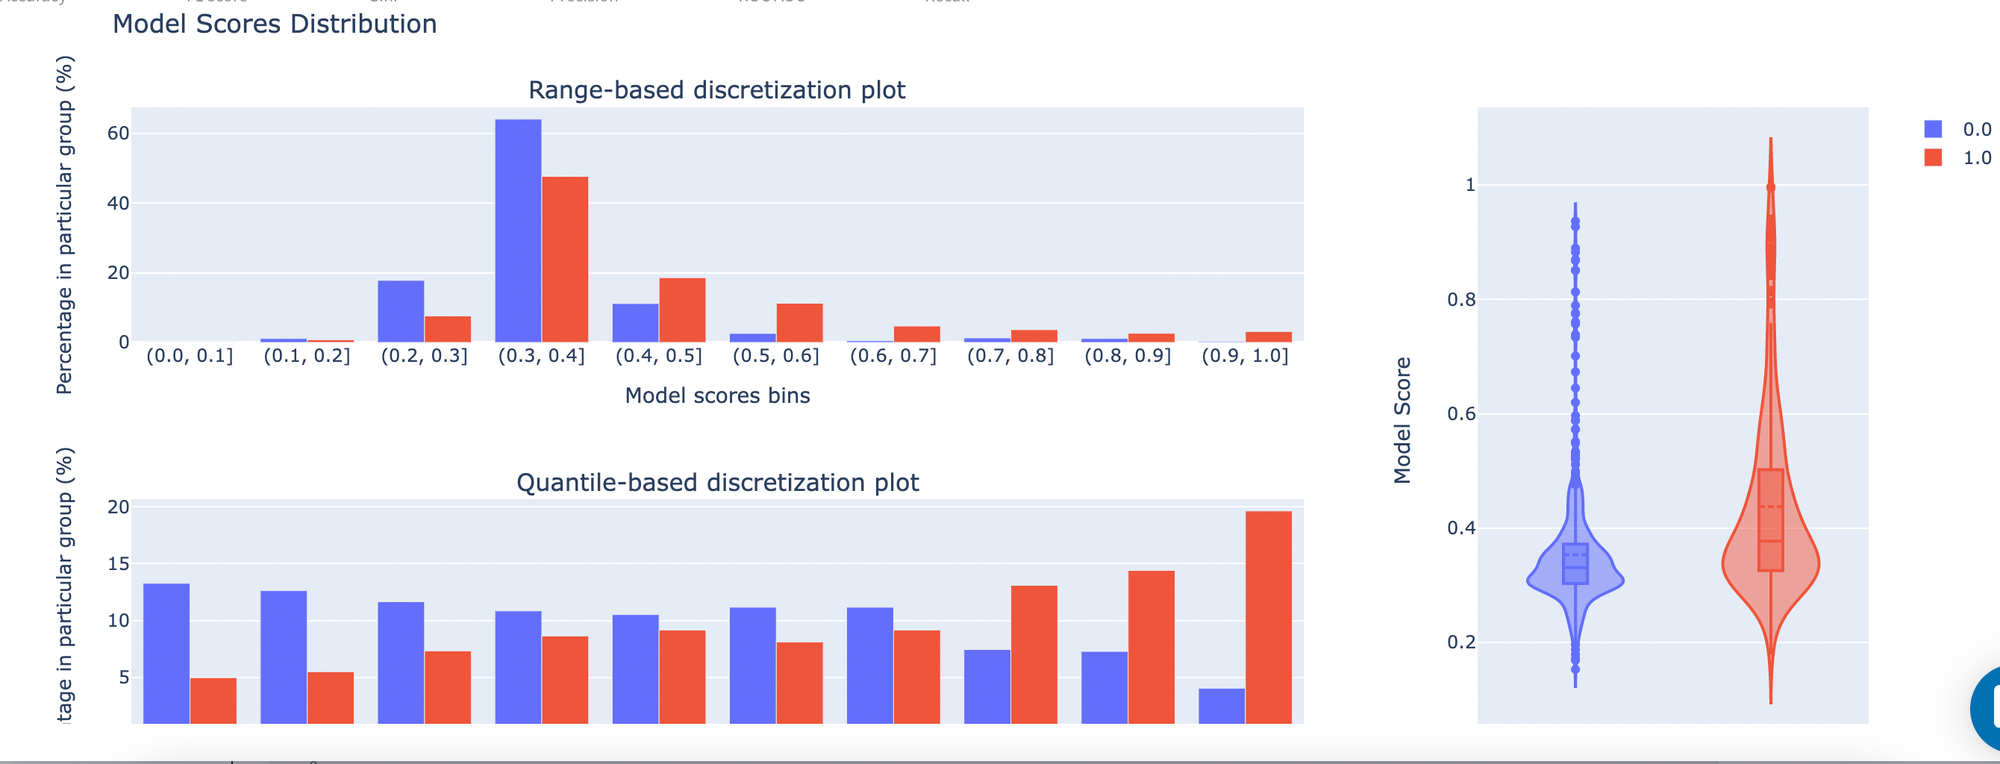
- Model Scores Distribution - model score graph
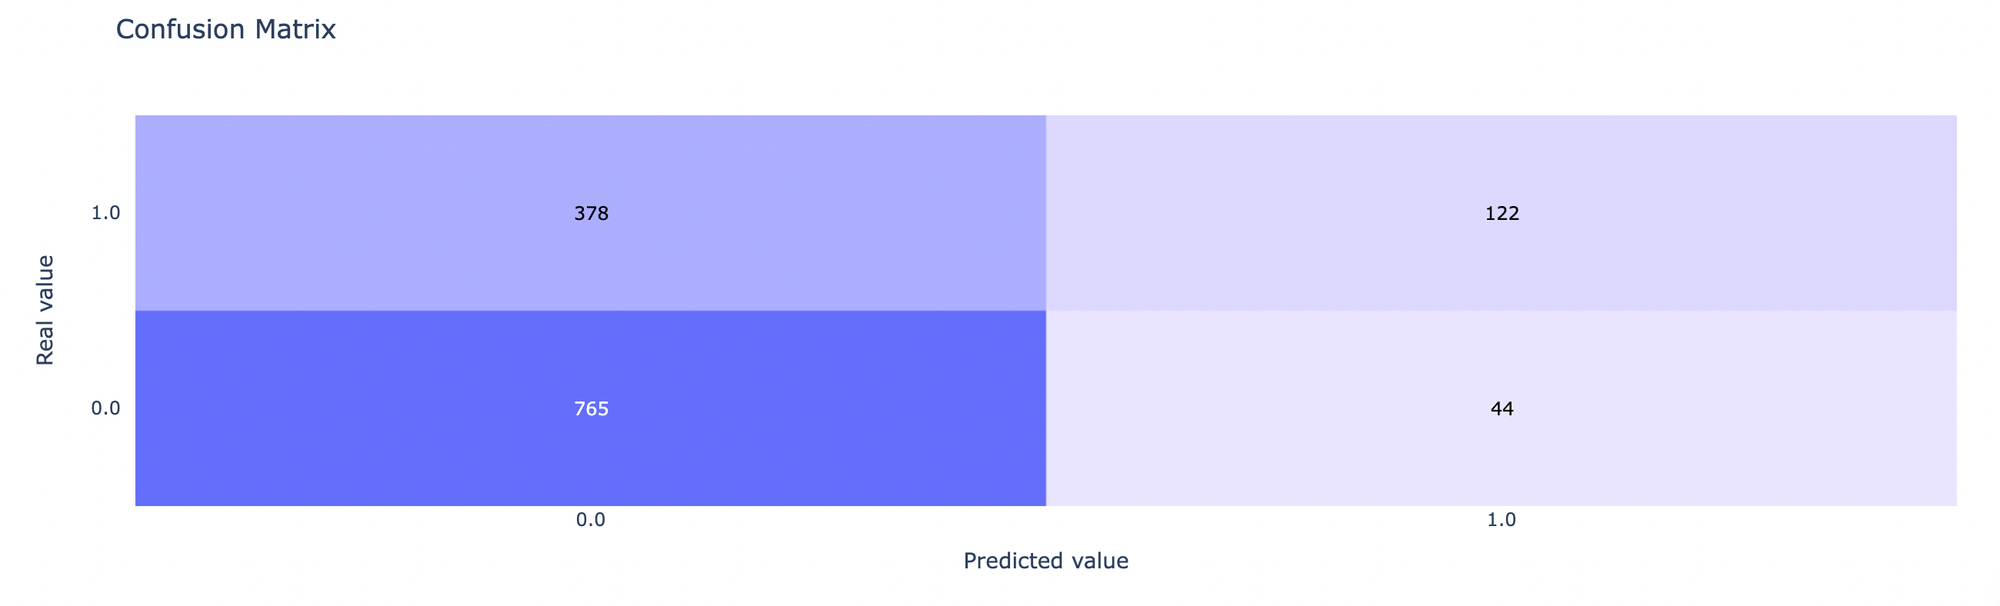
- Confusion Matrix - summary of prediction results
Gives you a possibility to check the model's performance (a.k.a. metrics) to then adjust your pipeline if needed.
There are some metrics presented below:
- Save model
This option provides a mechanism to save your trained models to use them in other projects. For this, you will need to specify the model's name or you can create a new version of an already existing model (you will need to specify the new version's name).
- Download
Use this feature, if you want to download model's asset to use it outside Datrics platform.
- Meta-data
Option to access meta data for pipeline
Example of usage
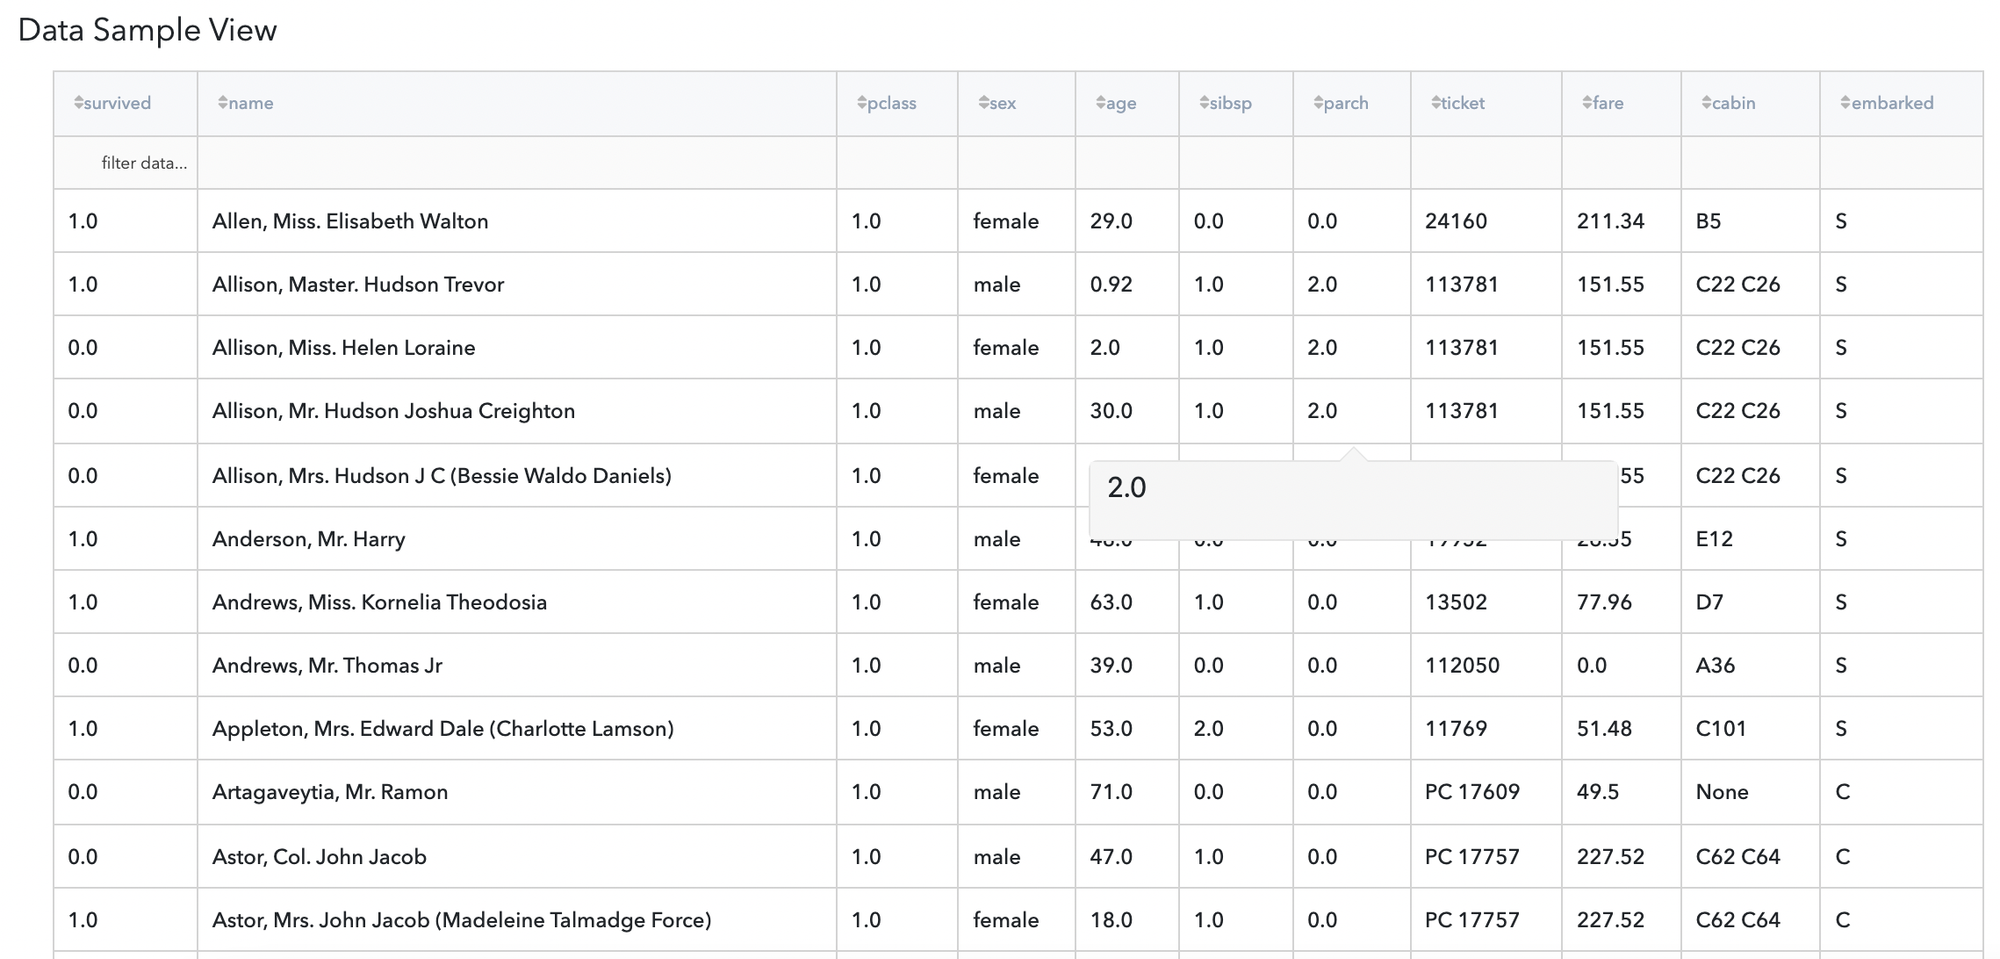
Let's consider a simple titanic classification problem, it is a problem of binary classification, in the end we need to predict if passendger on titanic survived or not . We have the next variables:
- passengerid (category) - ID of passenger
- name (category) - Passenger's name
- pclass (category) - Ticket class
- sex (category) - Gender
- age (numeric) - Age in years
- sibsp (numeric) - Number of siblings / spouses aboard the Titanic
- parch (category) - Number of parents / children aboard the Titanic
- ticket (category) - Ticket number
- fare (numeric) - Passenger fare
- cabin (category) - Cabin number
- embarked (category) - Port of Embarkation
- survived (boolean) - True/False
Then we use Missing Values Treatment brick to fill some missing values and then filtering some rows to fit model, settings presented below:
Let’s move to results: