General Information
This component is a universal solution for "supervised machine learning problem" solving. Supervised machine learning can be defined as learning a function that performs the mapping of the independent characteristics that describe objects or phenomena to the expected outcomes (categories, values, etc.). The inference of the analytical function is performed based on the trained examples - the model fitting process lies in feeding the data into the model and iterative adjustment of the model's weights until the model has been fitted appropriately.
Supervised learning requires the training set, which represents the connections between input parameters (features) and the desired output (target) - the type of the target variable defines the type of the corresponded Data Mining problem (classification or regression):
- Classification is the supervised learning problem when the target variable is discrete. Classification is connected with finding a function, which performs the recognition of the object's class based on its features.
Examples: email spam detection, Image recognition, credit scoring, user compliance categorization.
- Regression is the supervised learning problem when the target variable is continuous. Regression is used to understand the relationship between dependent and independent variables.
Examples: market trends prediction, time-series forecasting, risk assessment
Predictive Model brick automatically performs the detecting of the supervised learning problem's type, based on the selected target variable, as well as the selection of the input features that are appropriate for the modeling. There are two modes of Predictive Model brick settings:
- Simple mode - the user should define the target variable only, and the rest will be made automatically - the component defines the data mining problem, choose the list of predictors, select the appropriate model, and makes it tunning
- Advanced mode - the user may not only define the target variable but select the type of data mining problem and compound the list of predictors.
Description
Brick Location
Bricks → Analytics → AutoML → Predictive Model
Bricks → Analytics → Data Mining / ML → Classification Models → Predictive Model
Bricks → Analytics → Data Mining / ML → Regression Models → Predictive Model
Brick Parameters
- Target Variable
The column that we want the model to predict. This variable can be both continuous and discrete (categorical) - this defines the type of the data mining problem (classification or regression).
- Quick run
The binary flag, which determines the model fitting scenario - if True, the model will be tuned with the default parameters without the hyper-parameters tuning, if False - we sacrifice the computational performance in favor of model precision.
- Select Problem
Advances option. A drop-down menu that allows selecting the desired data mining problem.
- Filter Columns Settings
- remove all mentioned columns from the dataset and proceed with the rest ones as with predictors
- use the selected columns as predictors and proceed with them
Advances option. This is aimed at the predictor's list composition.
Columns
List of possible columns for selection. It is possible to choose several columns for filtering by clicking on the '+' button in the brick settings and specify the way of their processing:
Remove all except selected
The binary flag, which determines the behavior in the context of the selected columns
Brick Inputs/Outputs
- Inputs
Brick takes the data set with a target column that meets the requirements to the supervised machine learning problem solving.
- Outputs
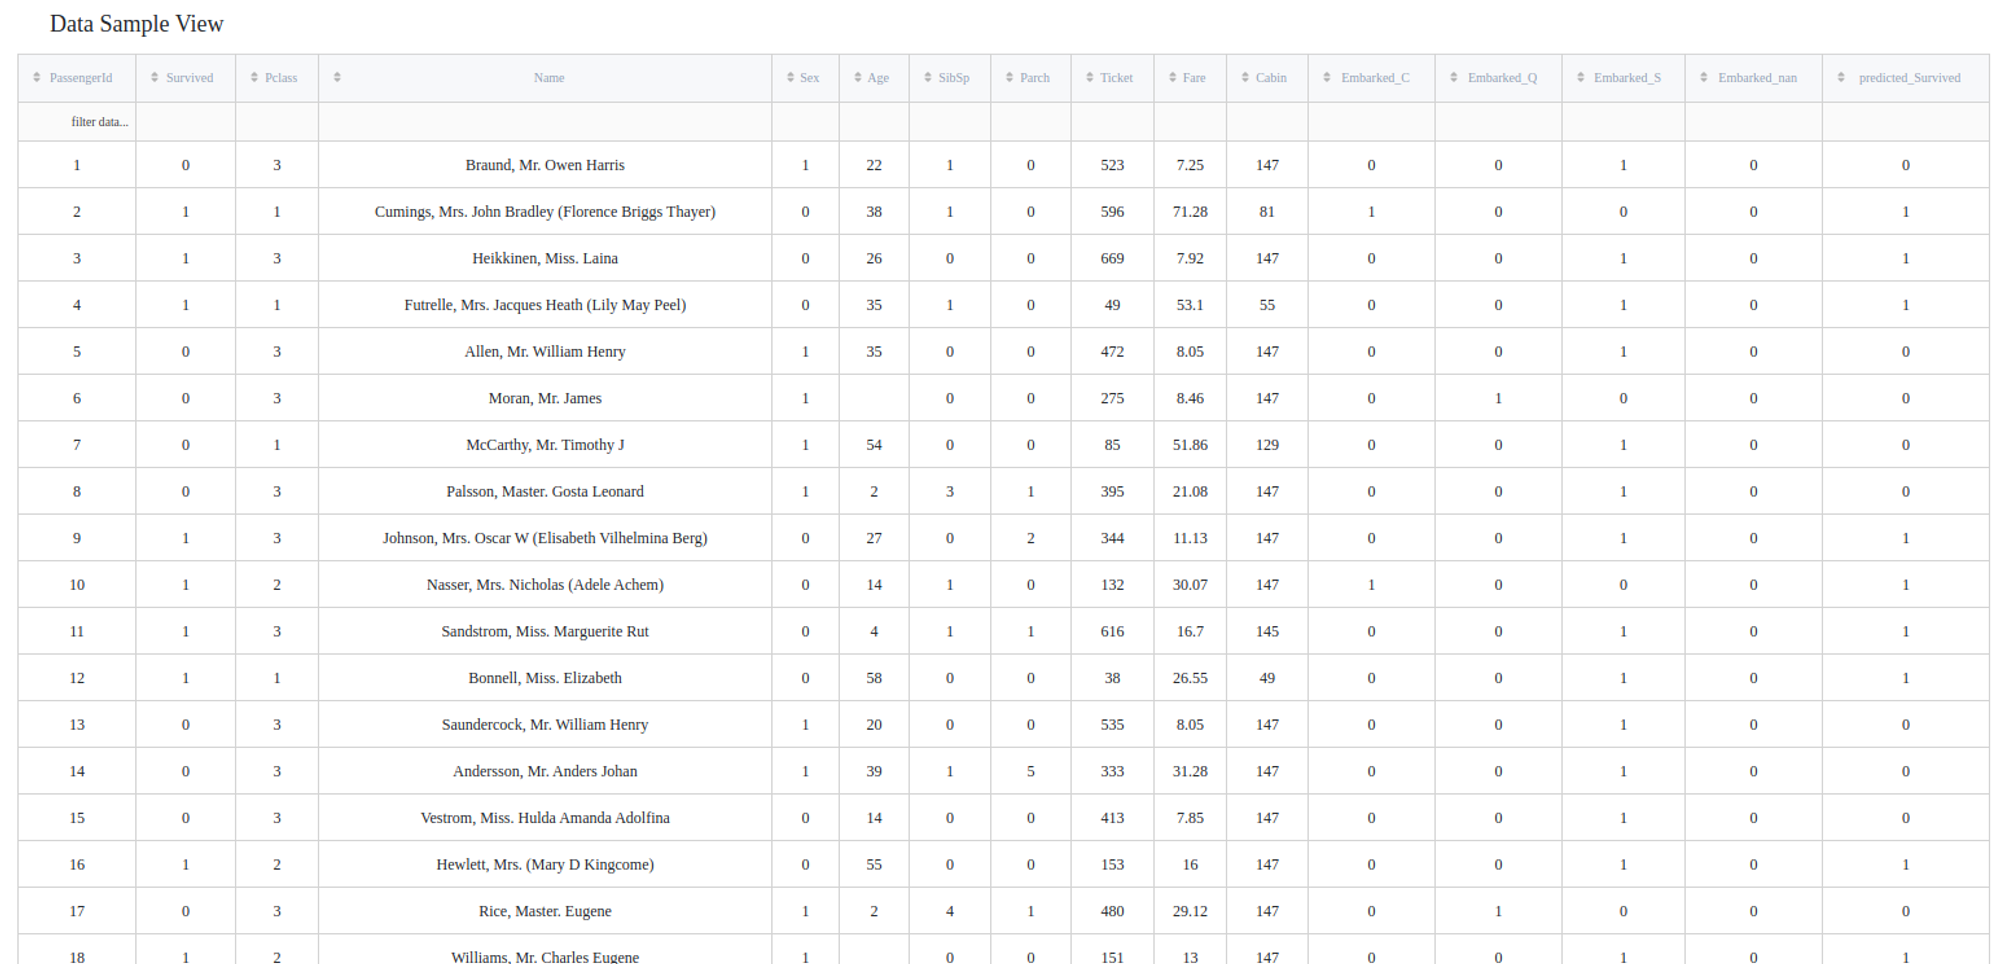
- Data - modified input data set with added columns for predicted classes or classes' probability
- Model - trained model that can be used in other bricks as an input
Brick produces two outputs as the result:
Outcomes
- Model Performance
- Supported metrics: accuracy, precision, recall, f1-score, ROC AUC, Gini
- Plots: feature importance, classification report, Class Error report, ROC curve, Precision-Recall curve, Discrimination threshold, confusion matrix
- Supported metrics: RMSE, MAPE, R2
This button (located in the Deployment section) gives you a possibility to check the model's performance (a.k.a. metrics) to then adjust your pipeline if needed.
Model performance metrics depend on the solved data mining problem:
Classification
Regression
- Save model asset
This option provides a mechanism to save your trained models to use them in other projects. For this, you will need to specify the model's name or you can create a new version of an already existing model (you will need to specify the new version's name).
- Download model asset
Use this feature, if you want to download the model's asset to use it outside the Datrics platform.
Example of usage
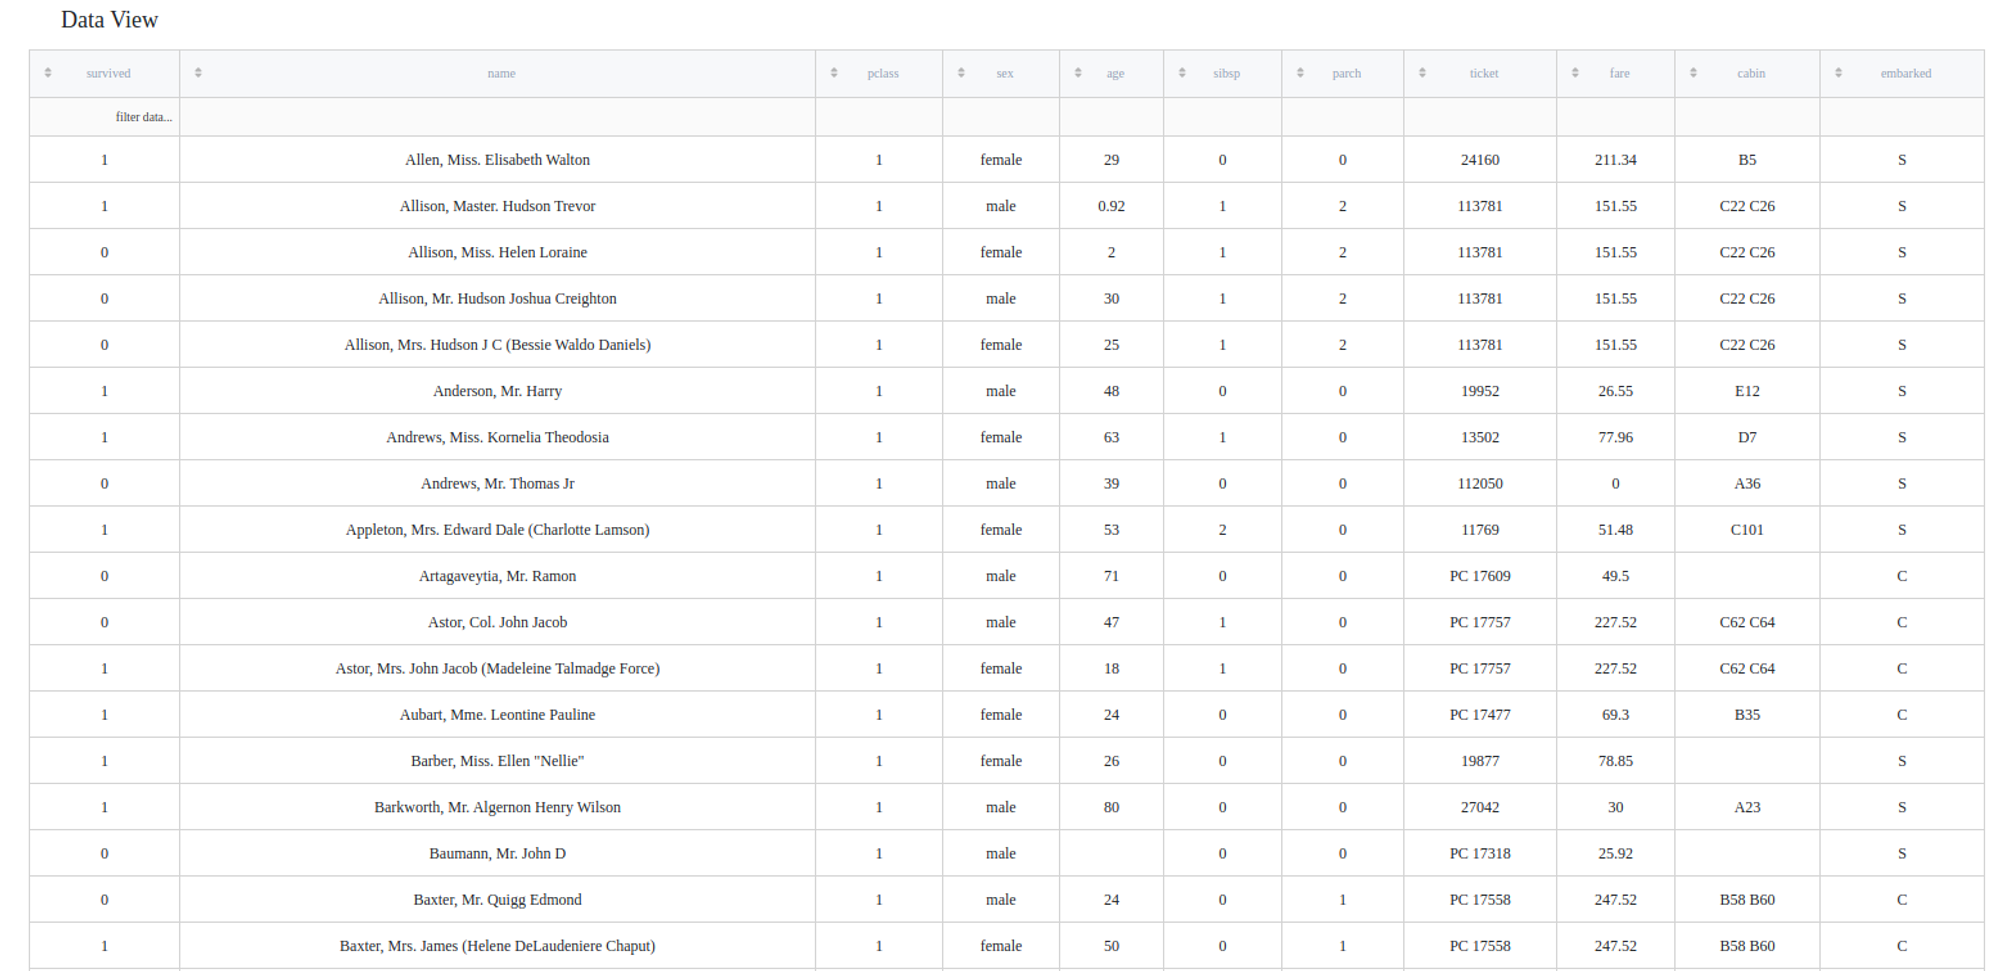
Let's try to predict which Titanic passengers are more likely to survive the Titanic shipwreck. For this purpose, we may take the titanic.csv dataset and connect it with the Predictive Model brick.
Dataset description
- passengerid (category/int) - ID of passenger
- name (category/string) - Passenger's nhame
- pclass (category/int) - Ticket class
- sex (category/string) - Gender
- age (numeric) - Age in years
- sibsp (numeric) - Number of siblings / spouses aboard the Titanic
- parch (category/int) - Number of parents / children aboard the Titanic
- ticket (category/string) - Ticket number (contains letters)
- fare (numeric) - Passenger fare
- cabin (category/string) - Cabin number (contains letters)
- embarked (category/string) - Port of Embarkation
- survived (category/binary) - indicator of the passenger surviving
Executing simple-mode pipeline
Next steps would be made to build simple test pipeline:
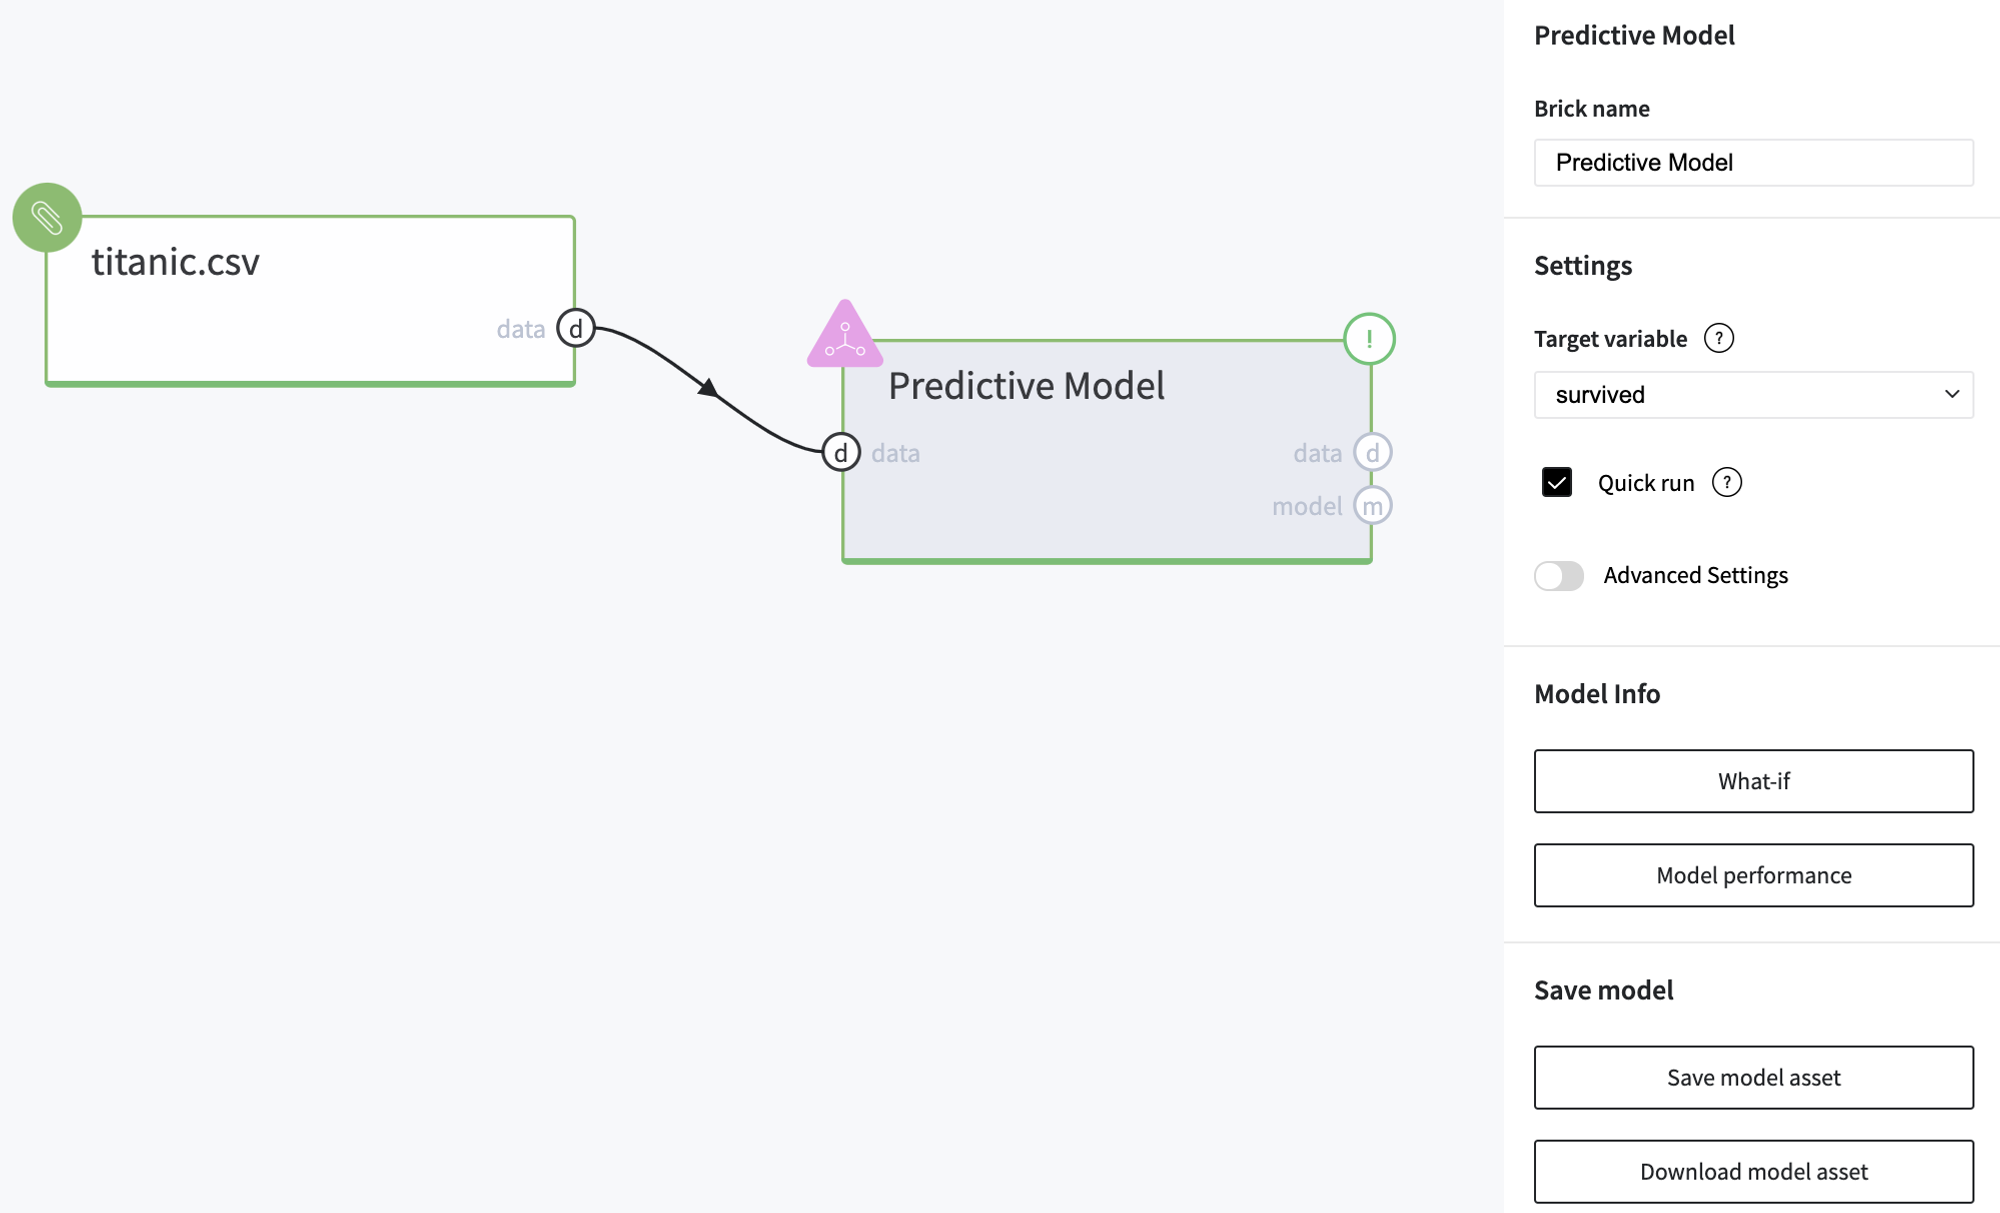
- First, drag-drop titanic.csv file from Storage→Samples folder and Predictive Model from Bricks → Analytics → AutoML
- Connect the data set to Predictive Model brick, and choose the target variable "survived"
- Run pipeline
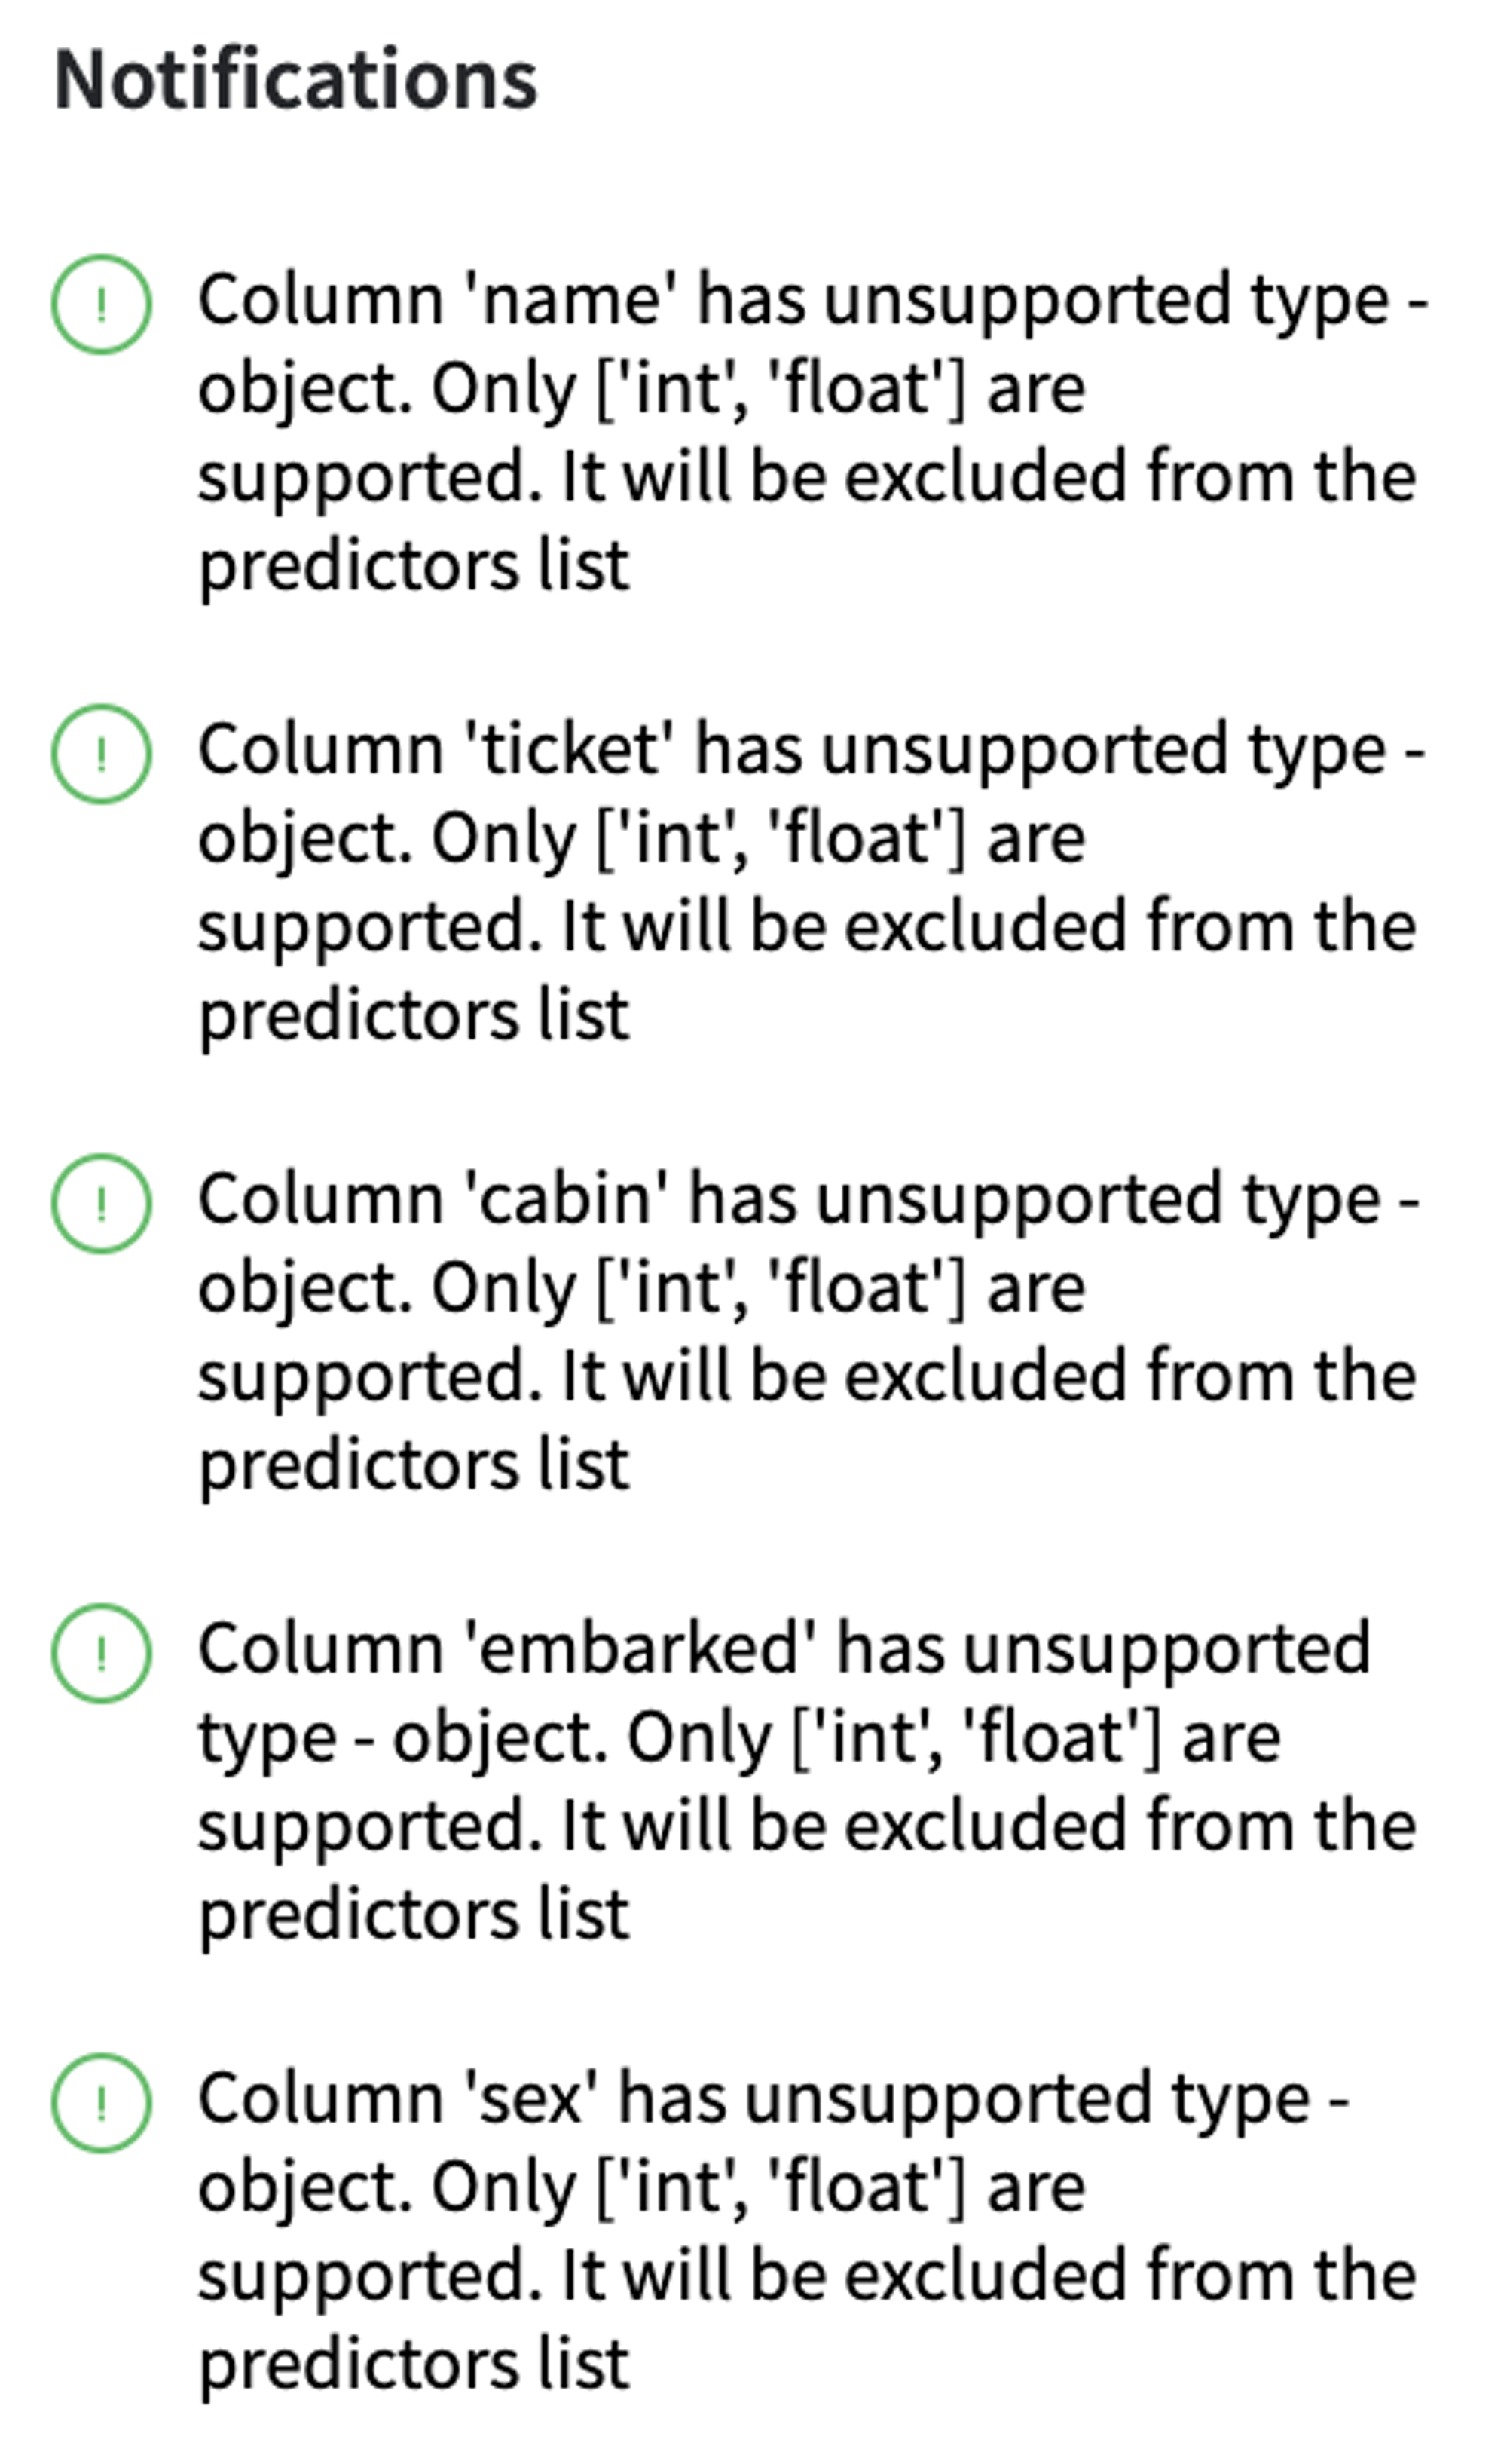
Some of the columns from the input dataset can't be used as a model's predictors, so they were excluded from the features list, and the user gets the corresponded notification.
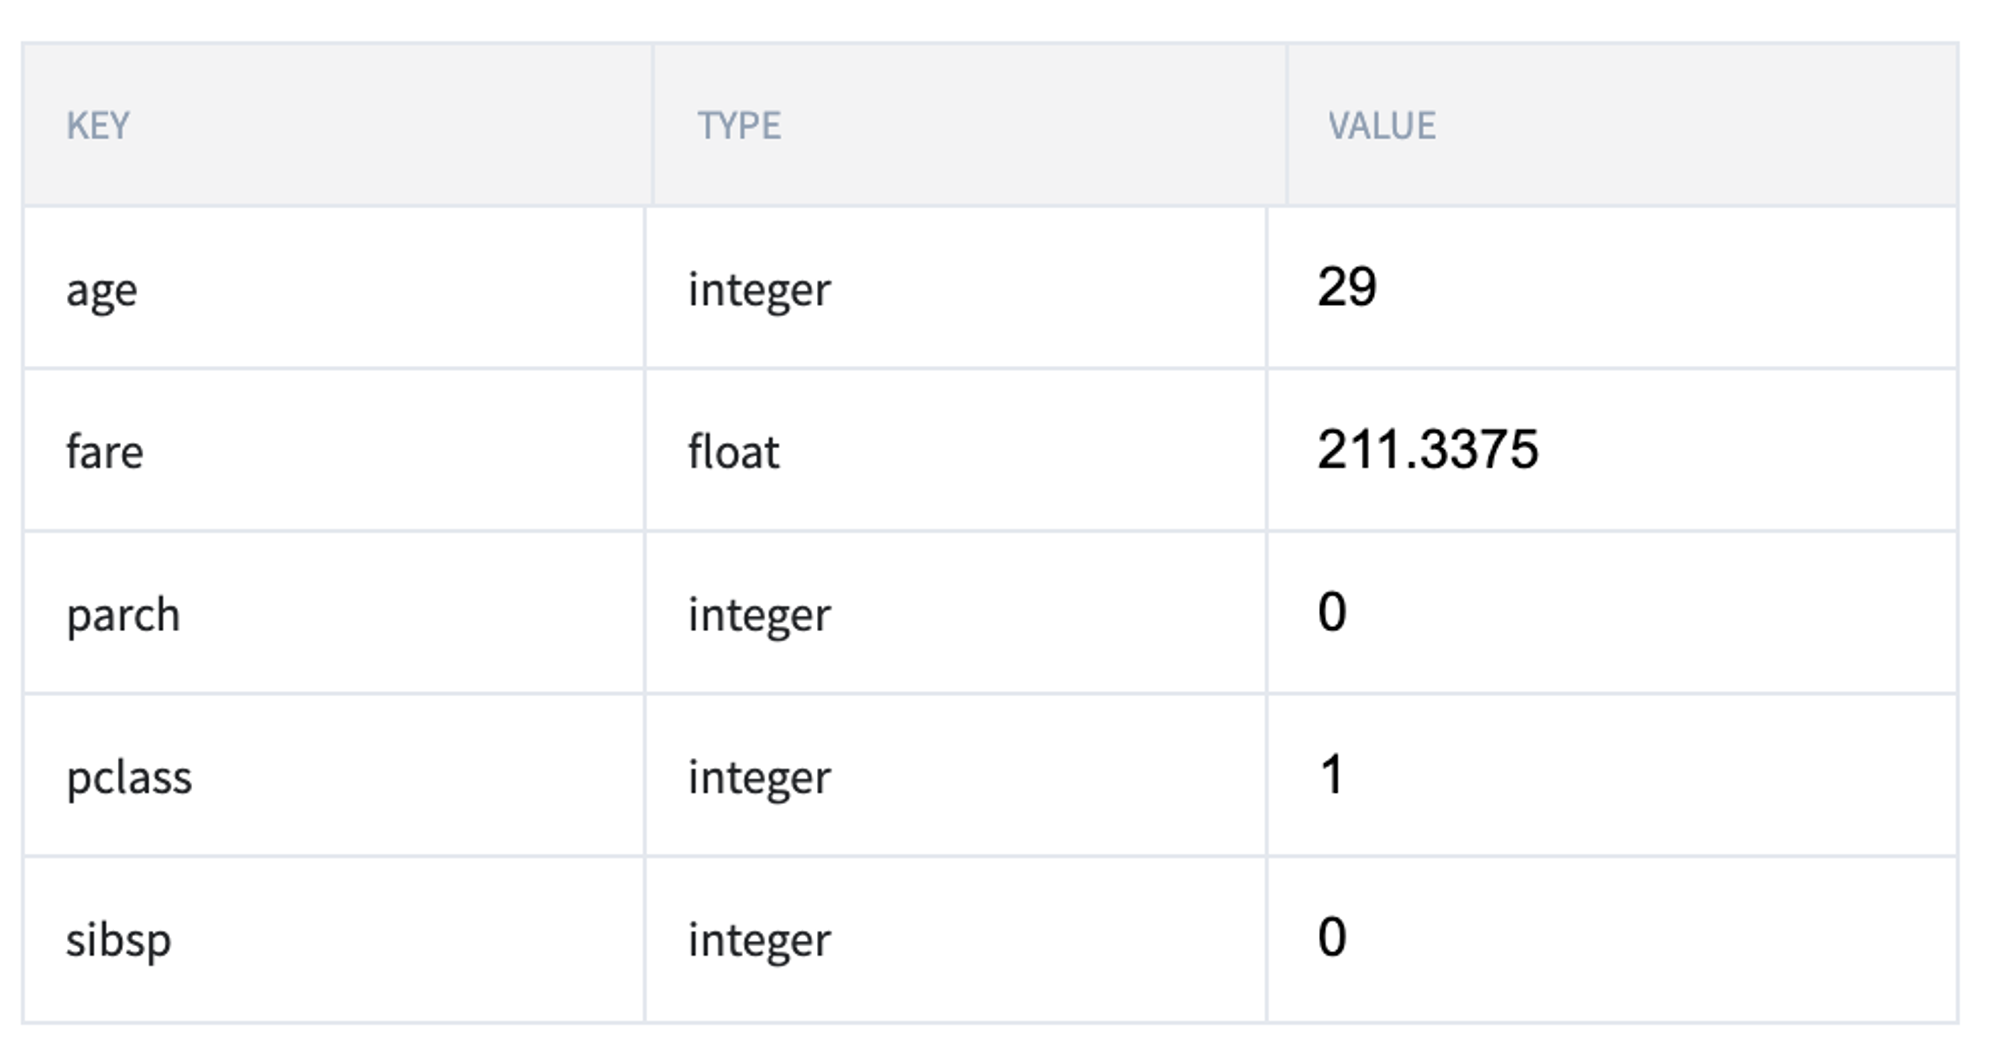
If we open the "What-If" dashboard, we may see the list of predictors and check the model results for the different sets of the input parameters. As we can see, the model's feature vector contains numerical parameters such as age, fare, parch, pclass, and silbsp.
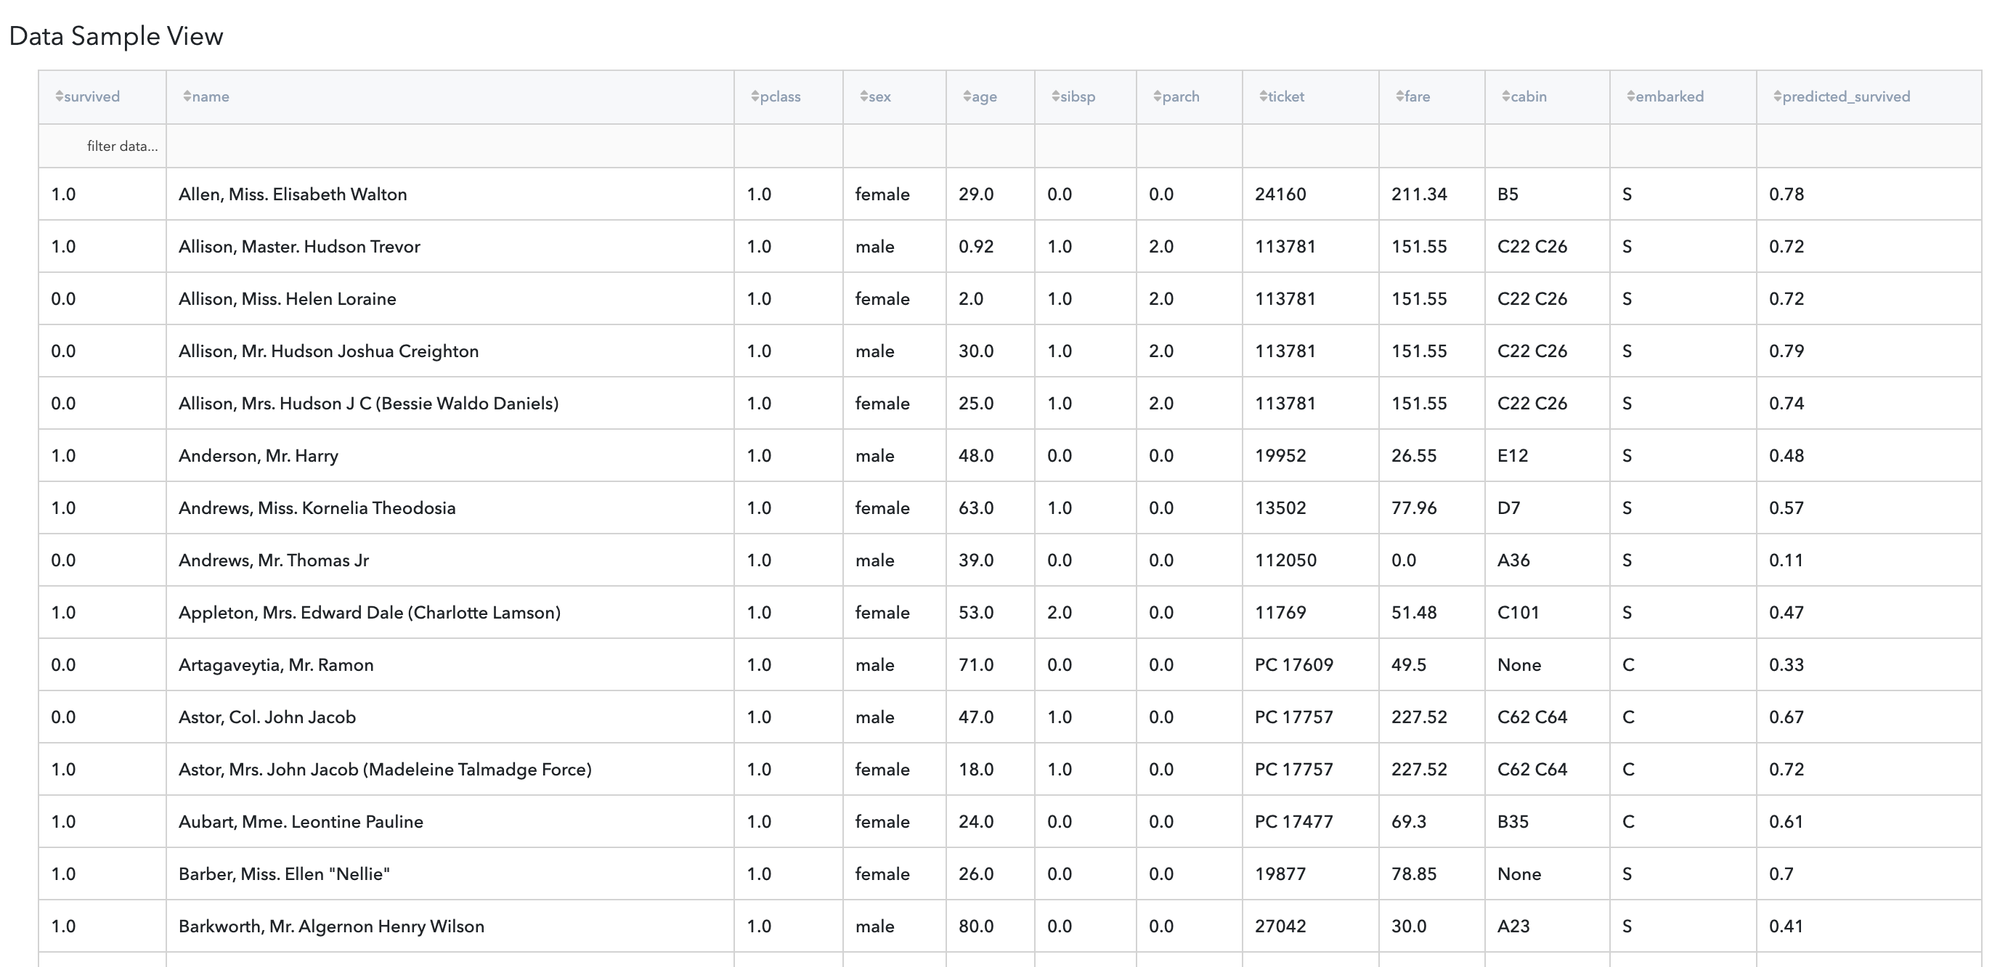
As was expected, the data mining problem was considered as a Classification problem, so the Model Performance report depicts the metrics and plots that are related to the classification performance.
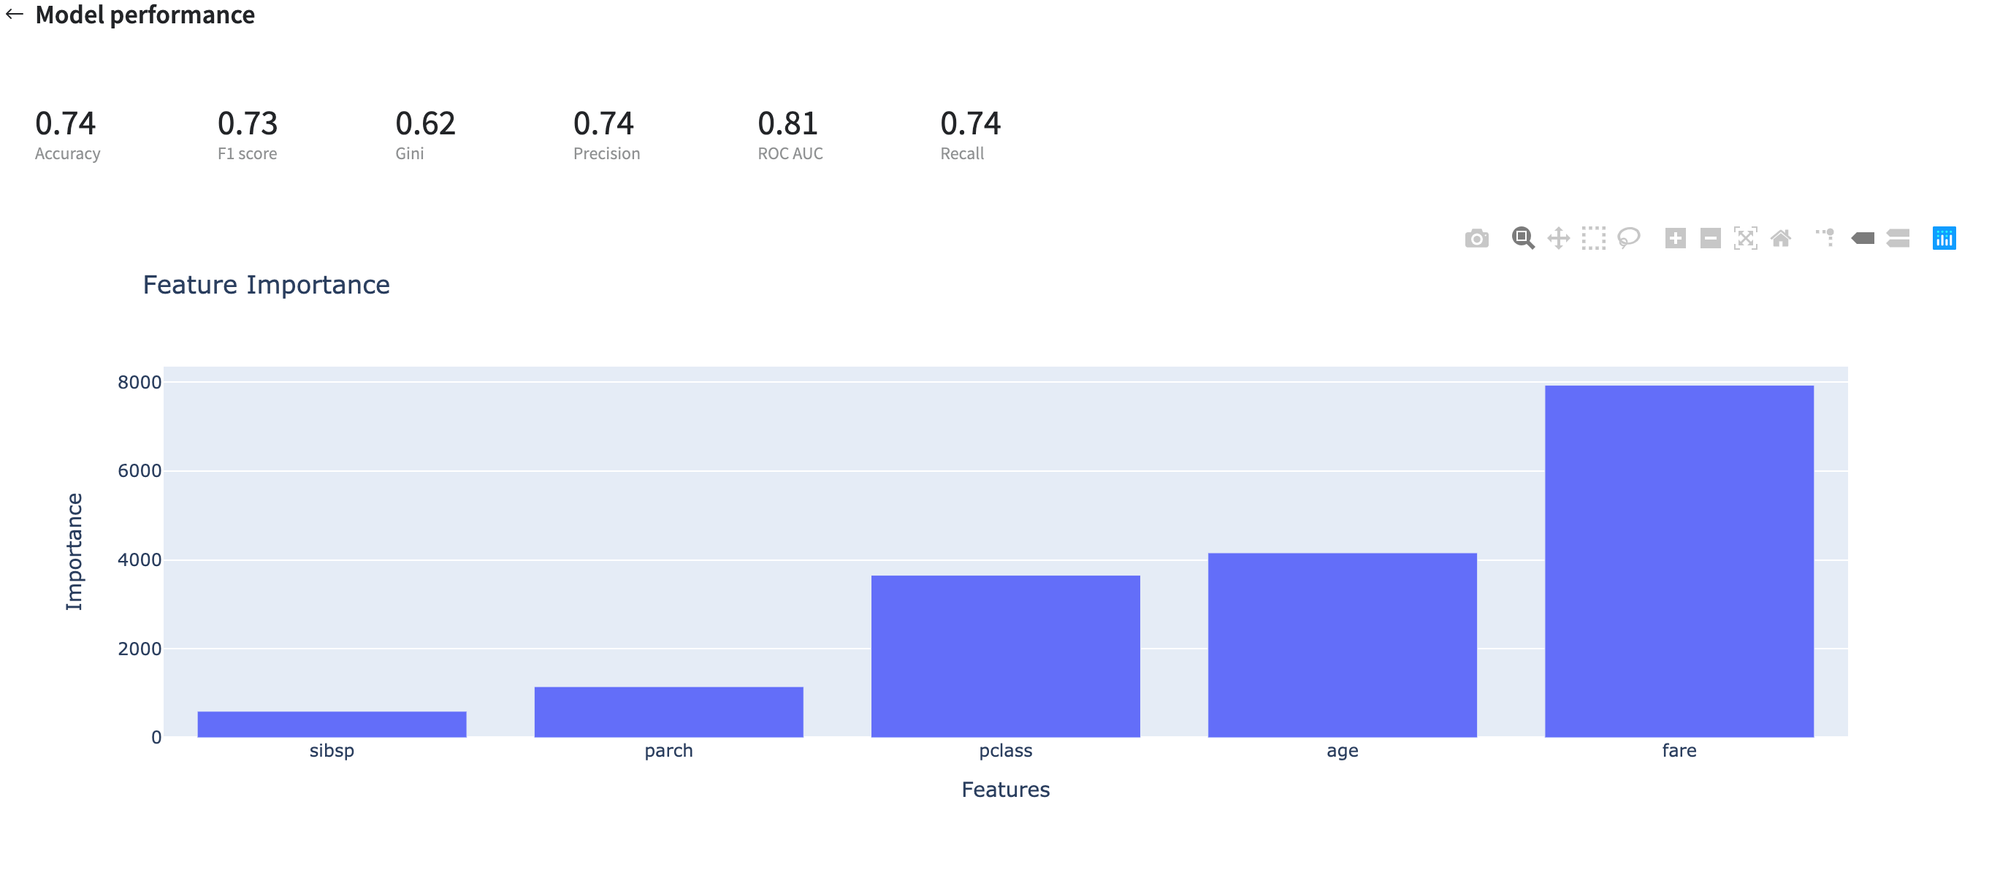
The results are depicted in the table:
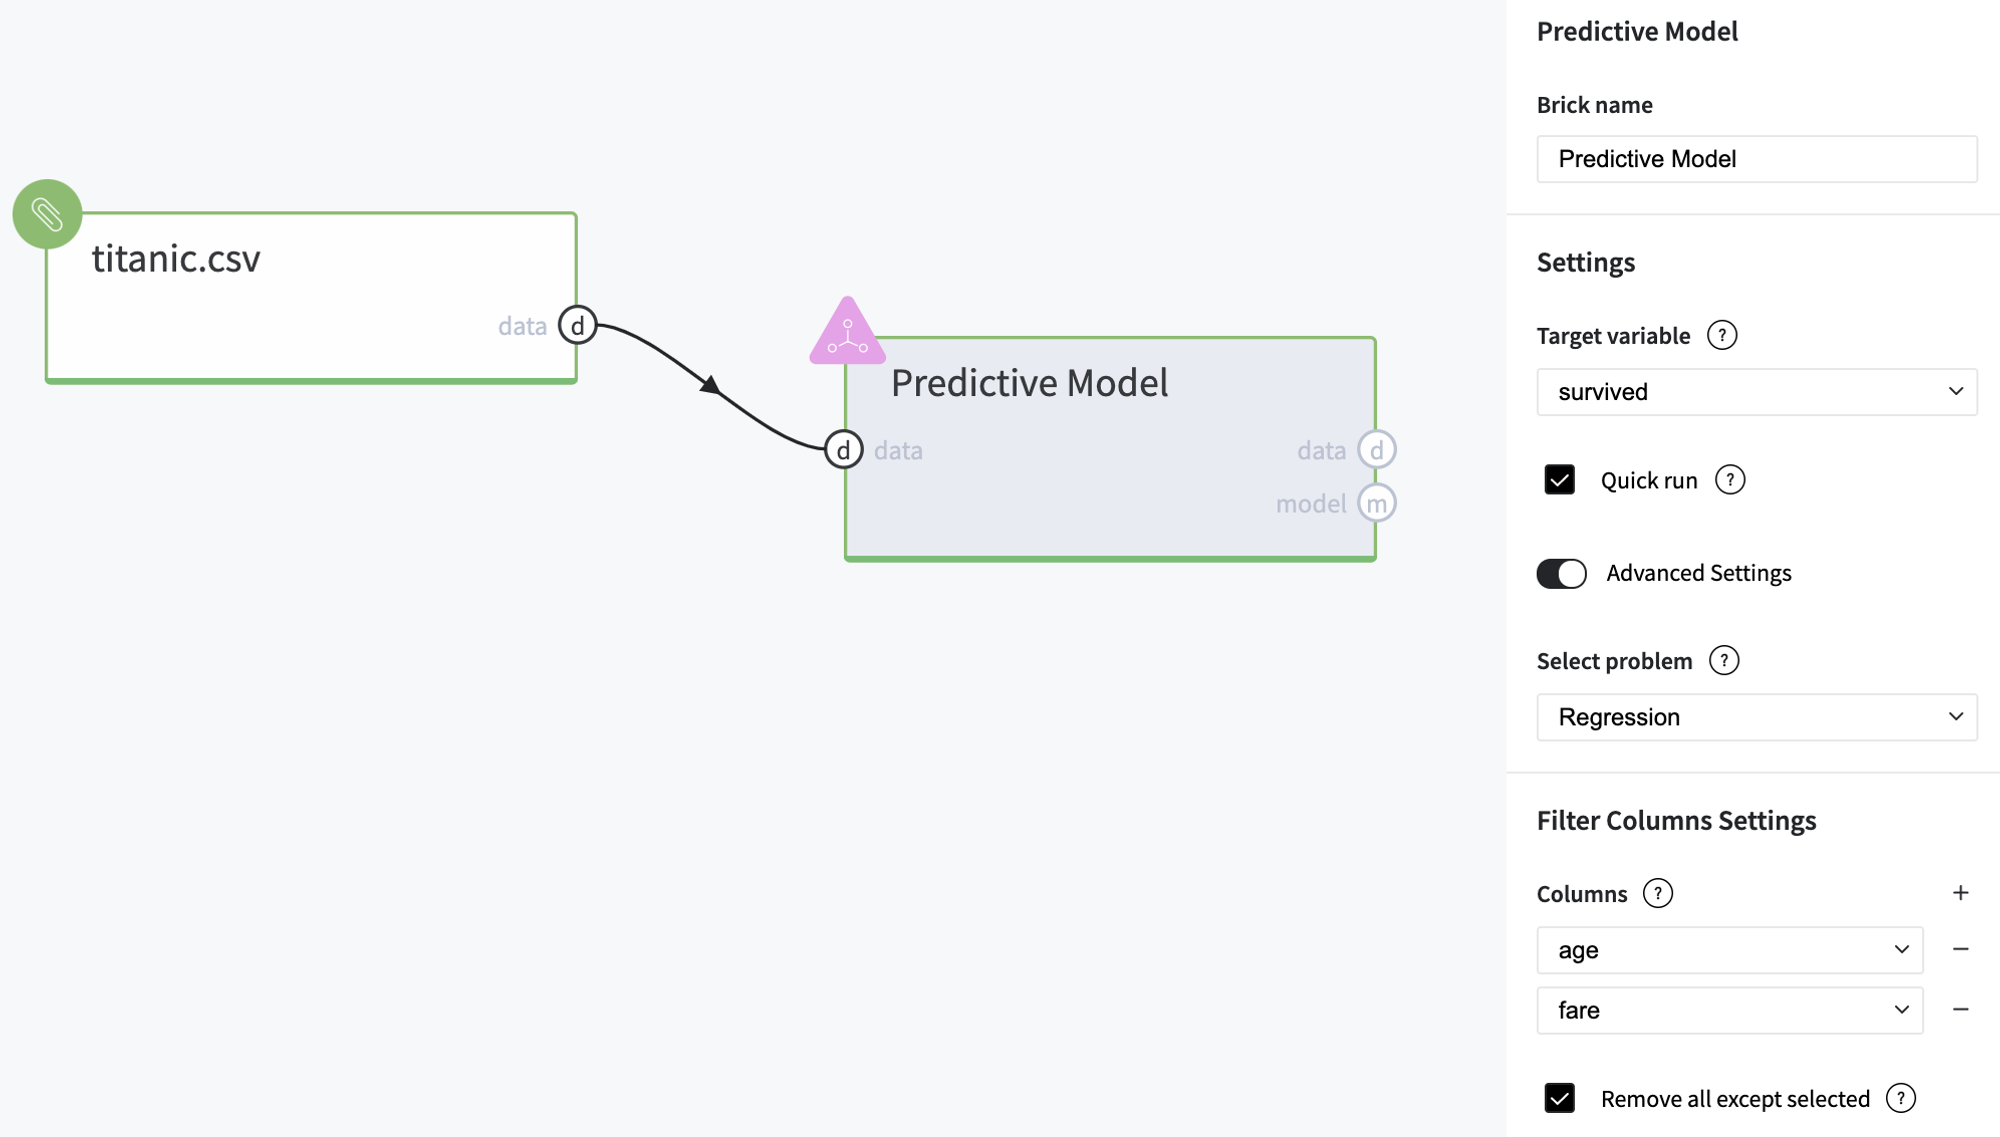
Executing advanced-mode pipeline
- Drag-drop titanic.csv file from Storage→Samples folder and Predictive Model from Bricks → Analytics → AutoML
- Connect the data set to Predictive Model brick, and choose the target variable "survived"
- Switch to the Advanced Mode
- Select Regression problem
- Select age and fare as predictors
- Run pipeline
Now, we get the solution of the regression problem and the model produces the value that can be considered as a survival score.