General Information
The brick provides a separate dashboard to perform manual mapping for the specified columns and then convert them to the desired data type.
Description
Brick Location
Bricks → Transformation → Categories Mapping
Brick Parameters
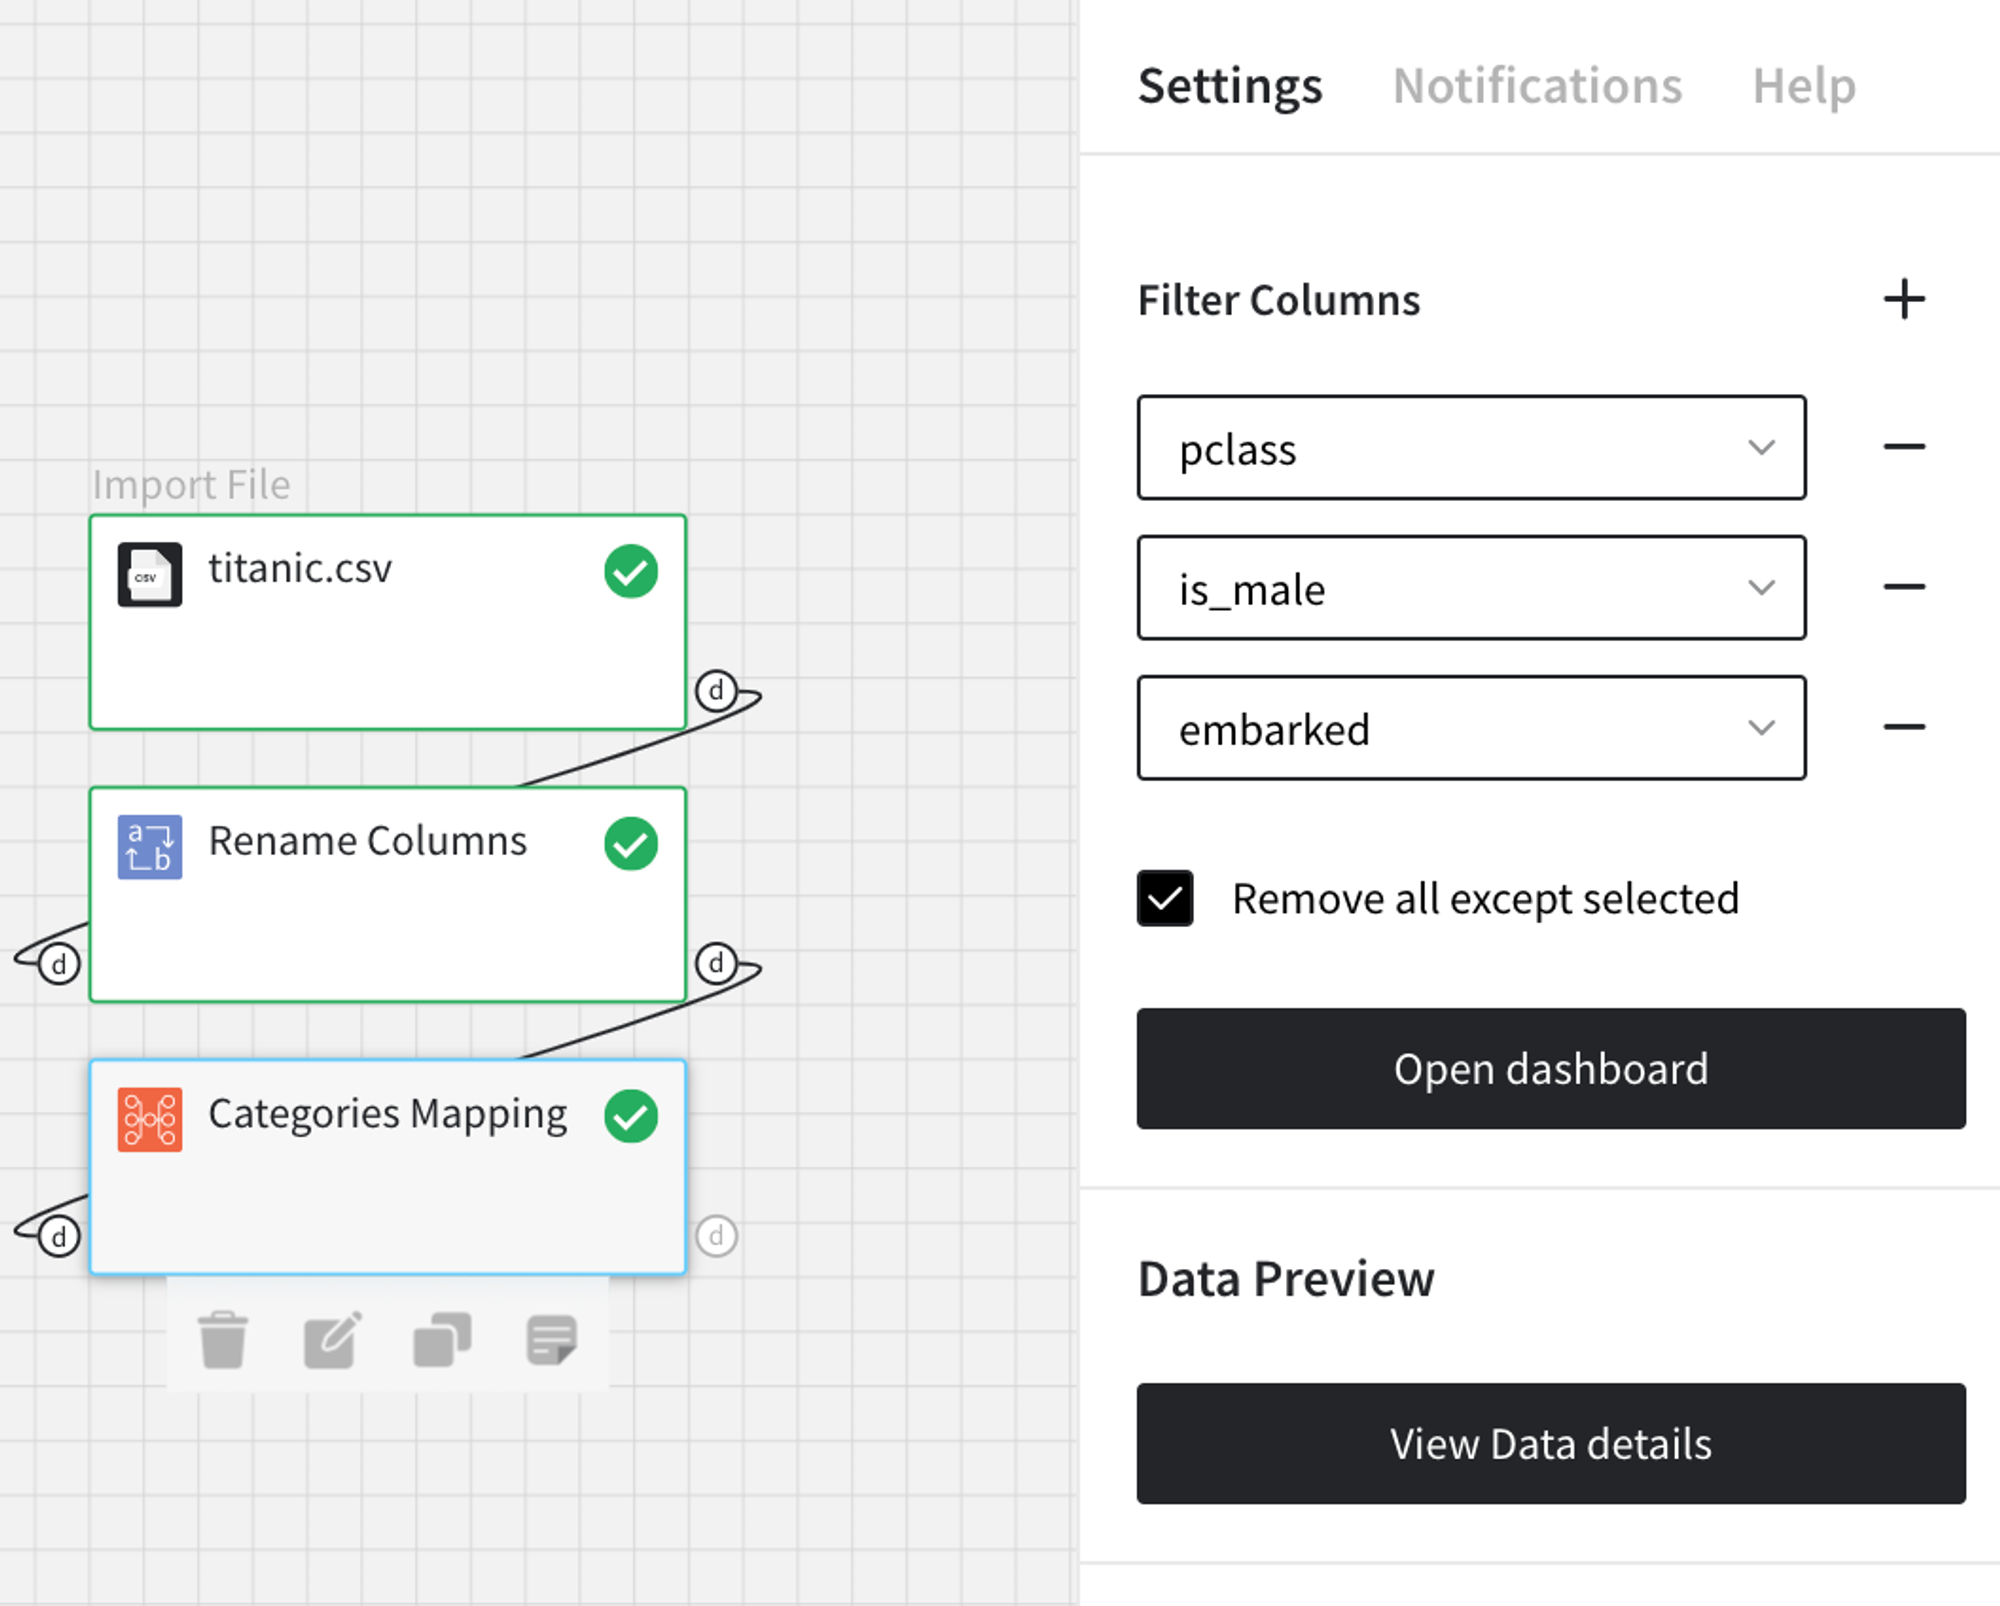
- Filter Columns
If you have columns in your data that need to be ignored (but not removed from the data set) and not be shown in the dashboard as an option, you should specify them in this parameter. To select multiple columns, click on the '+' button in the brick settings.
In addition, you can ignore all columns except those you specified by enabling the ‘Remove all except selected’ option. This may be useful if you have a large number of columns but need just several of them to be mapped with new values.
Brick Inputs/Outputs
- Inputs
Brick takes the dataset.
- Outputs
Brick produces the dataset as the modification of the input dataset, replacing the categories with the new values specified in the dashboard, and converting the columns to the selected data type.
Dashboard
The dashboard is designed to give easy-to-use access to columns’ unique categories and replace them with new values when needed. Additionally, you can change the data types as well.
To access the dashboard, you need to press the ‘Open dashboard’ button on the right-side menu with brick settings. The dashboard can be divided into the next three functional parts:
- Columns - a selectable list of columns that contain categories. You can filter columns by adding them to the ‘Filter Columns’ option on the right sidebar. Other components change respectively to the chosen column.
- Column's data type - specifies the current data type of the selected categorical column with a drop-down section to let the user manually change it to the desired one. If the conversion is not possible, brick automatically converts the column to a higher-level type (e.g., if it is not possible to convert a column to an integer, the brick first tries to convert to a float and then to a string).
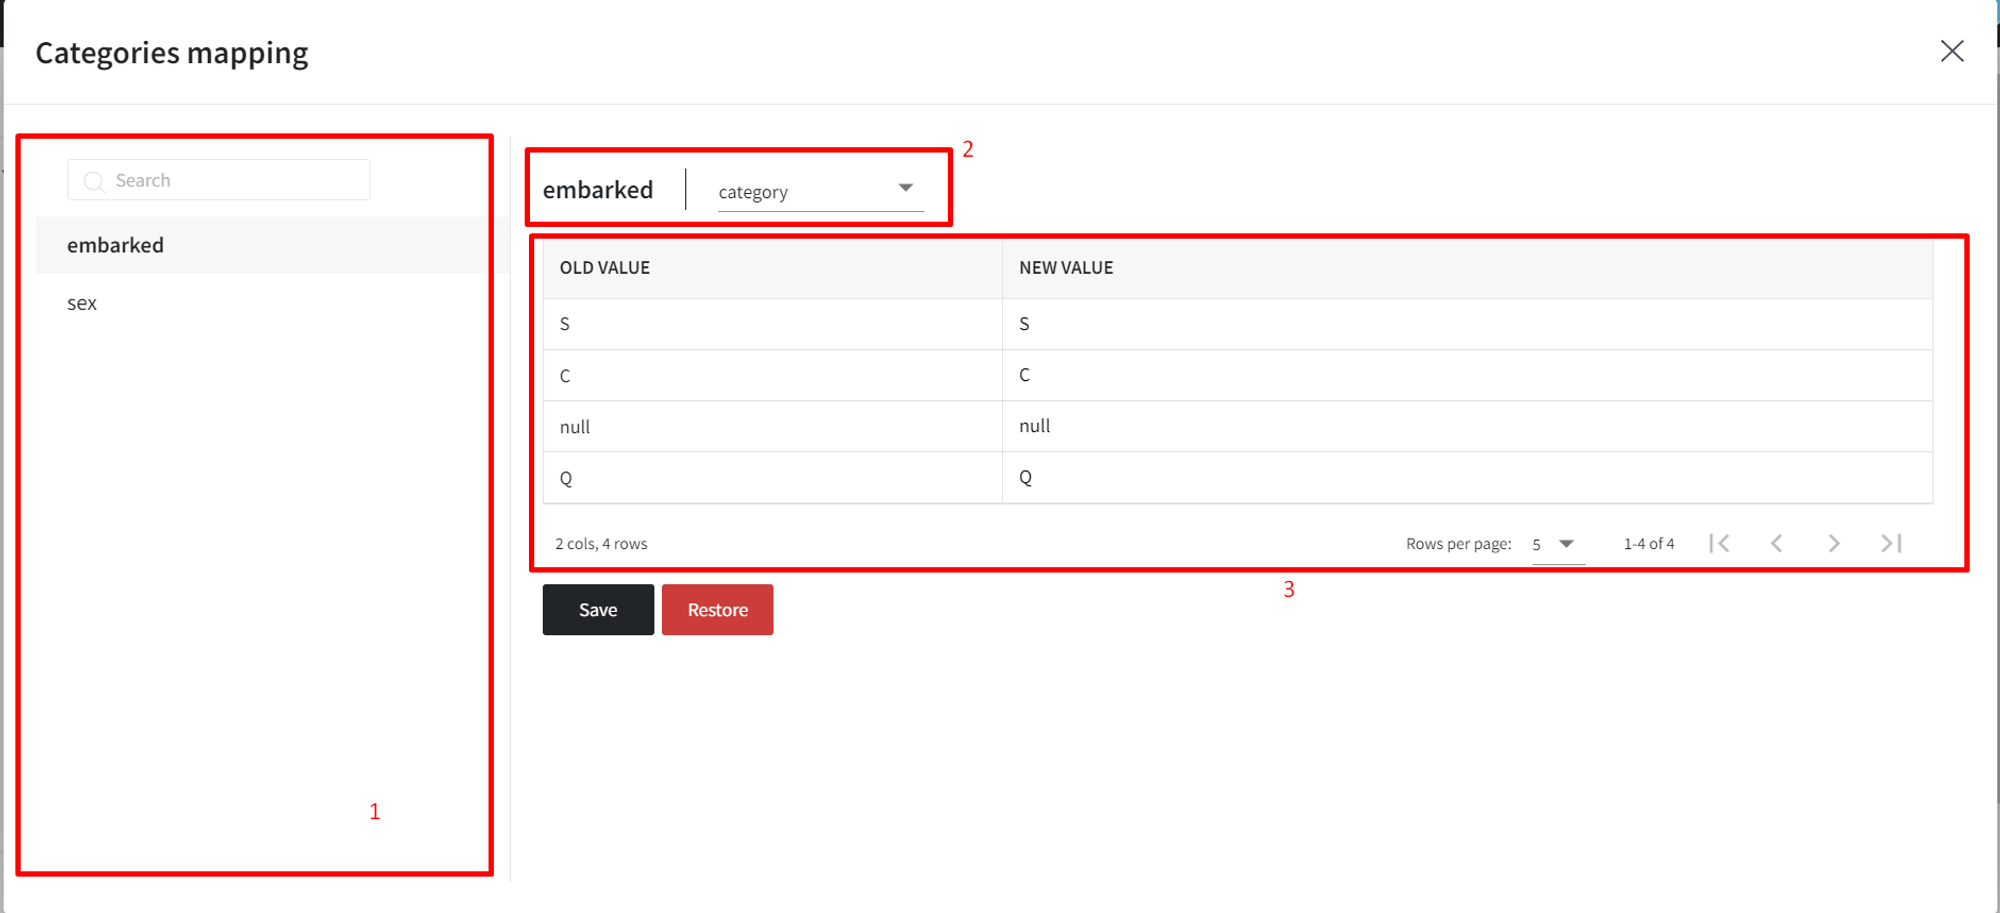
- Mapping table - a table with two columns - old values and new ones.
Example of usage
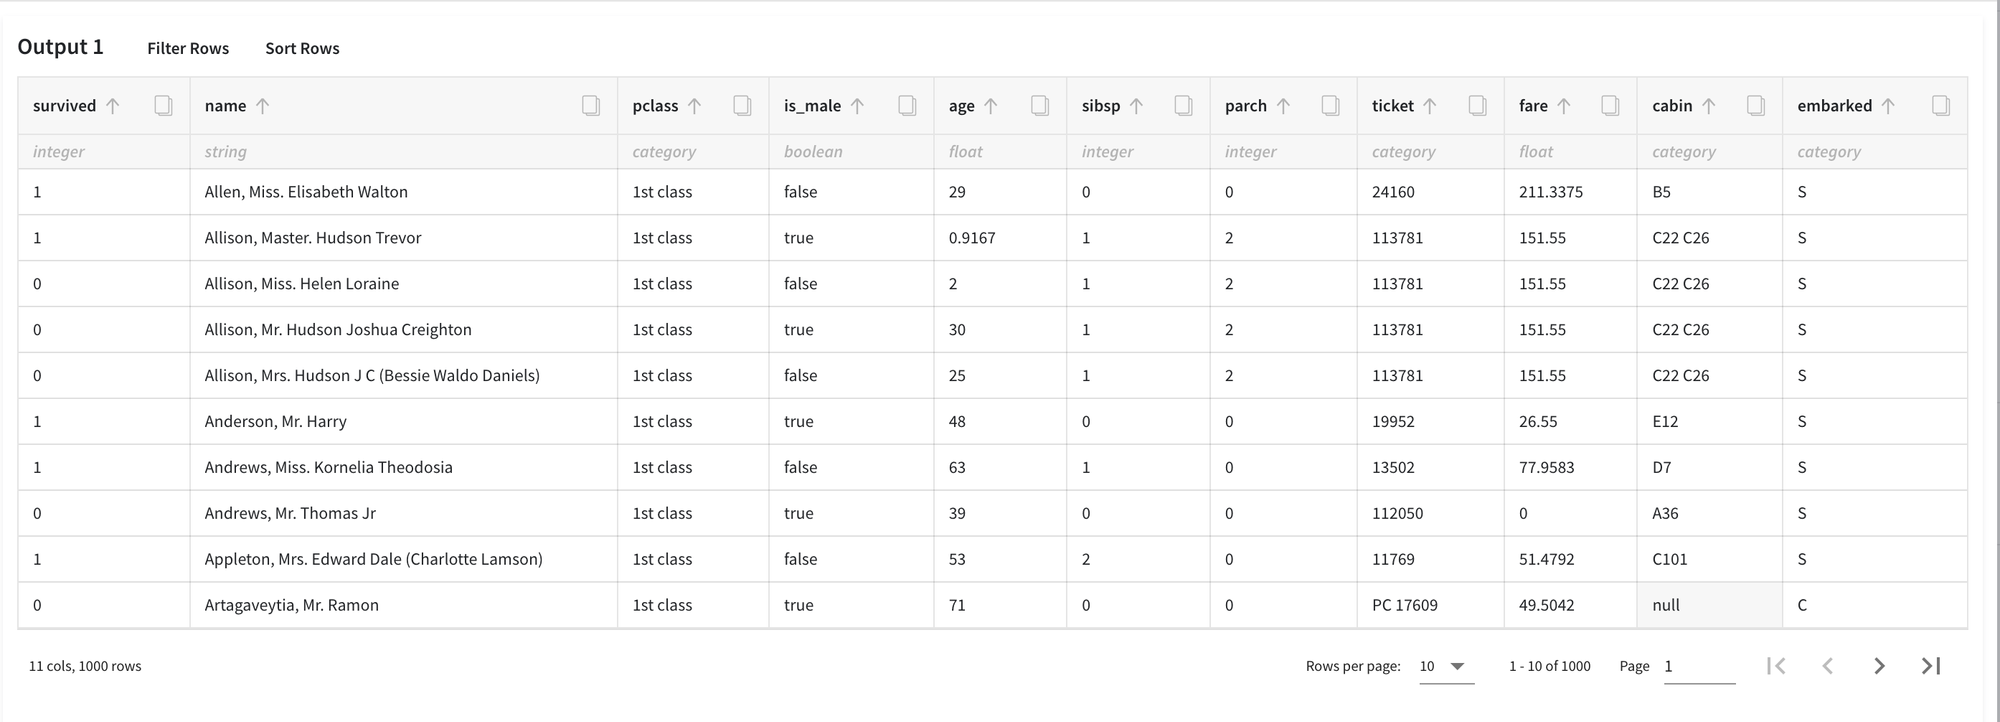
Let's consider the binary classification problem Binary classification : Titanic. The inverse target variable takes two values - survived (0) - good or non-event case / not-survived (1) - bad or event case. The general information about predictors is represented below:
- name (string) - Passenger's name
- pclass (numeric) - Ticket class
- sex (category) - Gender
- age (numeric) - Age in years
- sibsp (numeric) - Number of siblings/spouses aboard the Titanic
- parch (numeric) - Number of parents/children aboard the Titanic
- ticket (category) - Ticket number
- fare (numeric) - Passenger fare
- cabin (category) - Cabin number
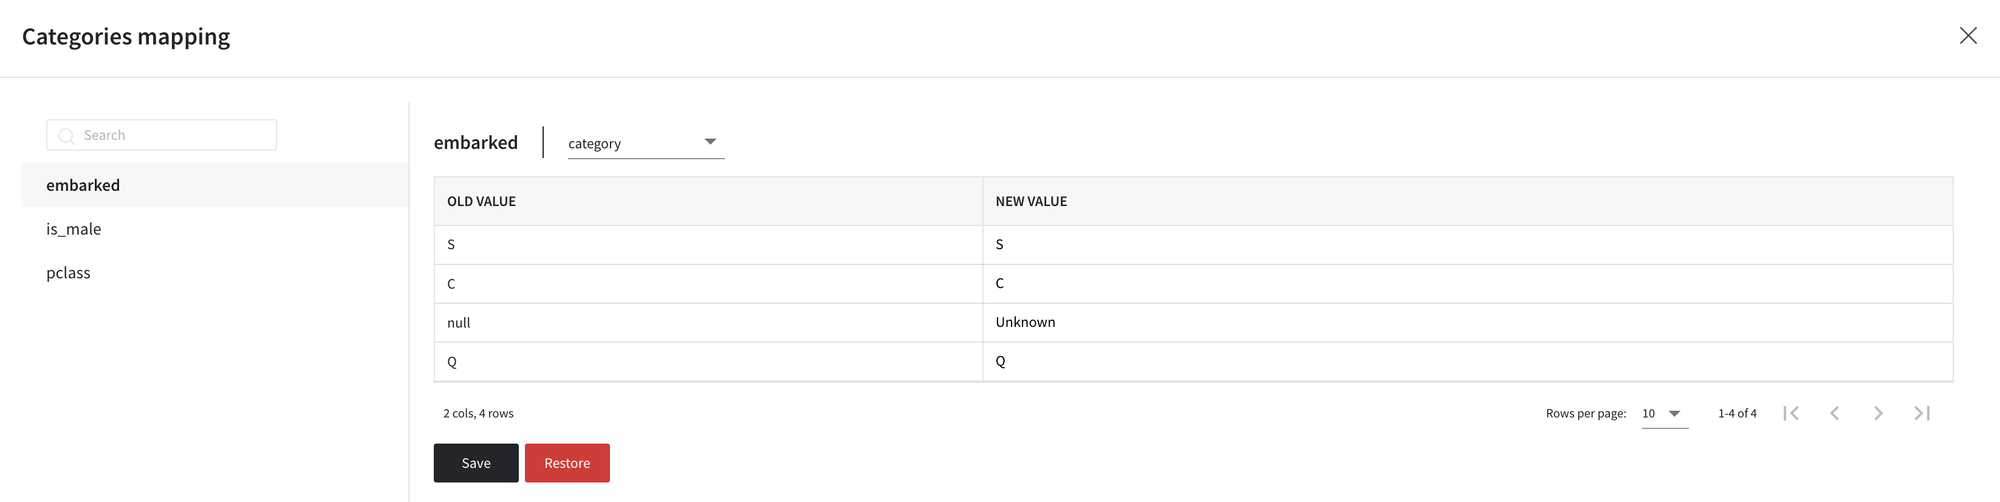
- embarked (category) - Port of Embarkation
And let's assume, that we want to manually map the values of some categorical columns for potential future analysis. Among the columns, we choose:
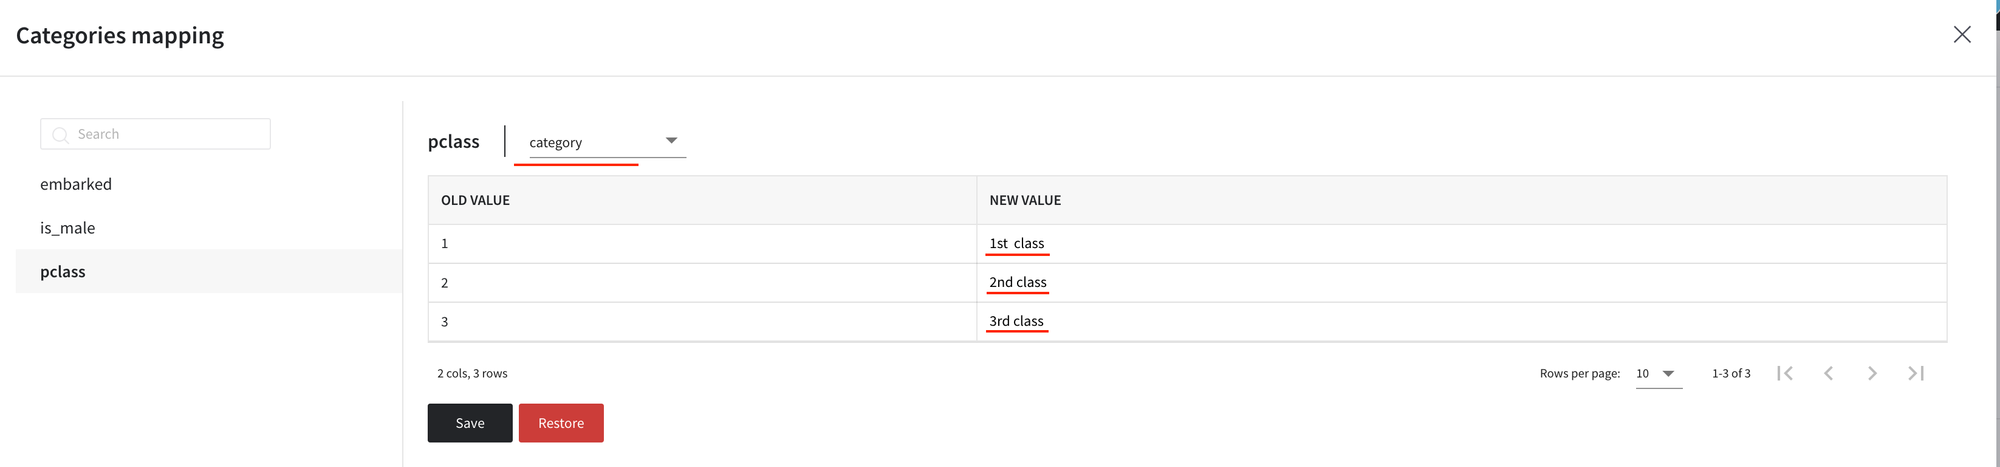
- pclass - we want to change numeric values to more informative categories, like the ‘1st class’
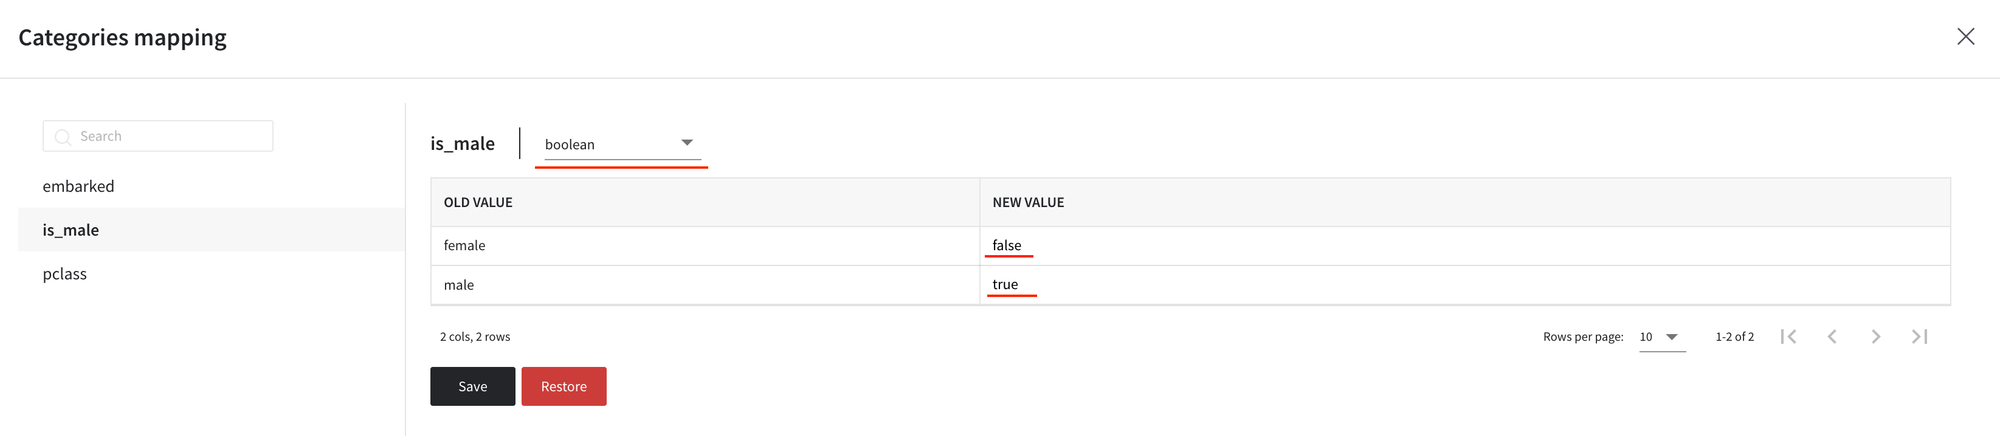
- sex - we, first, rename the column to is_male (using the Rename Columns brick) and then convert the values to a binary variable
- embarked - that column has null values that we want to be changed to ‘Unknown’
Building and executing pipeline
First of all, we need to drag'n'drop the required bricks onto the stage (and connect them one by one) in the next order:
- From the Datasets → Samples, we need to choose the titanic.csv file.
- Then connect it to the Rename Columns brick, where we specify the sex column to be renamed to is_male.
- Finally, take the Categories Mapping brick and filter out all columns except for pclass, is_male and embarked (consider using the ‘Remove all except selected’ checkbox).
Then, execute the pipeline and the ‘Open dashboard’ option will appear in the right-side menu:
Inside the dashboard, we would need to do some manual mapping with the following steps:
- For the embarked column, specify ‘Unknown’ as a new value for null
- For the is_male column, first, change the data type to a boolean, then set new values to ‘false’ for females and ‘true’ for males. Note, that Categories Mapping supports true/false, True/False, and 1/0 as boolean values
- For the pclass column, change values to ‘1st class’, ‘2nd class’, and ‘3rd class’ respectively, and cast to the categorical type:
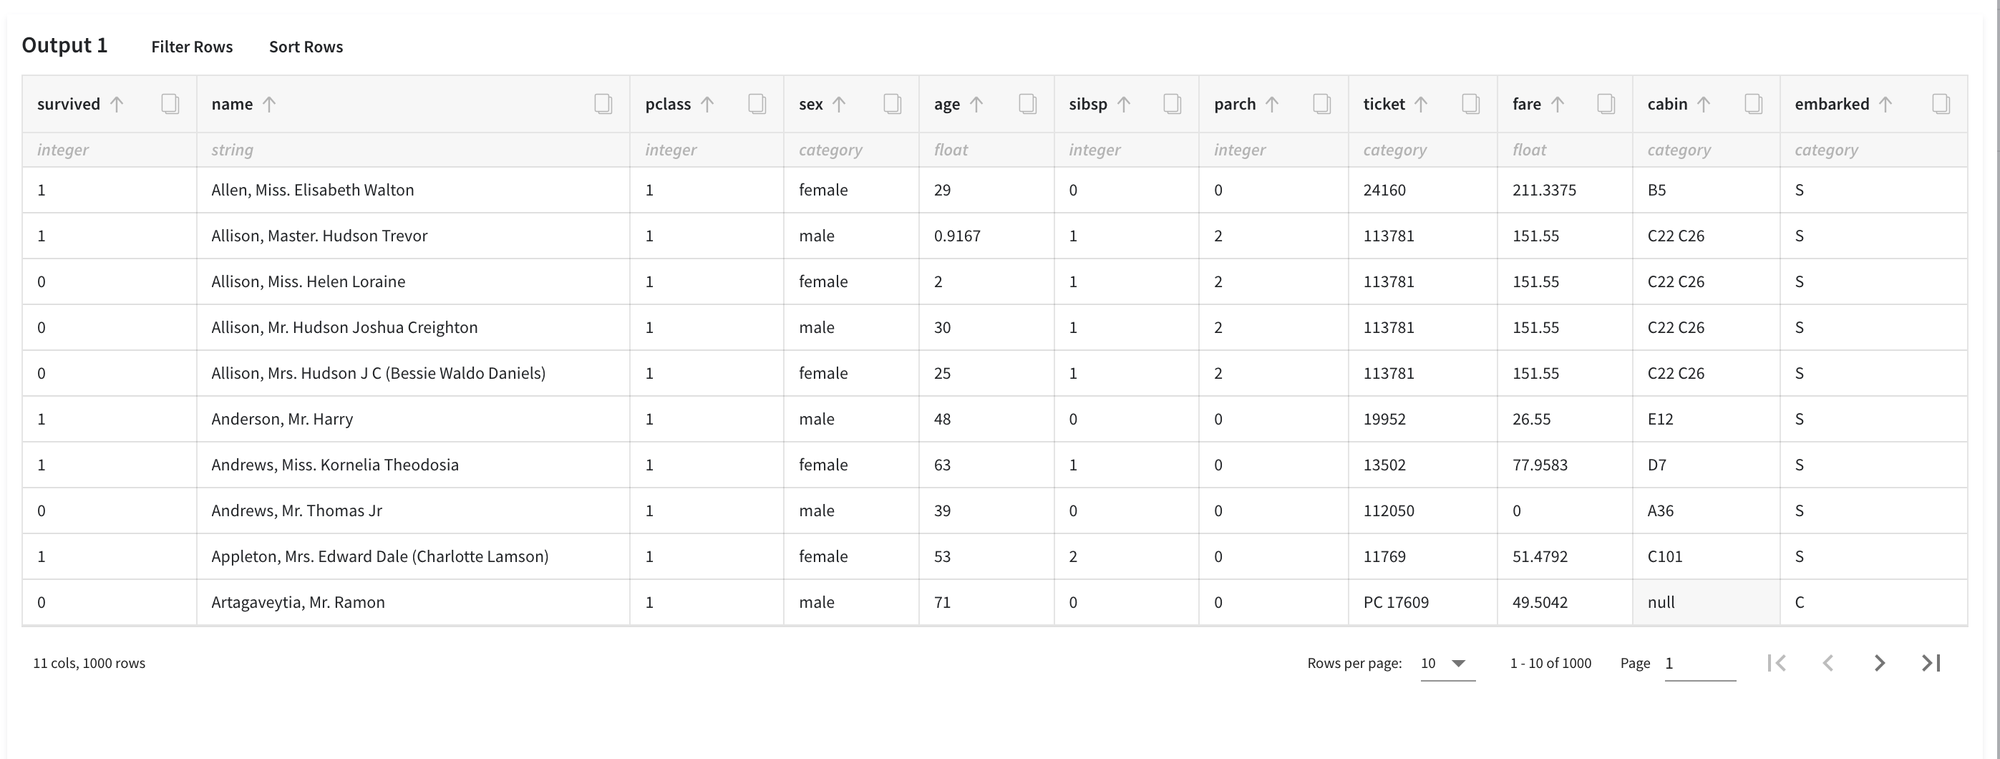
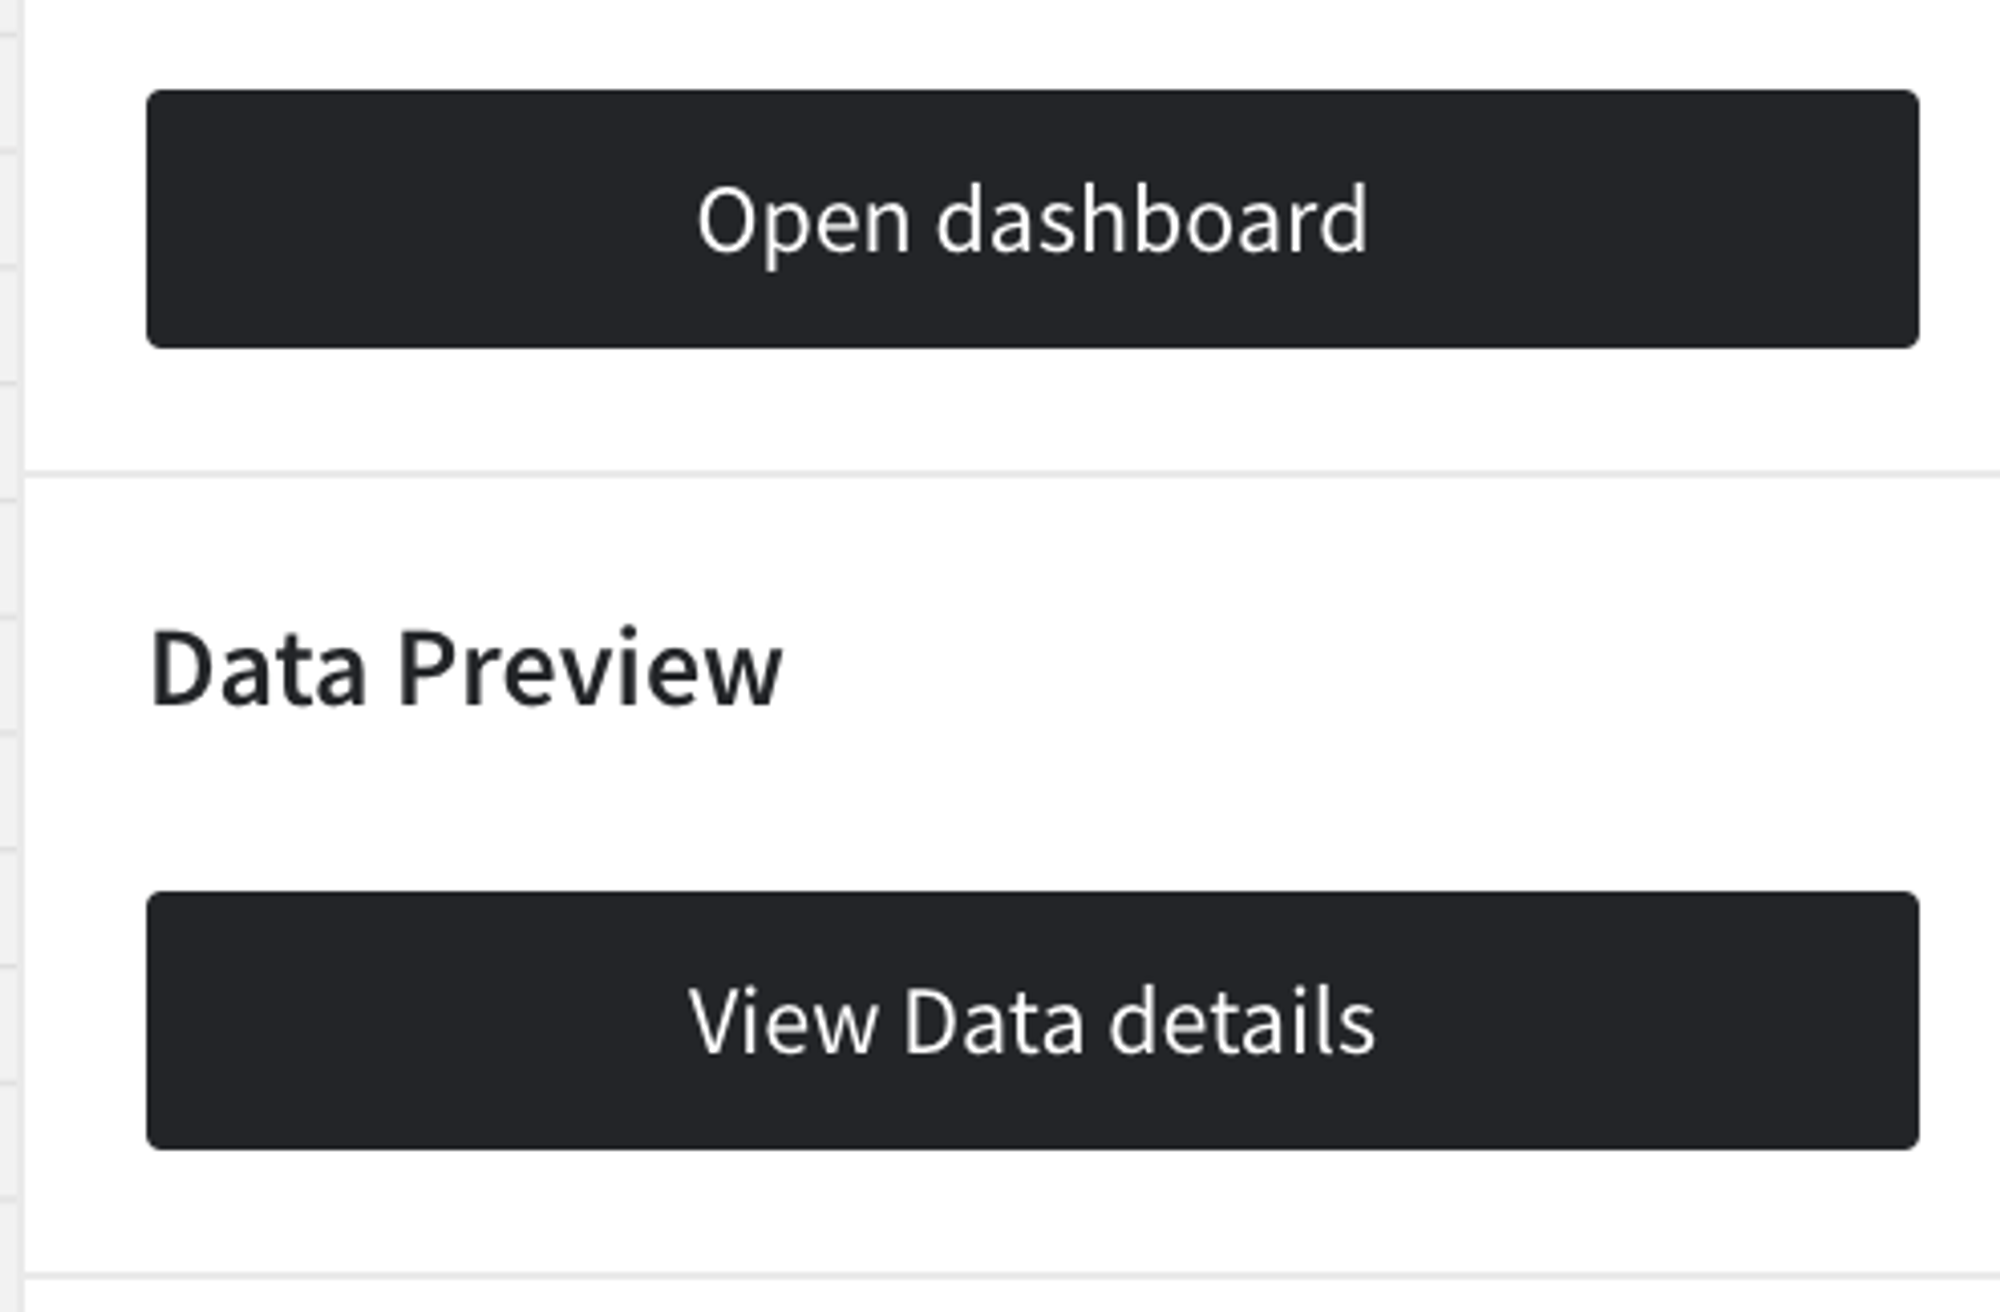
Then, Save the changes and execute the pipeline one more time. In order to see the results, you should open the Data Preview on the right sidebar.
The results are depicted in the following table: