Random forest is an ensemble learning method based on the construction of a multitude of decision trees. It solves regression tasks by outputting the averaged prediction of the individual trees.
Description
Brick Locations
Bricks → Machine Learning → Random Forest Regression
Simple mode
- Target variable
Binary target column to predict from the input dataset.
- Optimize
This checkbox enables the Bayesian hyperparameter optimization, which tweaks the learning rate, as well as the number of iterations and leaves, to find the best model's configuration in terms of metrics.
Be aware that this process is time-consuming.
- Disallow negative predictions
This checkbox forces the model to round up negative values to be equal to 0.
- Filter Columns Settings - Columns
Columns from the dataset that are ignored during the training but not removed from the dataset. Multiple columns can be selected by clicking the + button.
In case you want to remove a large number of columns, you can select the columns to keep and use the flag ‘Remove all except selected’.
Advanced mode
The advanced mode features an additional set of parameters:
- Learning rate
Boosting learning rate. This parameter controls how quickly or slowly the algorithm will learn a problem. Generally, a bigger learning rate will allow a model to learn faster while a smaller learning rate will lead to a more optimal outcome.
- Number of boosted trees
A number of estimators (boosted trees) to fit.
- Number of leaves
Maximum tree leaves for base learners. The main parameter to control model complexity. Higher values should increase accuracy but might lead to overfitting.
- Minimum data in leaves
The minimum number of data needed in a child (leaf).
- Minimum Loss Reduction
The minimal gain to perform a split. Can be used to speed up the training process.
- Bagging Fraction
A fraction of data samples (rows) that will be randomly selected on each iteration (tree).
- Feature Fraction
A fraction of features (columns) that will be randomly selected on each iteration (tree).
- L1 regularization weight
Lasso Regression (L1) - Least Absolute Shrinkage and Selection Operator - regularization term on weights.
- L2 regularization weight
Ridge Regression (L2) regularization term on weights.
- Maximum tree depth
A checkbox ‘Use maximum tree depth’ allows you to set the maximum tree depth for base learners, <=0 means no limit.
- Train Explainer
It is a parameter that will build a model explainer for API usage, you can learn more details here.
Brick Inputs/Outputs
- Inputs
Brick takes the dataset with a continuous target variable
- Outputs
- Brick produces the dataset with an extra column with the prefix ‘predicted_’ for the predicted value of a target variable
- A trained model that can be used in other bricks as an input
Example of usage
Let's consider a simple regression problem, where we know the characteristics of some houses and want to know their sale price. We have the next variables:
- Id (category/int) - Sale's ID
- Neighborhood (category/string) - House neighborhood name
- YearBuilt (int) - The year when a house has been built
- RoofMatl (category/string) - The materials used to construct the roof
- GrLivArea (int) - The living area
- YrSold (int) - The year when a house was sold
- SalePrice (int) - The price at which the house was sold. Target variable.
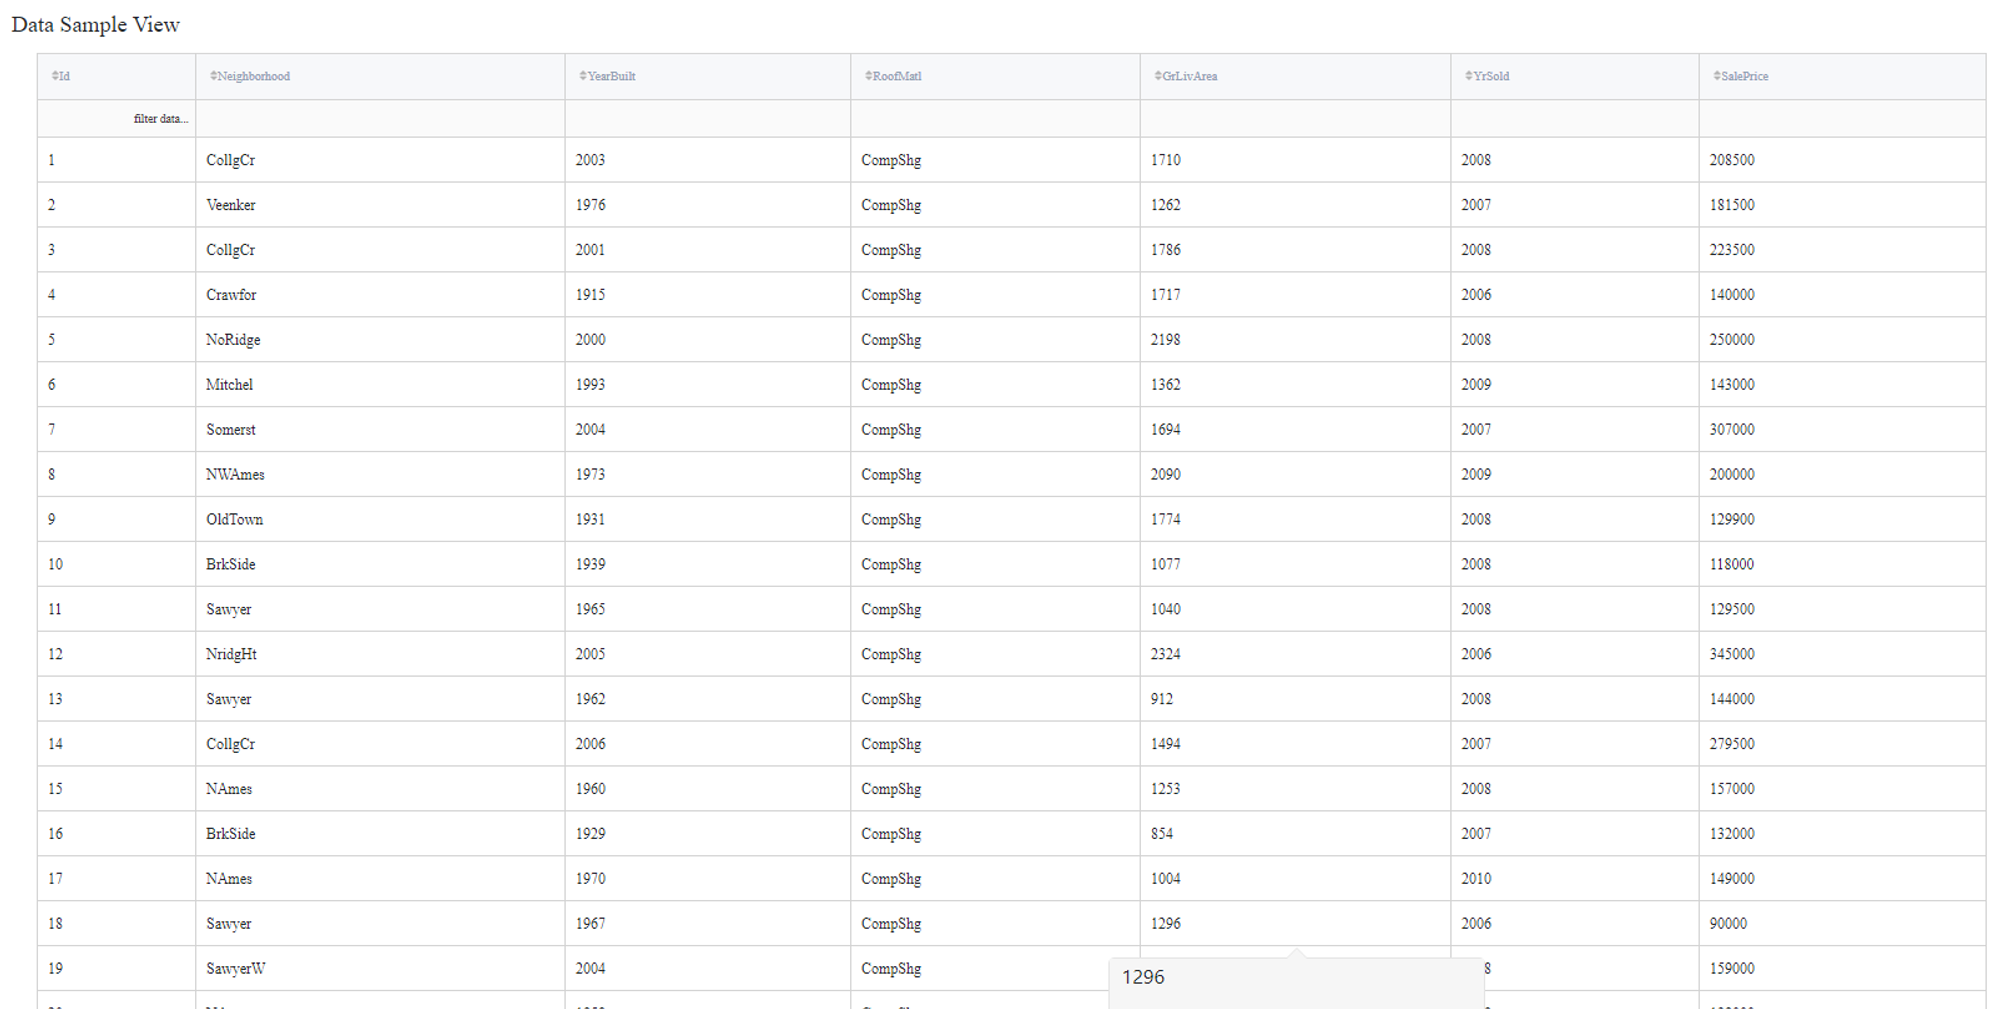
Some of the data columns are strings, which is not a supported data format for the Random Forest Regression model, so we will need to label encode the next columns:
- Neighborhood label
- RoofMatl label
In addition, Id does not contain useful information, so it will be filtered out during the training.
The next steps can be made to build a simple test pipeline:
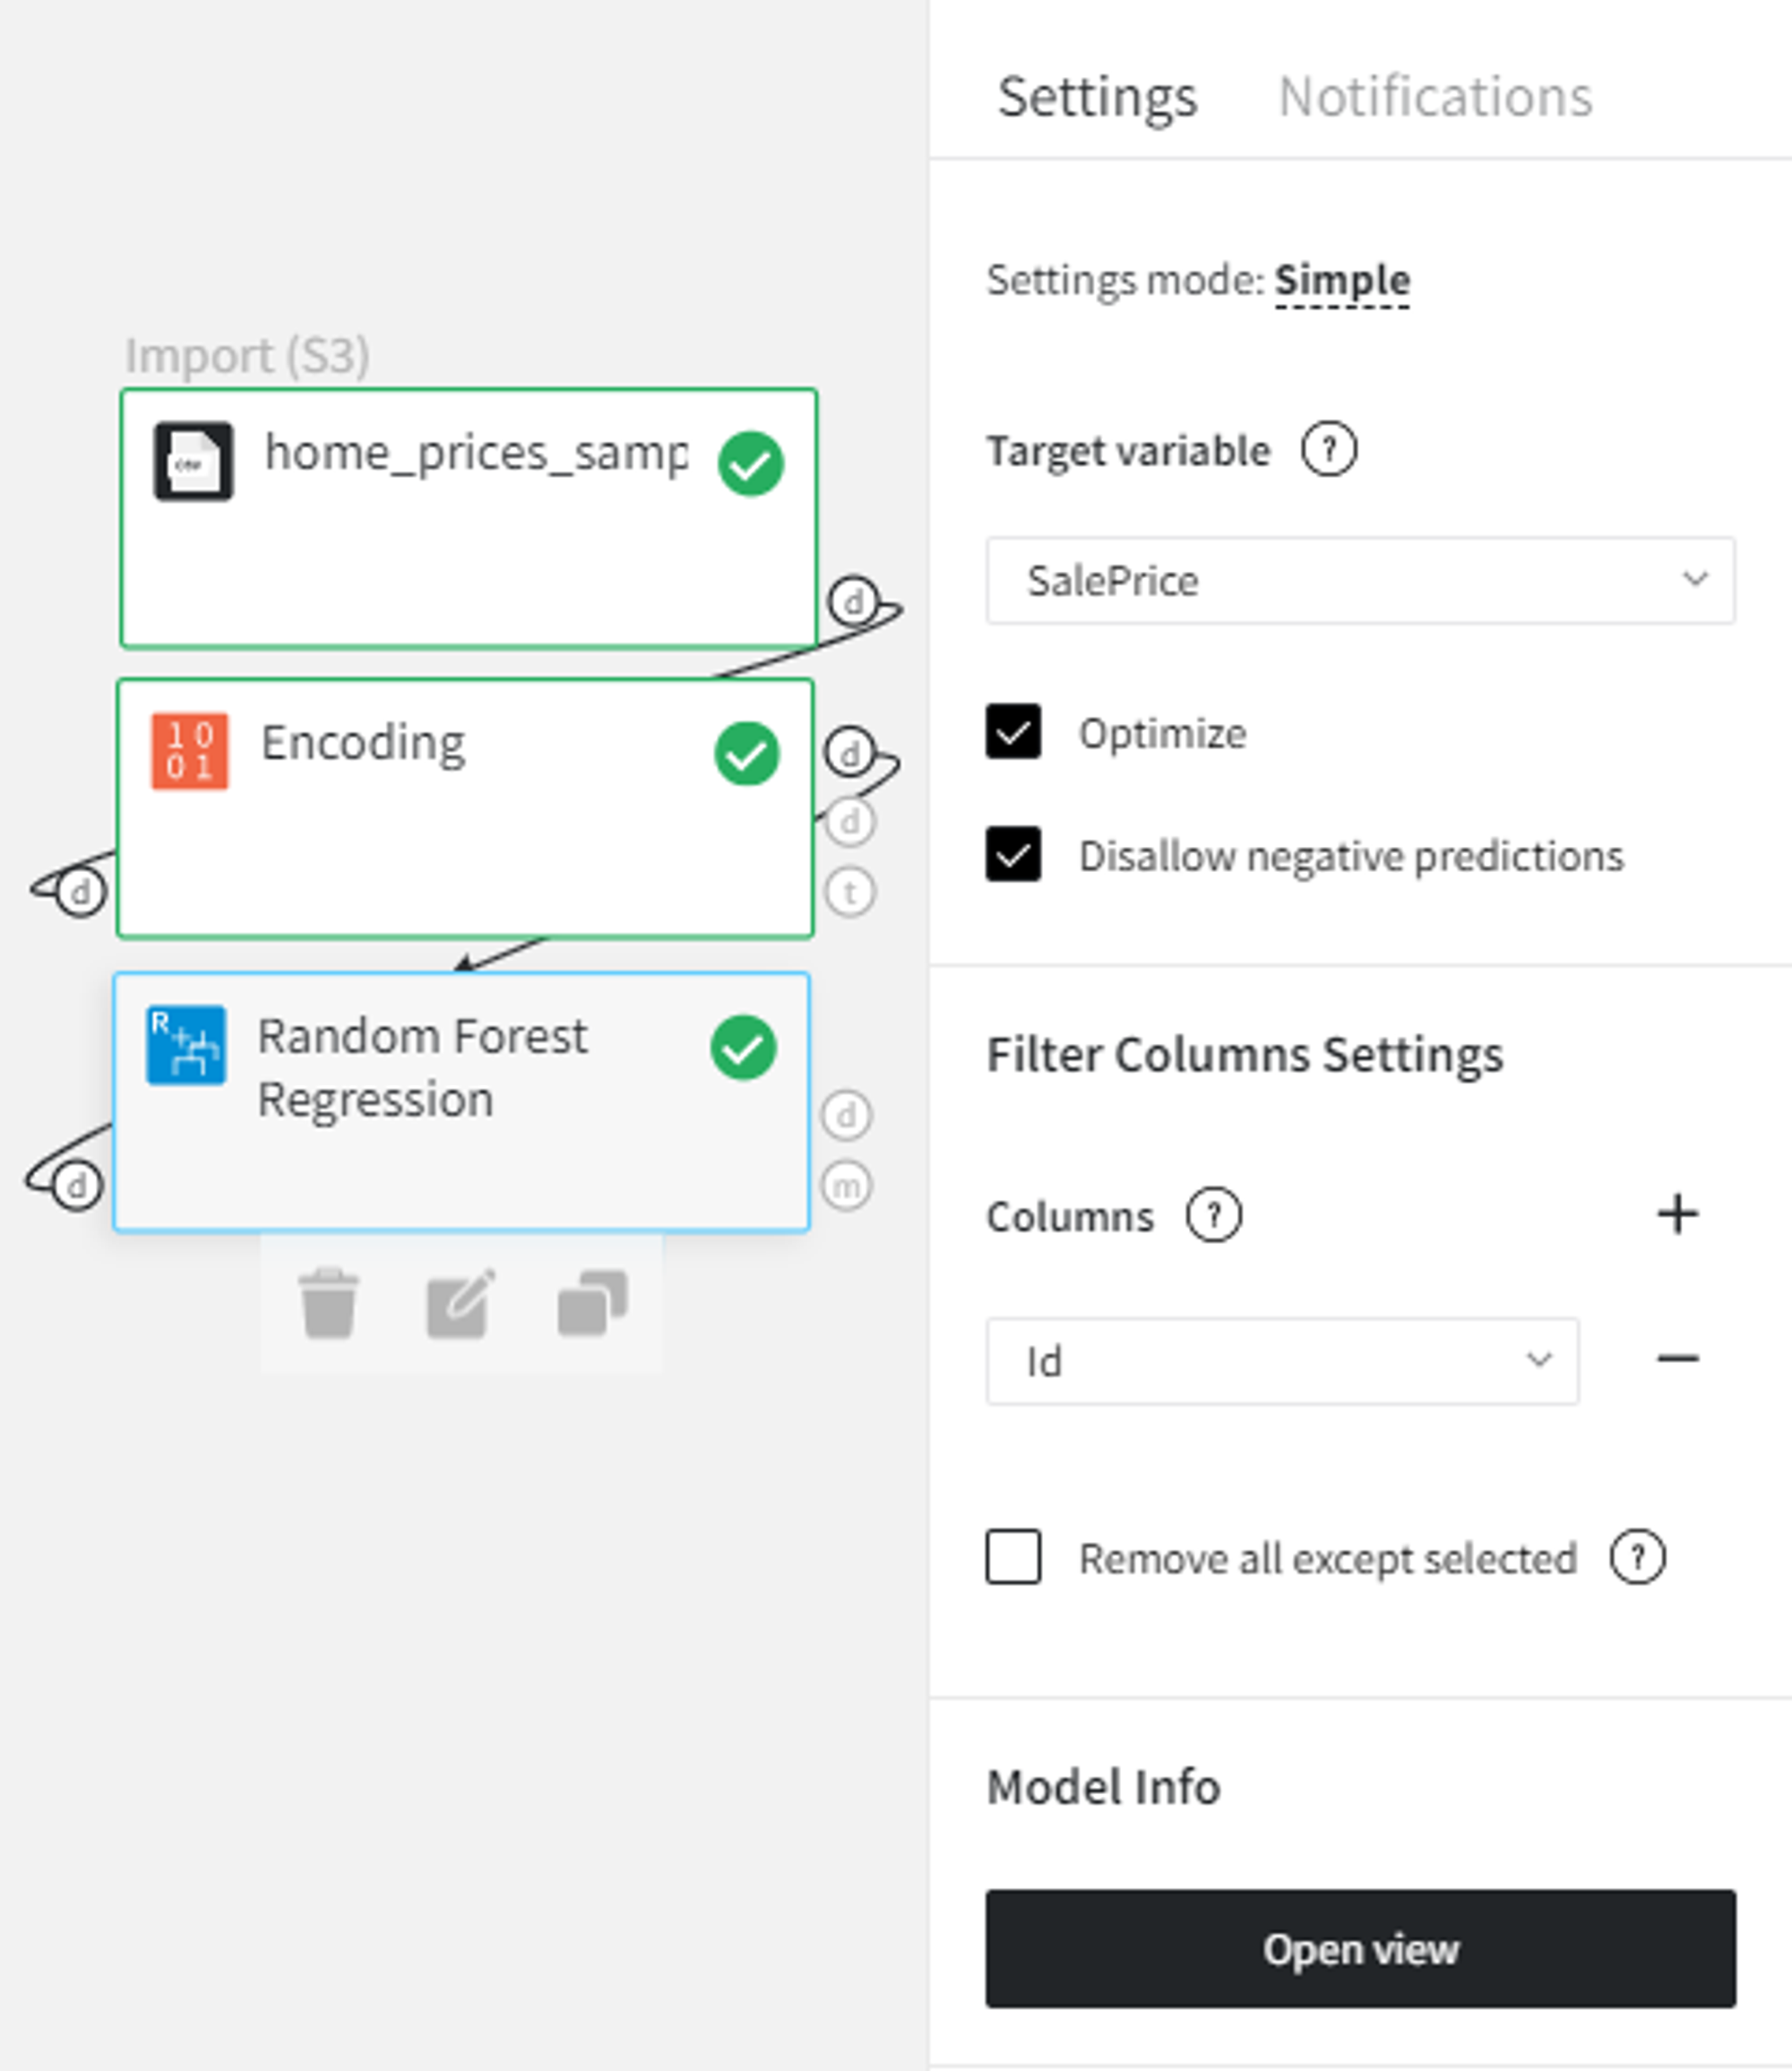
- First, drag'n'drop home_prices_sample.csv file from Datasets→Samples folder, Encoding brick from Bricks →Transformation, as well as Random Forest Regression from Bricks → Machine Learning
- Connect the dataset to the Encoding brick, set it up according to the previous section, and then connect it to the Random Forest Regression model
- Select the Random Forest Regression brick, specify the target variable (the SalePrice column) and the Id column to filter. Check the Disallow negative predictions to ensure that predictions will not be less than 0.
- Check the Optimize option if you like
- Run pipeline
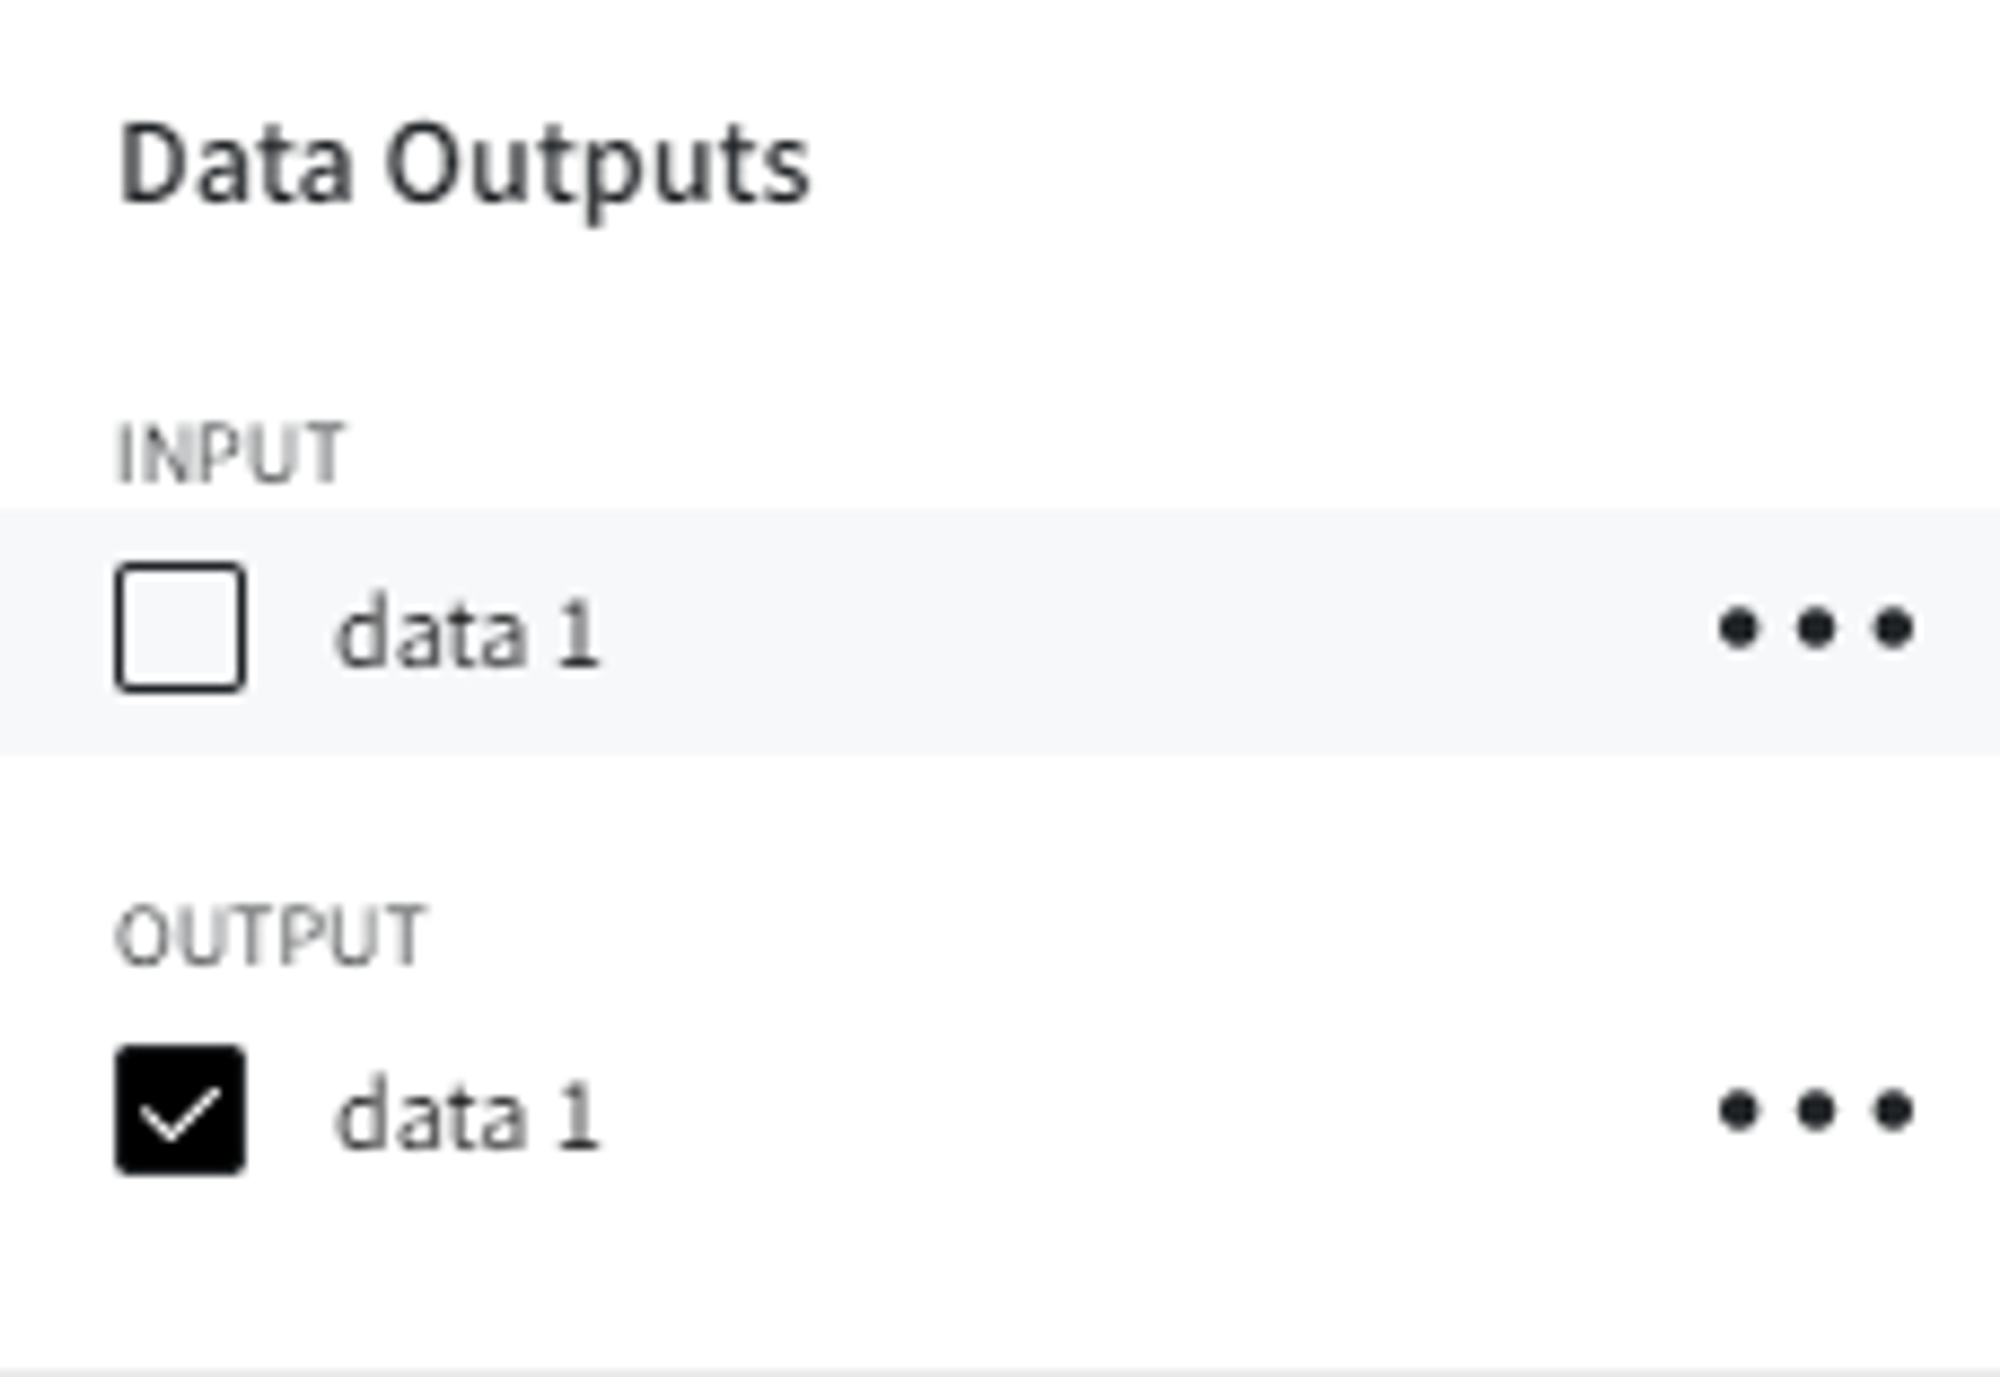
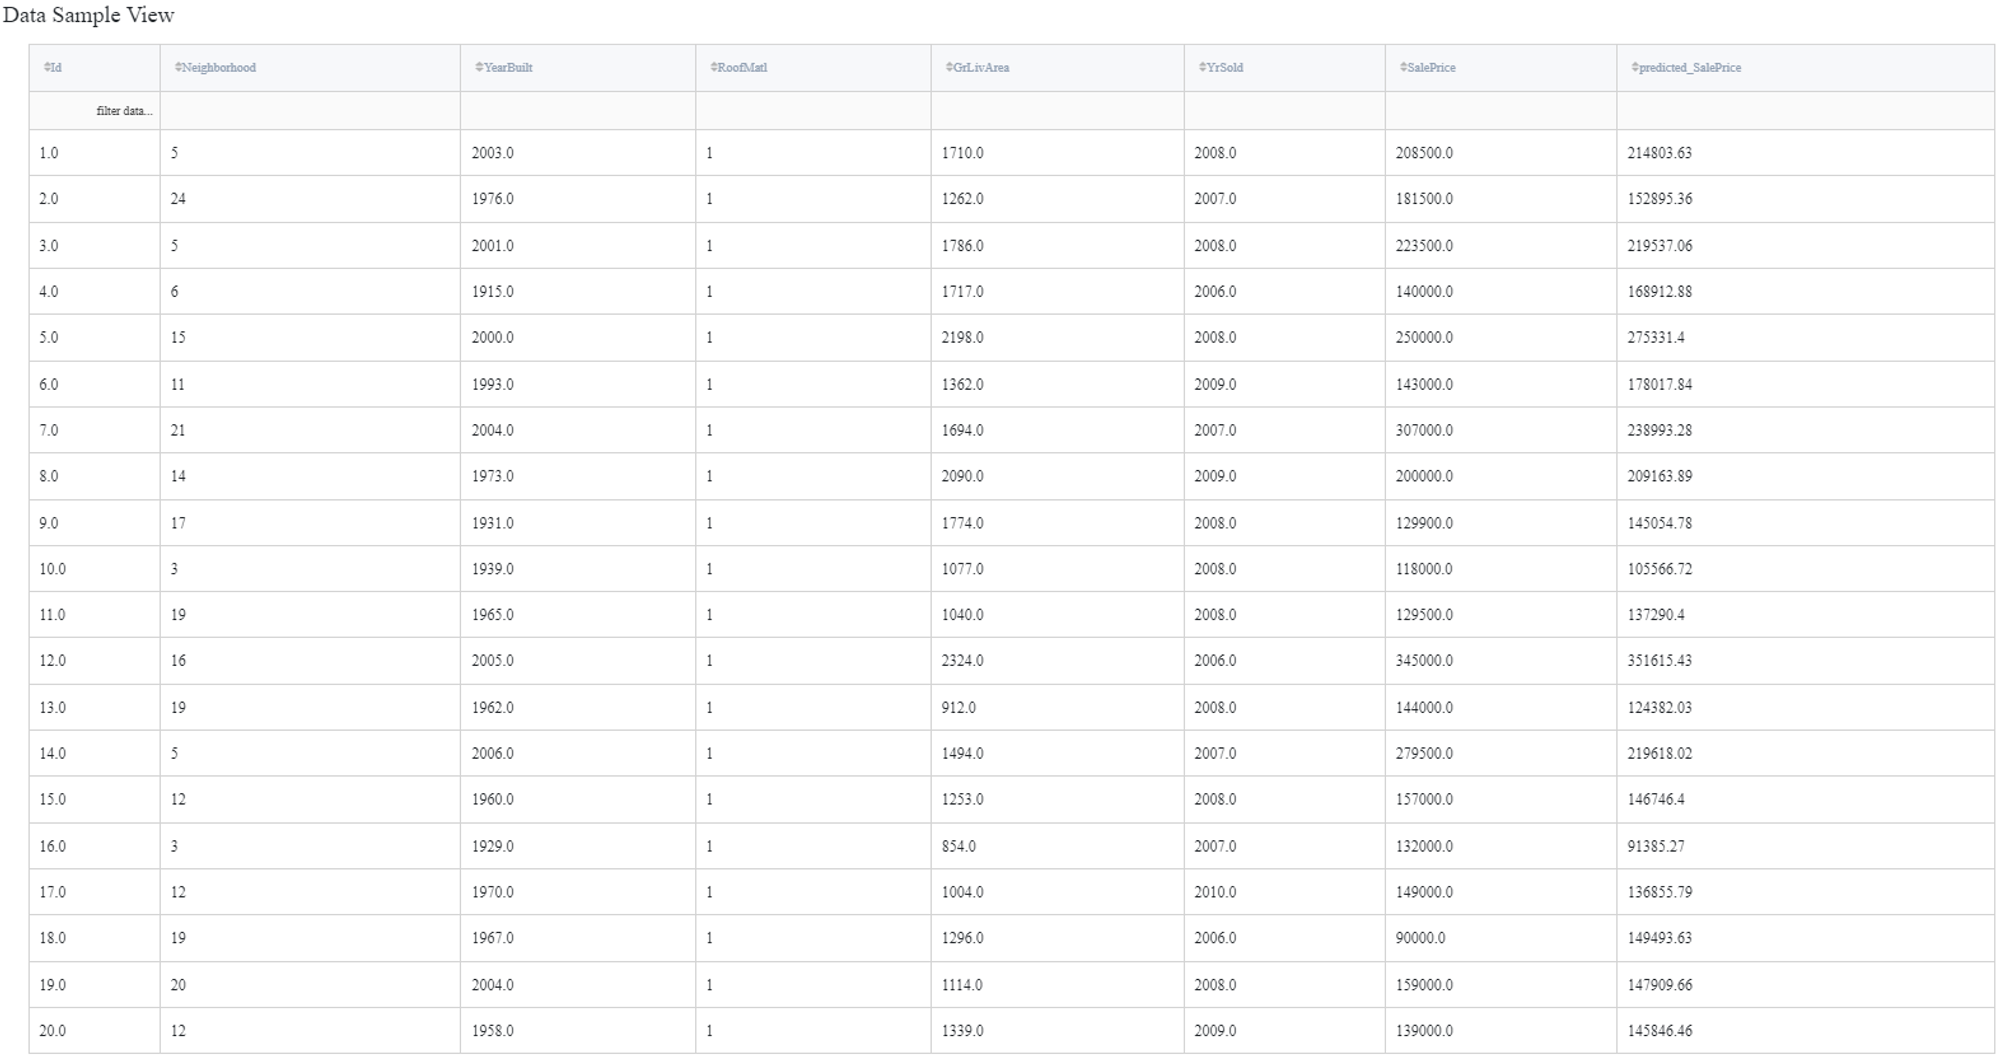
In order to see the processed data with new columns, you should open the Output data previewer on the right sidebar.
The results are depicted in the table:
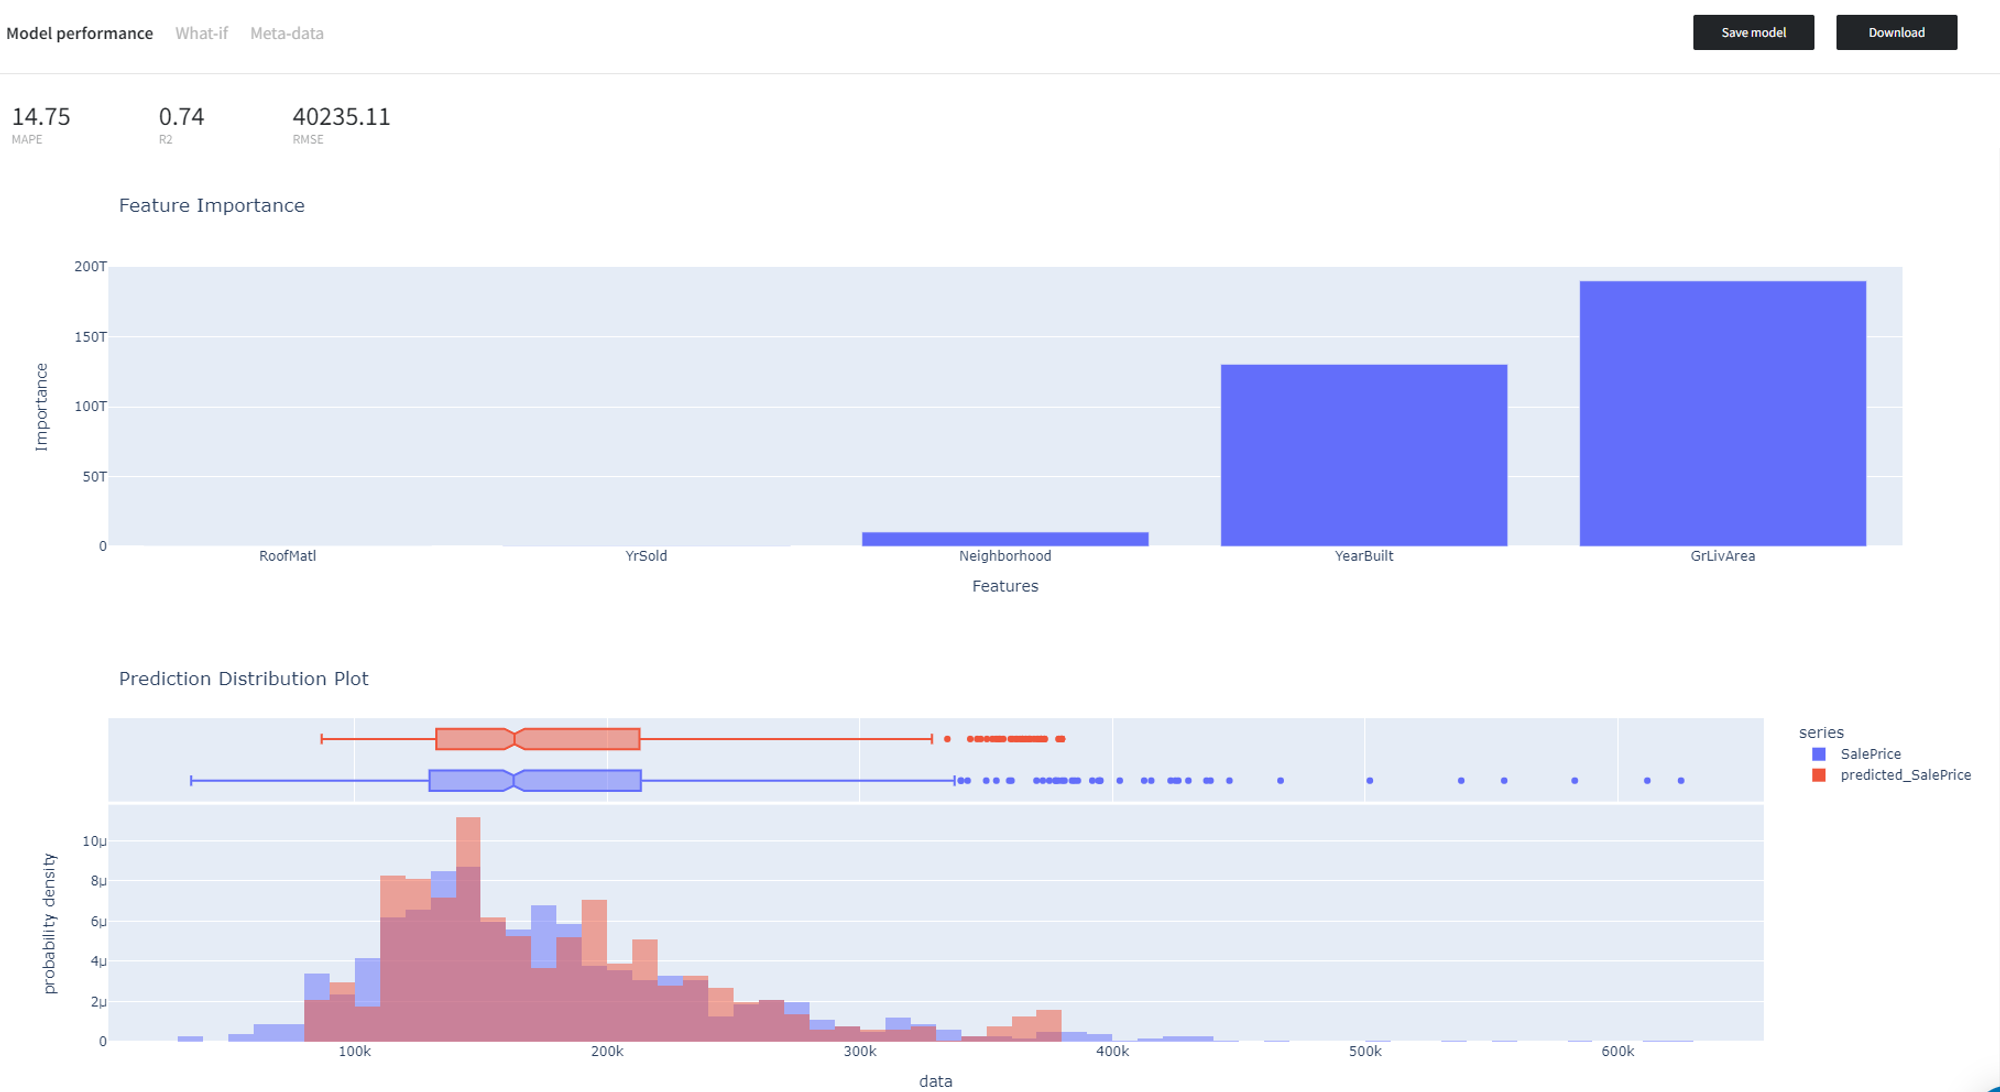
To see the model's performance just choose the corresponding option in the Model Info section:
