General Information
This component can be used for solving one of the most popular unsupervised machine learning problems - Data Segmentation or Cluster Analysis. Unsupervised learning unites the algorithms that learn patterns from untagged data.
The primary goal of unsupervised machine learning is to discover some previously unknown patterns in data and use them for :
- detecting any cases when the patterns are broken (anomaly detection),
- Unlike Supervised learning that requires the labeled data for the model training and validation, in the case of Unsupervised learning, we do not have any ground trues or the golden standard, which could be used for the models' quality grounding. Still, understanding the business domain and the nature of data allows choosing the most appropriate approach for the patterns' extraction and decision making.dividing the data into groups, which are characterized by the significantly more substantial similarity between objects inside one group in comparison with the objects belonging to the different groups (data segmentation)
Unlike Supervised learning that requires the labeled data for the model training and validation, in the case of Unsupervised learning, we do not have any ground trues or the golden standard, which could be used for the models' quality grounding, but the understanding of the business domain and the nature of data allows to choose the most appropriate approach for the patterns' extraction and the decision making.
Cluster Analysis
According to the definition, Segmentation is the dividing of something into parts, which are loosely connected. Data Segmentation has many business applications - from medicine to retail that is explained by the ability to apply data mining techniques for patterns discovery and cluster analysis.
Cluster analysis task can be solved via various algorithms that depend on:
- way to measure the similarity/distance between objects. Distance or similarity measure depends on the data nature and their interpretation. For instance, when the objects are represented as an array of numerical features, we may use Euclidian or Cosine distance. At the same time, a set of categorical attributes characterizes the objects, Jaccard Similarity may be used.
- Way to combine the objects to the clusters (clustering criteria), for instance, centroid-based clustering leads to the finding the optimal set of the centroids assign the objects to the nearest cluster center. In contrast, clusters are defined as areas of higher density than the remainder of the data set in density-based clustering.
The result of cluster analysis strongly depends on data and is regulized via algorithms' hyperparameters.
Data Segmentation Pipeline
Undoubtedly, cluster analysis as part of the Data Mining discipline requires an experienced data scientist who can combine domain knowledge and data mining experience to obtain the results that will have business value. Still, for most problems that relate to the marketing domain, the Data Segmentation pipeline can be represented as the following process:
.png?table=block&id=7432e7eb-bbe1-4bba-b99f-35c7f07728c3&cache=v2)
The Data Preprocessing stage depends on not only data but the Clustering algorithm as well. One of the popular clustering algorithms is K-Means Clustering, so it may be considered a universal solution. This algorithm belongs to the centroid-based clustering group and allows iteratively find the optimal clusters' centroids when the number of clusters is defined. K-means algorithm has the following advantages:
- Scales to large data sets
- Can warm-start the positions of centroids
- Easily adapts to new examples
- Returns easily interpreted clusters
- Clusters quality can be accurately assessed
- Requires the number of clusters to be known
The significant disadvantages of the algorithm are:
- Sensitivity to scale - dataset's rescaling via normalization or standardization significantly impacts the final result. Features with different scales have different influences on the centroids assessment.
- Handle numerical data only
- Sensitive to the multicollinearity in features - correlated features may have a higher weight in the centroids assessment.
- Requires the number of clusters to be known
To handle the potential issues with performing the Data Segmentation by using K-Means, we should preprocess the data:
- Remove non-informative or low-quality features. We may consider low-quality features the features, which are
- constants
- have a high percentage of the missing values
- categorical features with a too big number of unique values.
- Transform Categorical Data to Numerical - binary encoding for the categorical variables with two unique values and one-hot encoding otherwise.
- Normalize data - use min-max scaling for leading the data to the same scale.
- Remove Missing Values - fill the missing values by the estimated average.
- Reduce multicollinearity via selecting the independent features via Variance Inflation Factor analysis
Finally, we need to define the optimal number of clusters, because the algorithm requires an exact number. For this purpose, we are using the modification of the Elbow method:
Brick Usage
Data Segmentation Brick supports two modes of usage:
- Simple mode - the user defines the number of clusters - it could be some exact value or the user can choose the auto-detection option. Also, the user may specify if the categorical features should be included in the feature vector.
Simple Mode Configuration
Name
Enaibled
Method
- Advanced mode - the user gets the possibility to configure the list of the columns to be processed, and also they can turn off the normalization of features and feature selection.
Advanced Mode Configuration
Name
Enaibled
Method
Description
Brick Location
Bricks → Analytics → Data Mining / AI → AutoML → Predictive Model
Brick Parameters
- Number of Clusters
The number of groups that data will be optimally split. This parameter is required for the K-Means clustering and might be configured manually or automatically regarding the clusterization quality criteria.
- Use non-numerical features
Simple mode option. The binary flag, which determines if the non-numerical features should be included in the feature-vector. If True, the non-numerical features, if possible, will be transformed to the numerical view via binary or one-hot encoding and used as the feature-vector components; if False - the numerical features only will be used.
- Normalize
Advances option. The binary flag determines if the features should be normalized before the training of the clustering model. If True, the Min-Max scaling will be applied to lead the features to the same scale, if False, the features will be passed to the model as they are.
- Filter Collinearity
Advances option. The binary flag determines if the high-correlated features should be excluded from the feature-vector. If True, the Feature Selection via Variance Inflation Factor analysis will be performed, if False, the full features will be passed to the model.
- Columns
- remove all mentioned columns from the dataset and proceed with the rest ones as with predictors
- use the selected columns as predictors and proceed with them
Advances option. List of possible columns for selection. It is possible to choose several columns for filtering by clicking on the '+' button in the brick settings and specify the way of their processing:
Remove all except selected
The binary flag, which determines the behaviour in the context of the selected columnsThe pipeline contains the completely configured and fitted bricks that are frozen to reproduce the Data Segmentation brick's results. The output pipeline can be saved via the Model Performance dashboard and used as a pipeline-brick.
Brick Inputs/Outputs
- Inputs
Brick takes the data set with the data should be clustering.
- Outputs
- Data - modified input data set with added columns for predicted clusters or classes' probability
Brick produces two outputs as a result:
Outcomes
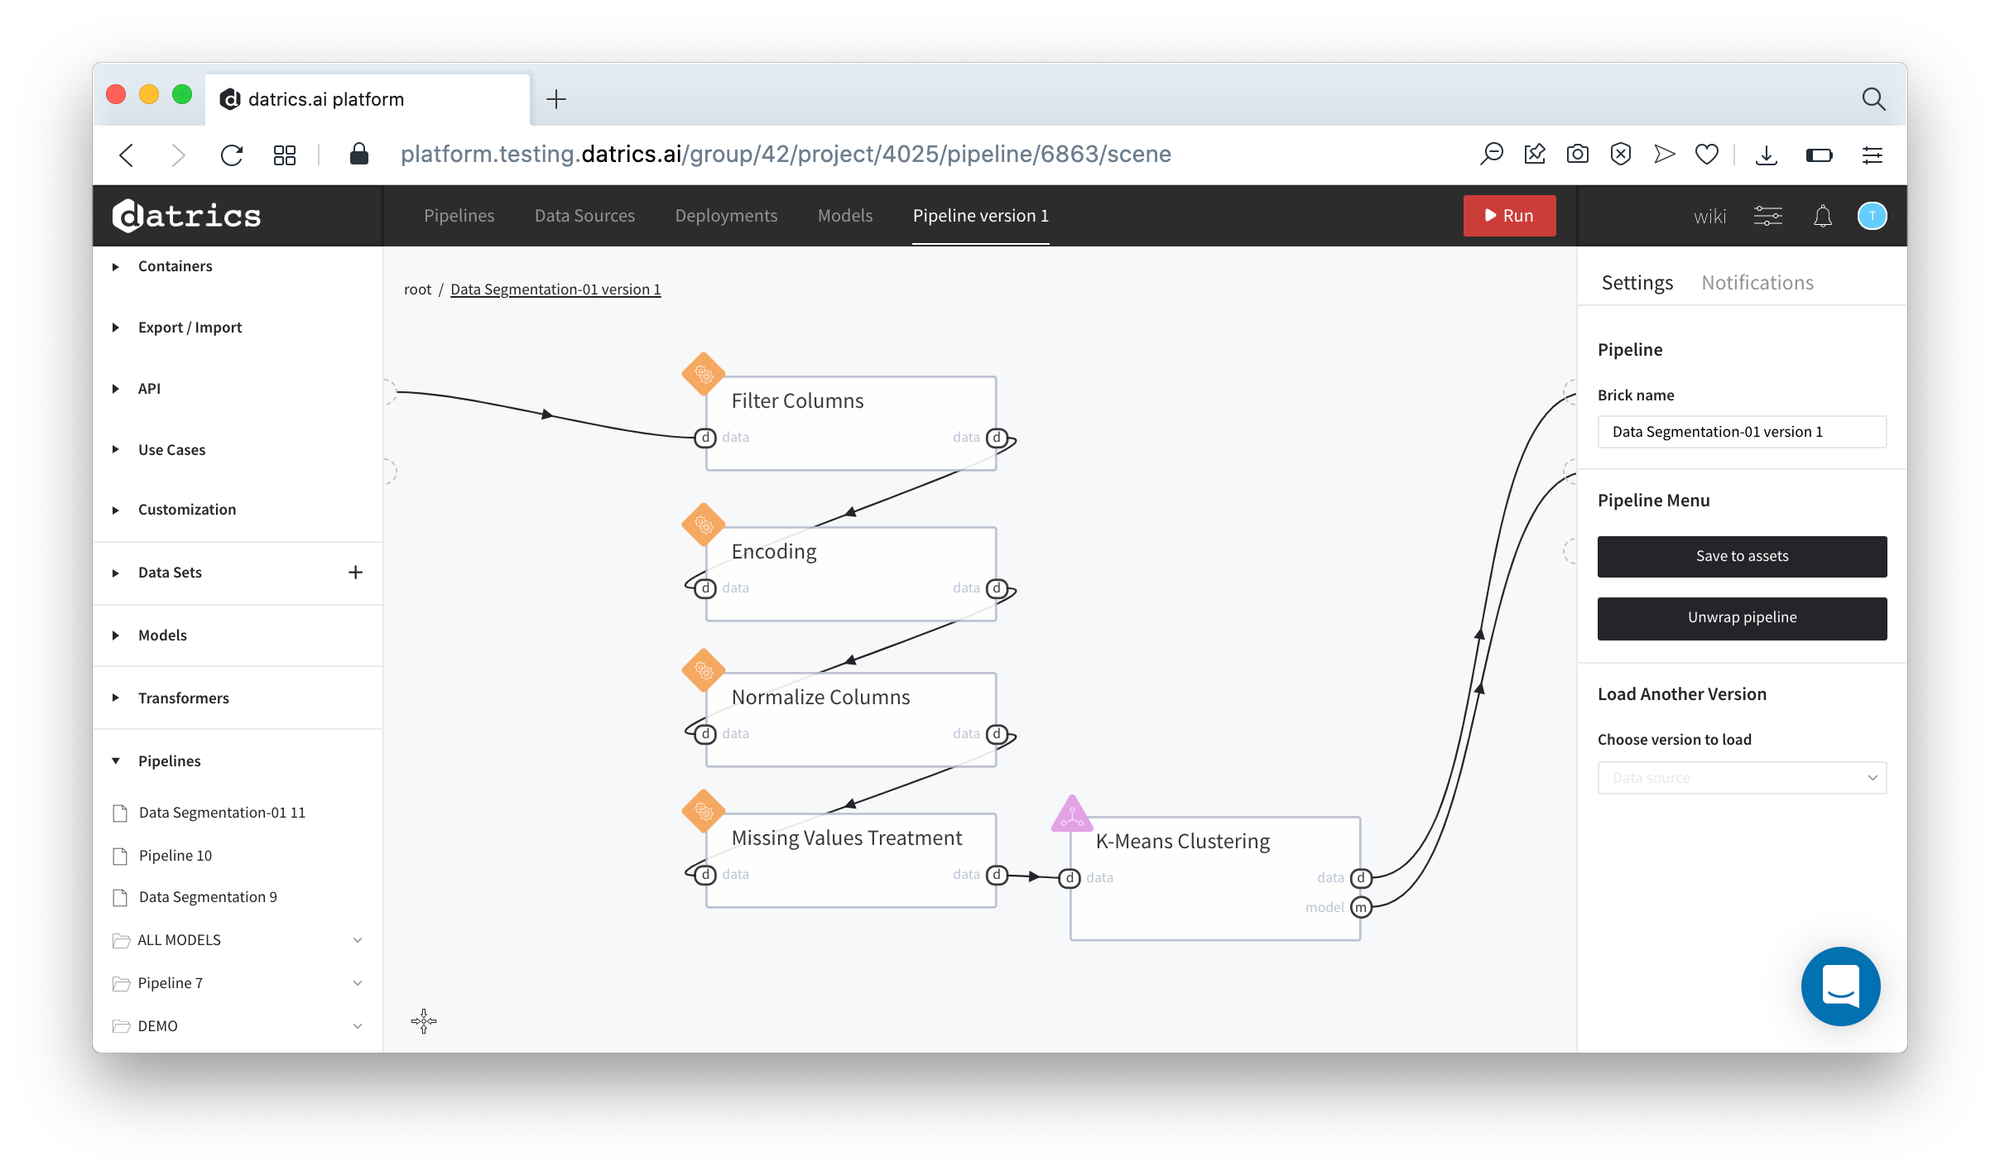
- Data segmentation pipeline - the pipeline that reproduces all steps of Data Preprocessing (Data Cleansing, Data Transformation, and Feature Selection) and modeling (K-Means clustering). The pipeline contains the completely configured and fitted bricks that are frozen so that the Data Segmentation brick's results can be reproduced. The output pipeline can be saved via the Model Performance dashboard and used as a pipeline-brick.
- Model Performance
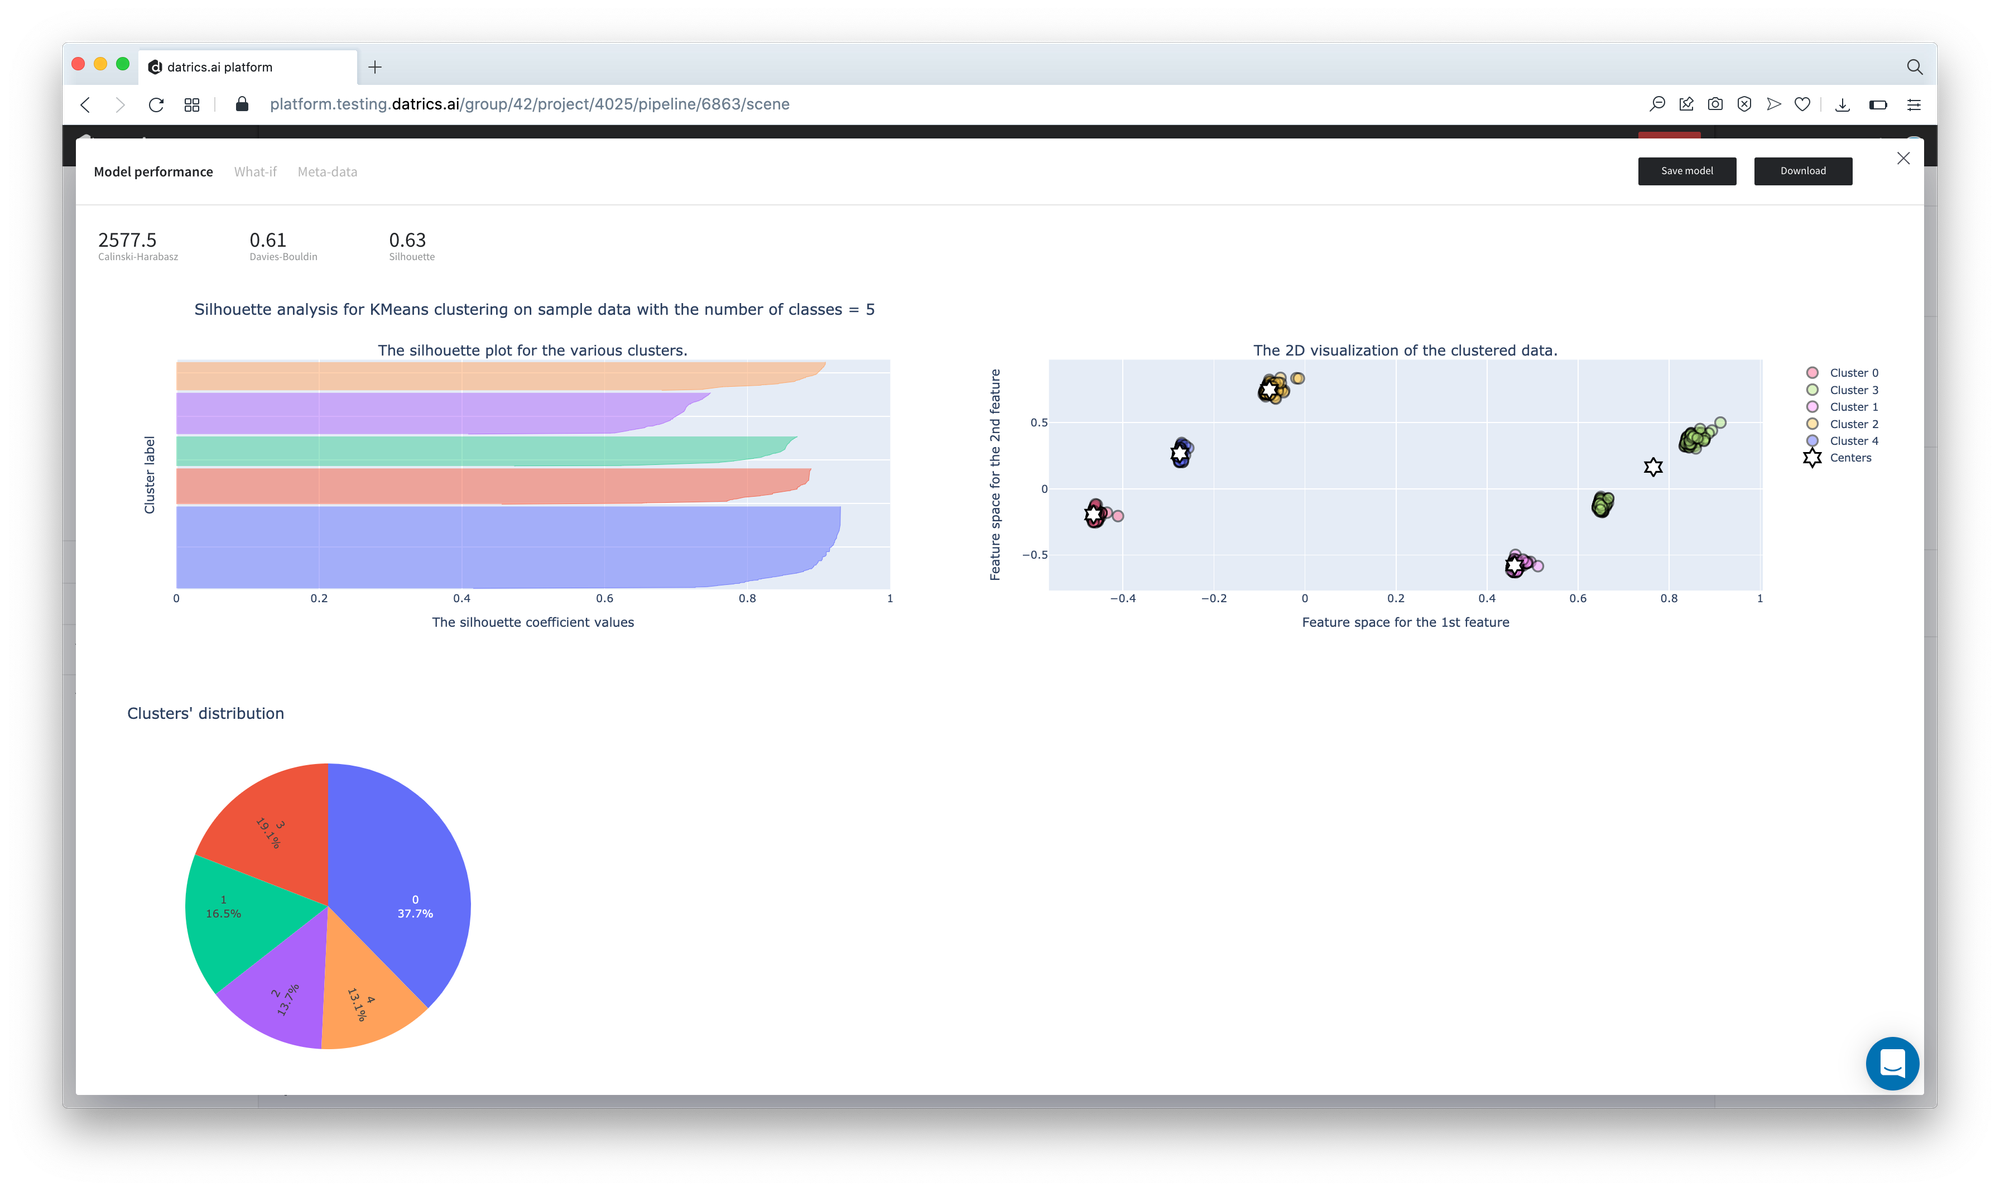
- Supported metrics: Calinski-Harabasz score, Davies-Bouldin score, and Silhouette score.
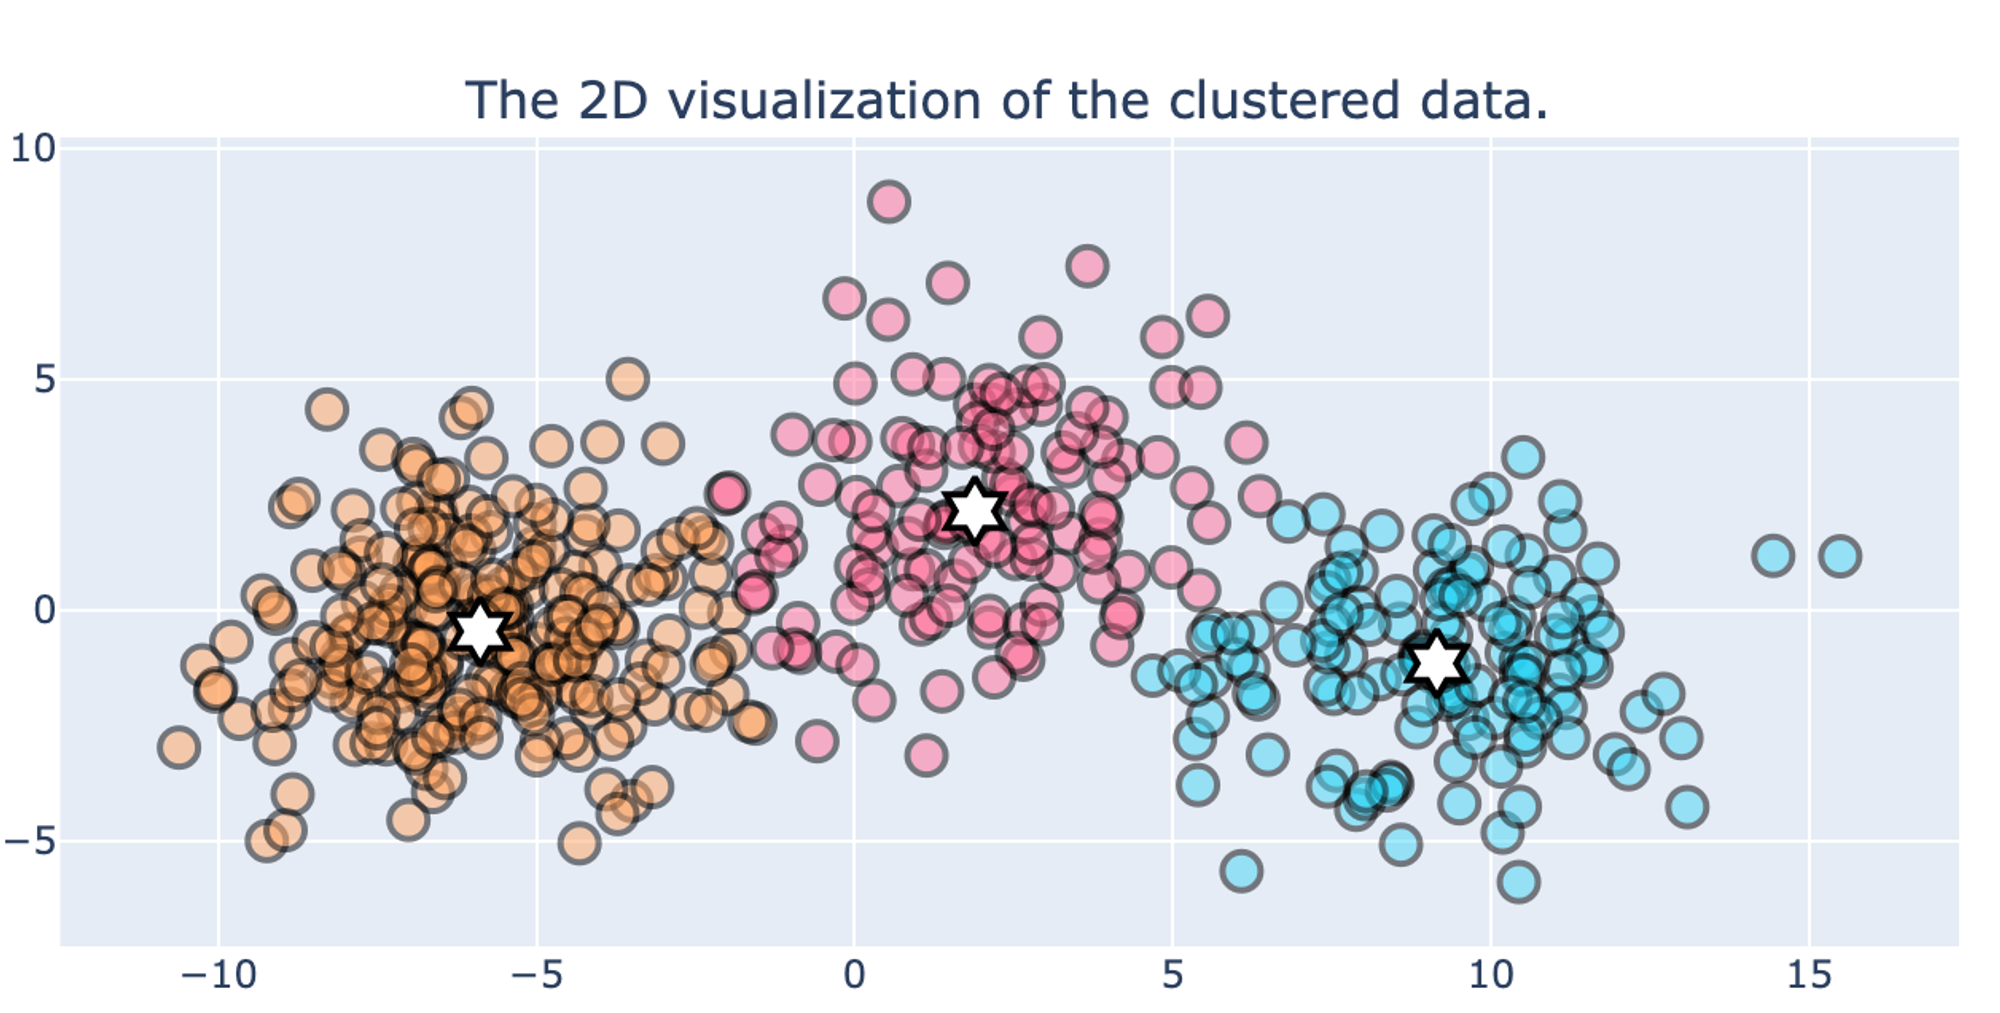
- Plots: Silhouette plot per cluster, cluster distribution, and 2-D visualization of the clusters with the corresponded centroids.
This button (located in the 'Deployment' section) gives you a possibility to check the model's performance (a.k.a. metrics) to adjust your pipeline then if needed.
Model performance tab depicts the Clustering quality metrics and charts:
- Save pipeline
Save Data Segmentation Pipeline - (see. Data Segmentation Pipeline)
- Download model
Use this feature, if you want to download K-Means model's asset to use it outside Datrics platform.
Example of usage
Let's try to make a segmentation of the Titanic passengers with respect to their features. For this purpose we may take the titanic.csv dataset and connect it with the Data Segmentation brick.
Dataset description
See Titanic Dataset
Executing simple-mode pipeline
Next steps would be made to build a simple test pipeline:
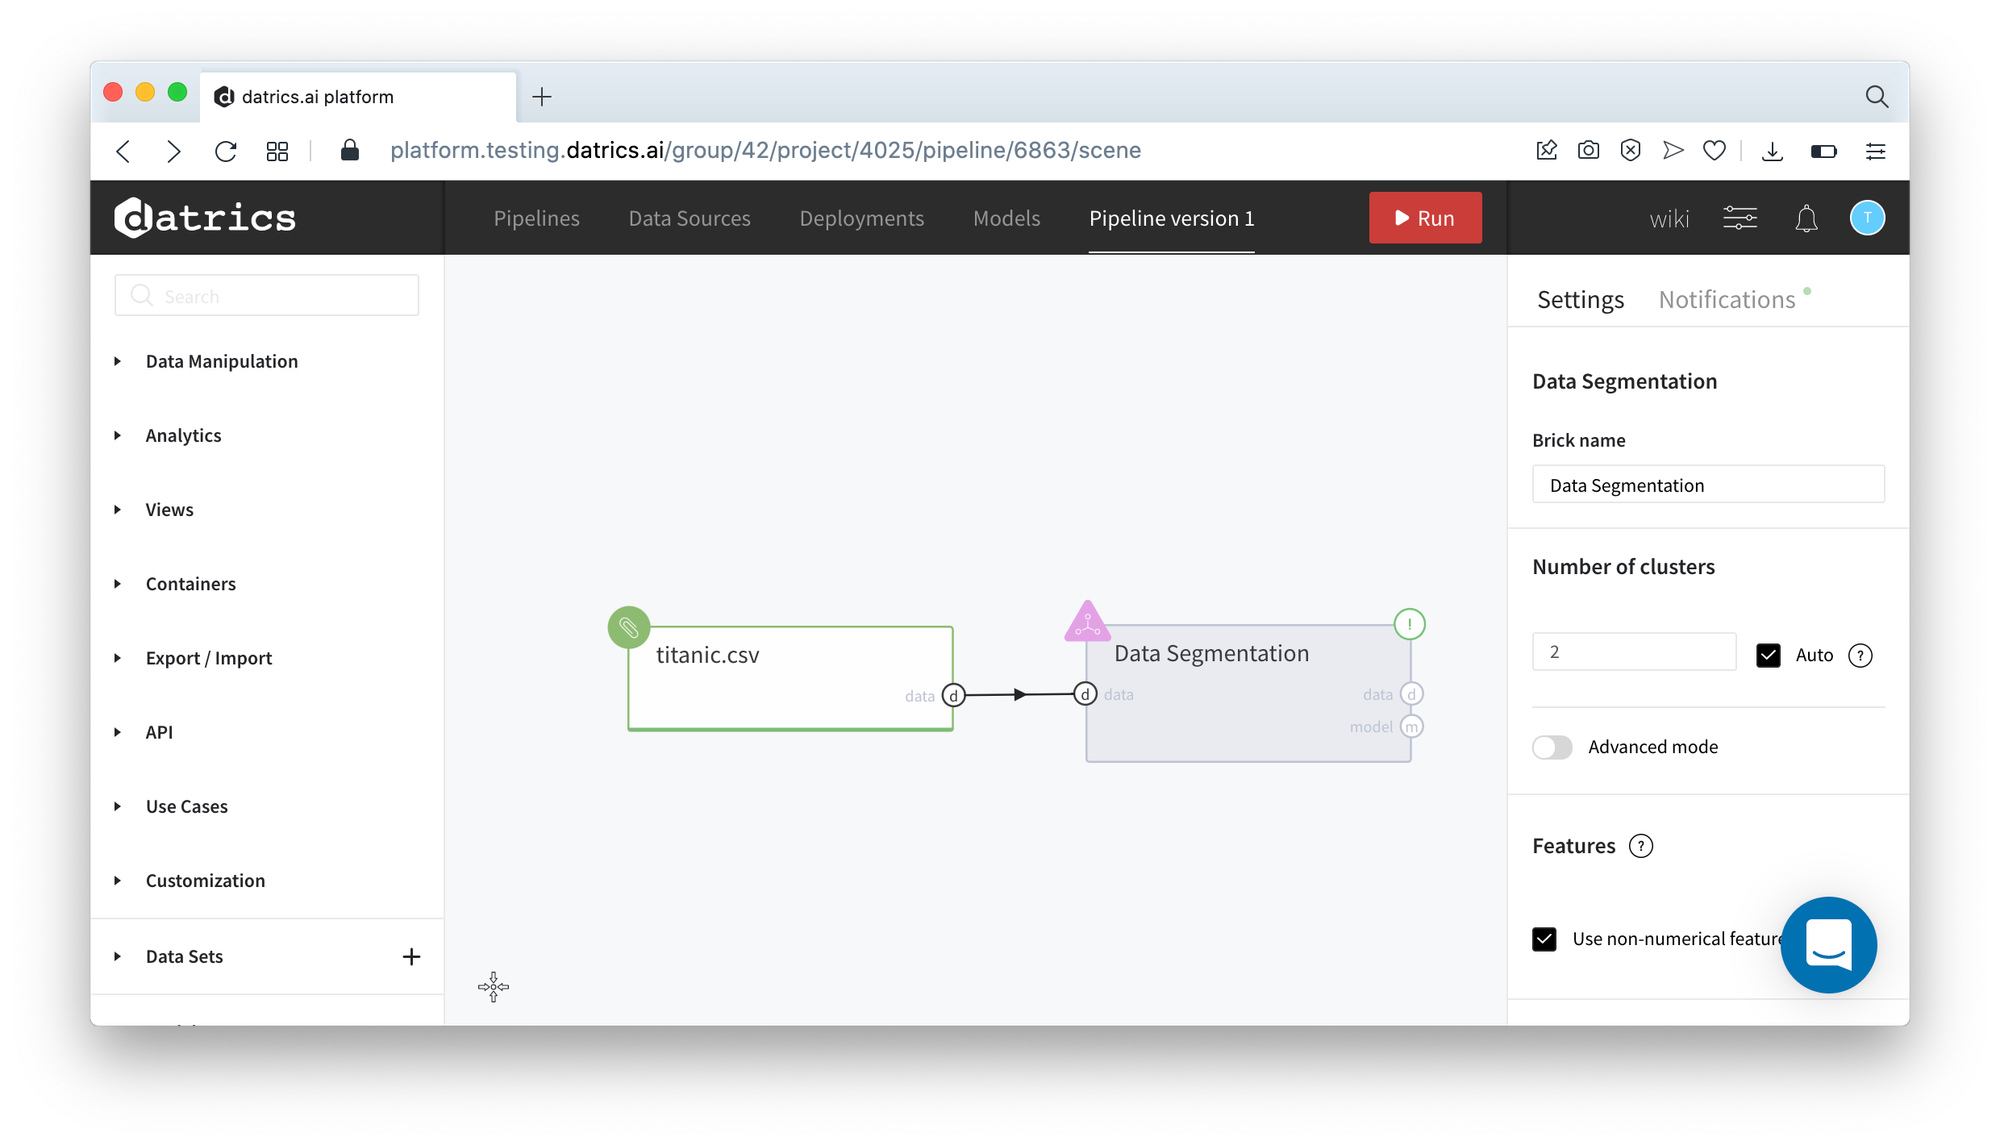
- First, drag'n'drop titanic.csv file from Storage→Samples folder, Data Segmentation brick from Bricks →Analytics/Data Mining / ML/Clustering
- Connect the data set to Data Segmentation brick, choose the "Auto" for the number of clusters, and set "Use not-numerical features" as True.
- Run pipeline
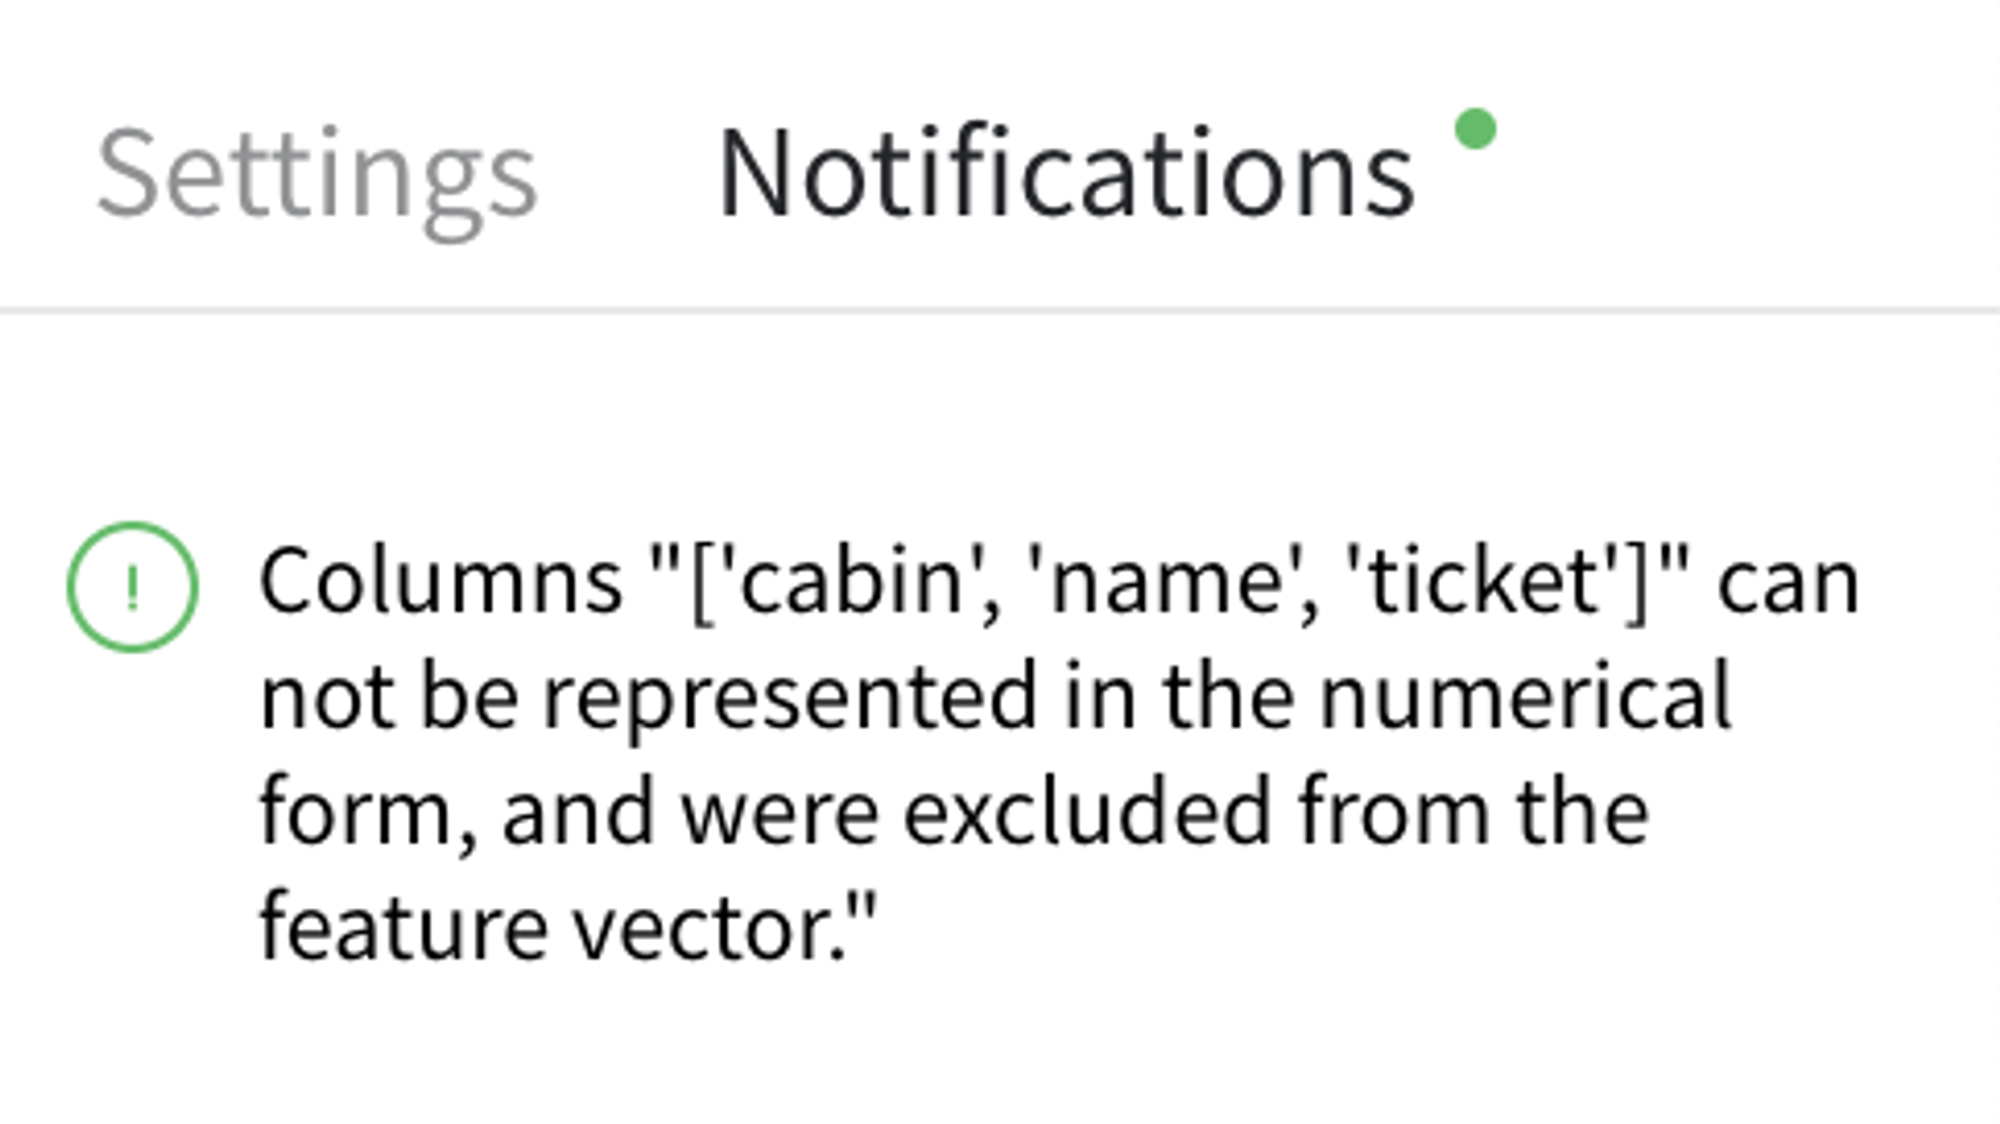
Some of the categorical columns from the input dataset can't be used as feature-vector components, so they were excluded from the features list, and the user got the corresponded notification.
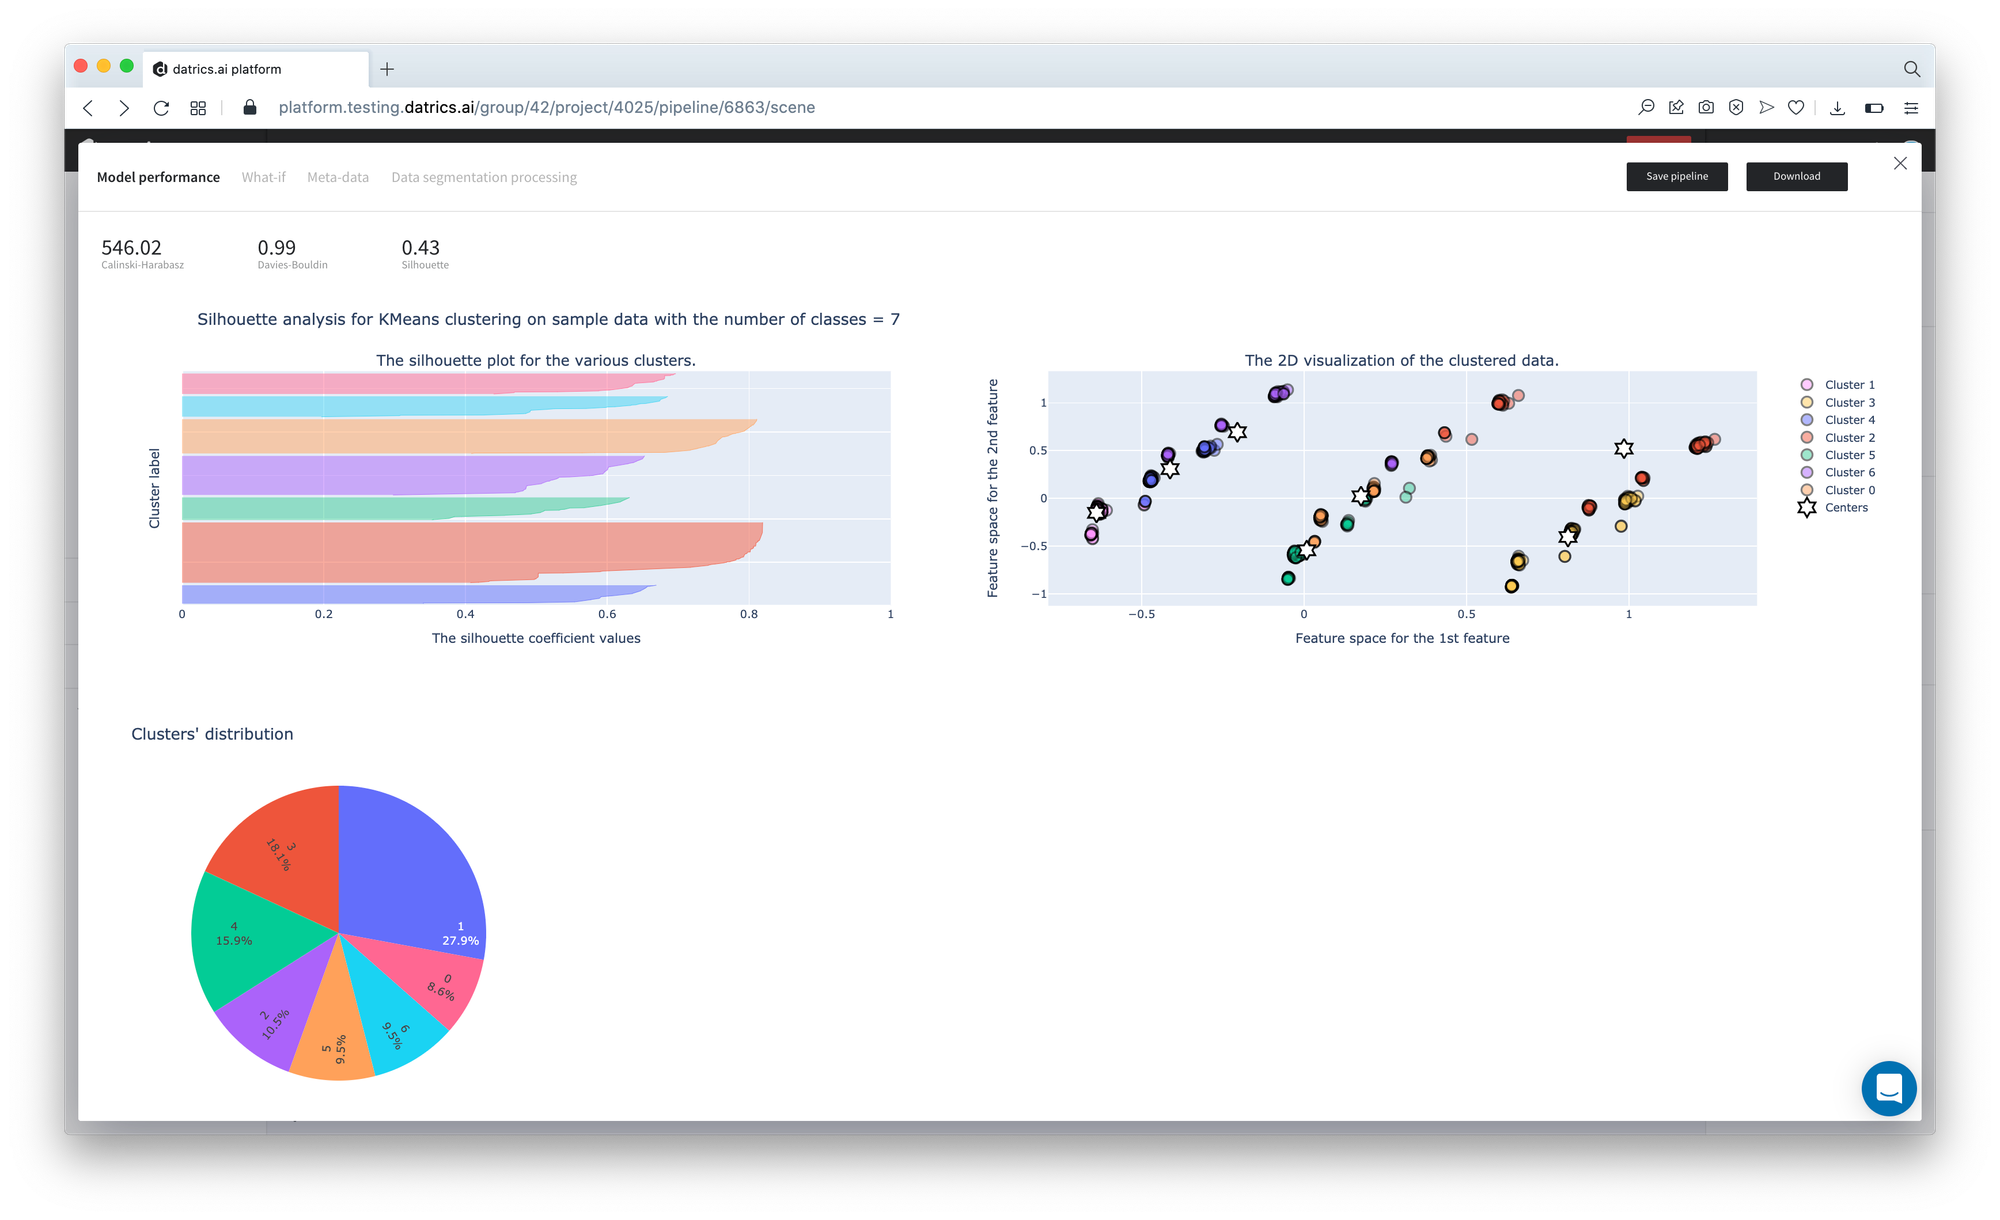
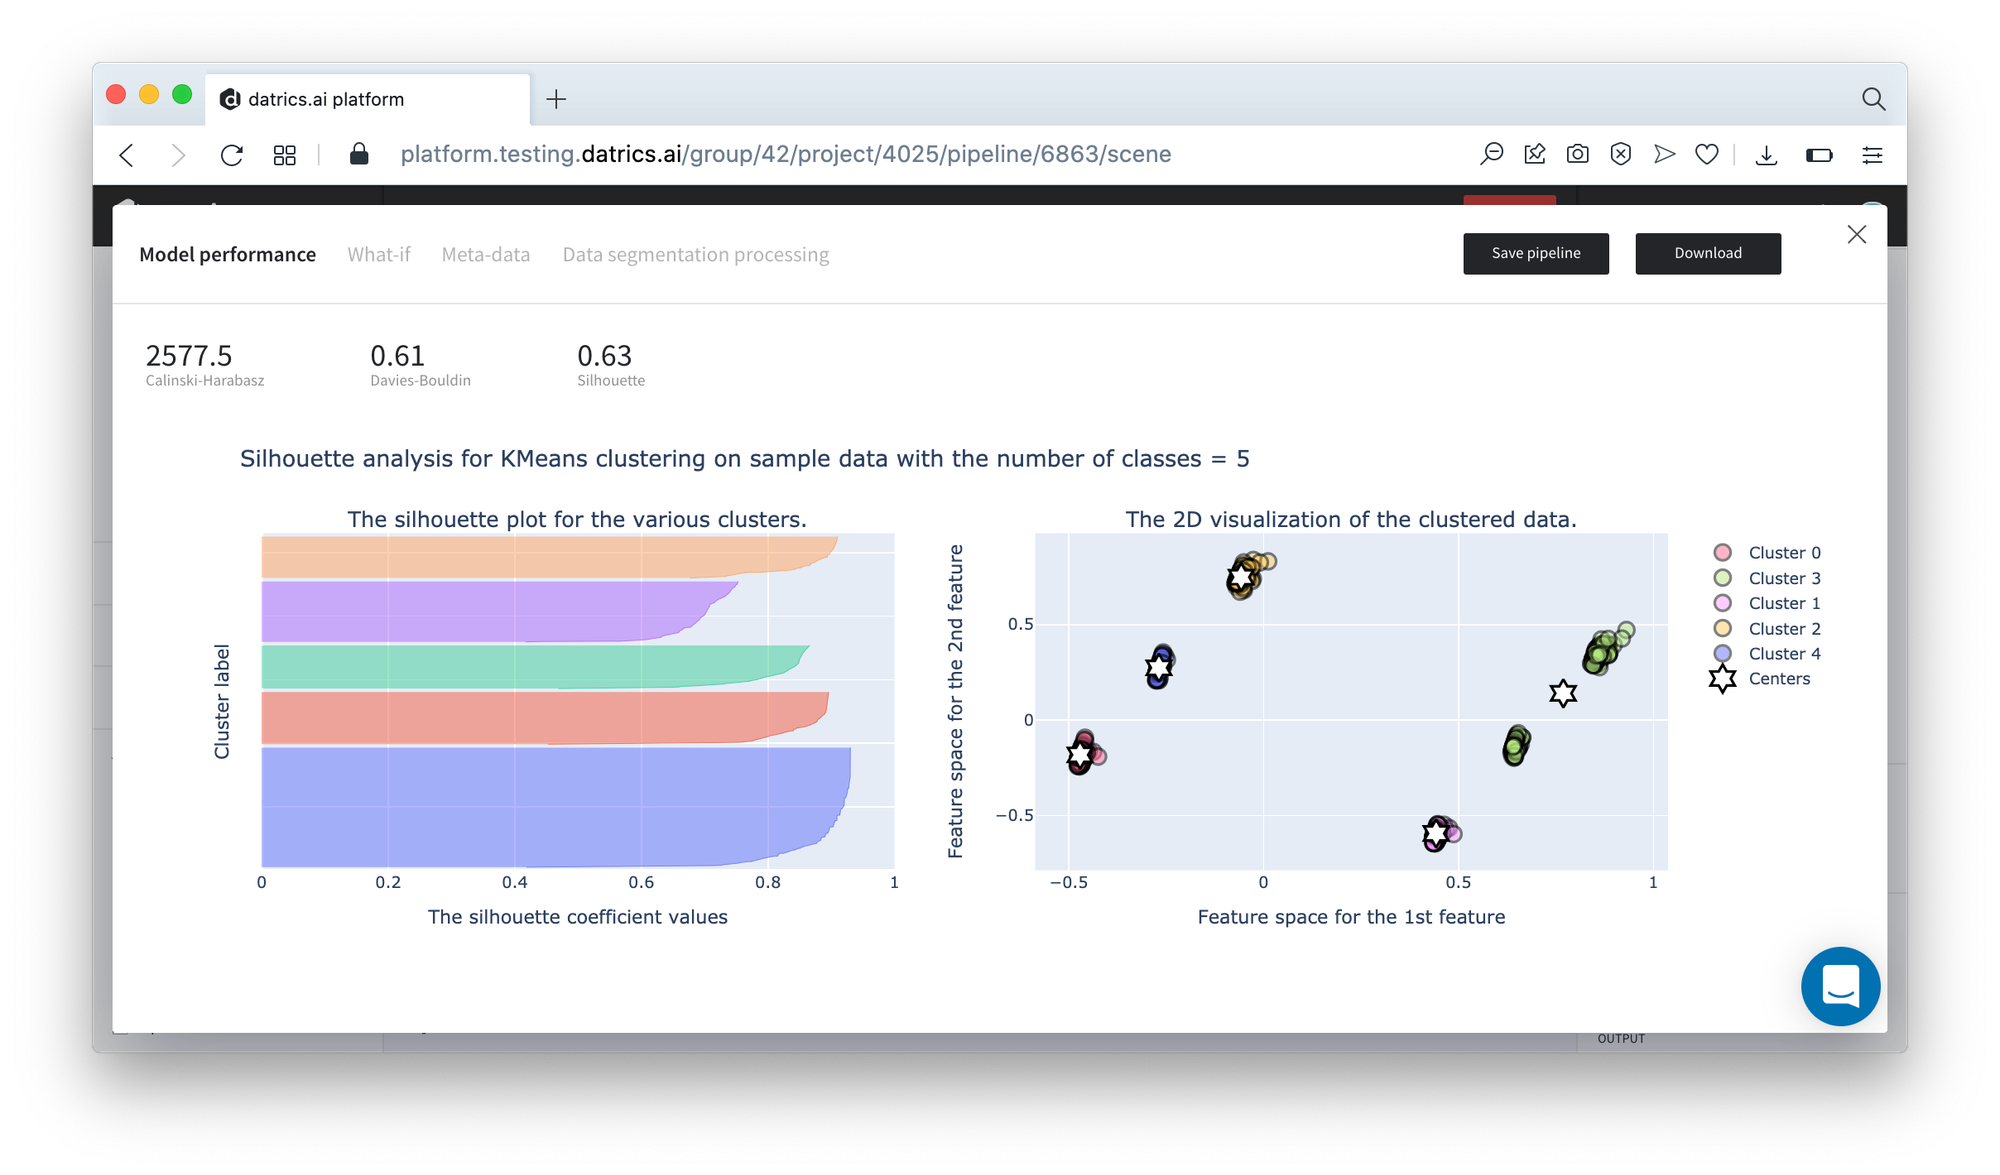
If we open the Model Info dashboard, we may see the results of the Data Segmentation pipeline, which is depicted as the quality metrics of the Clustering Model:
As we can see, the optimal number of clusters is 7. The best-distinguished cluster is cluster #1, while cluster #2 provides the lowest metrics.
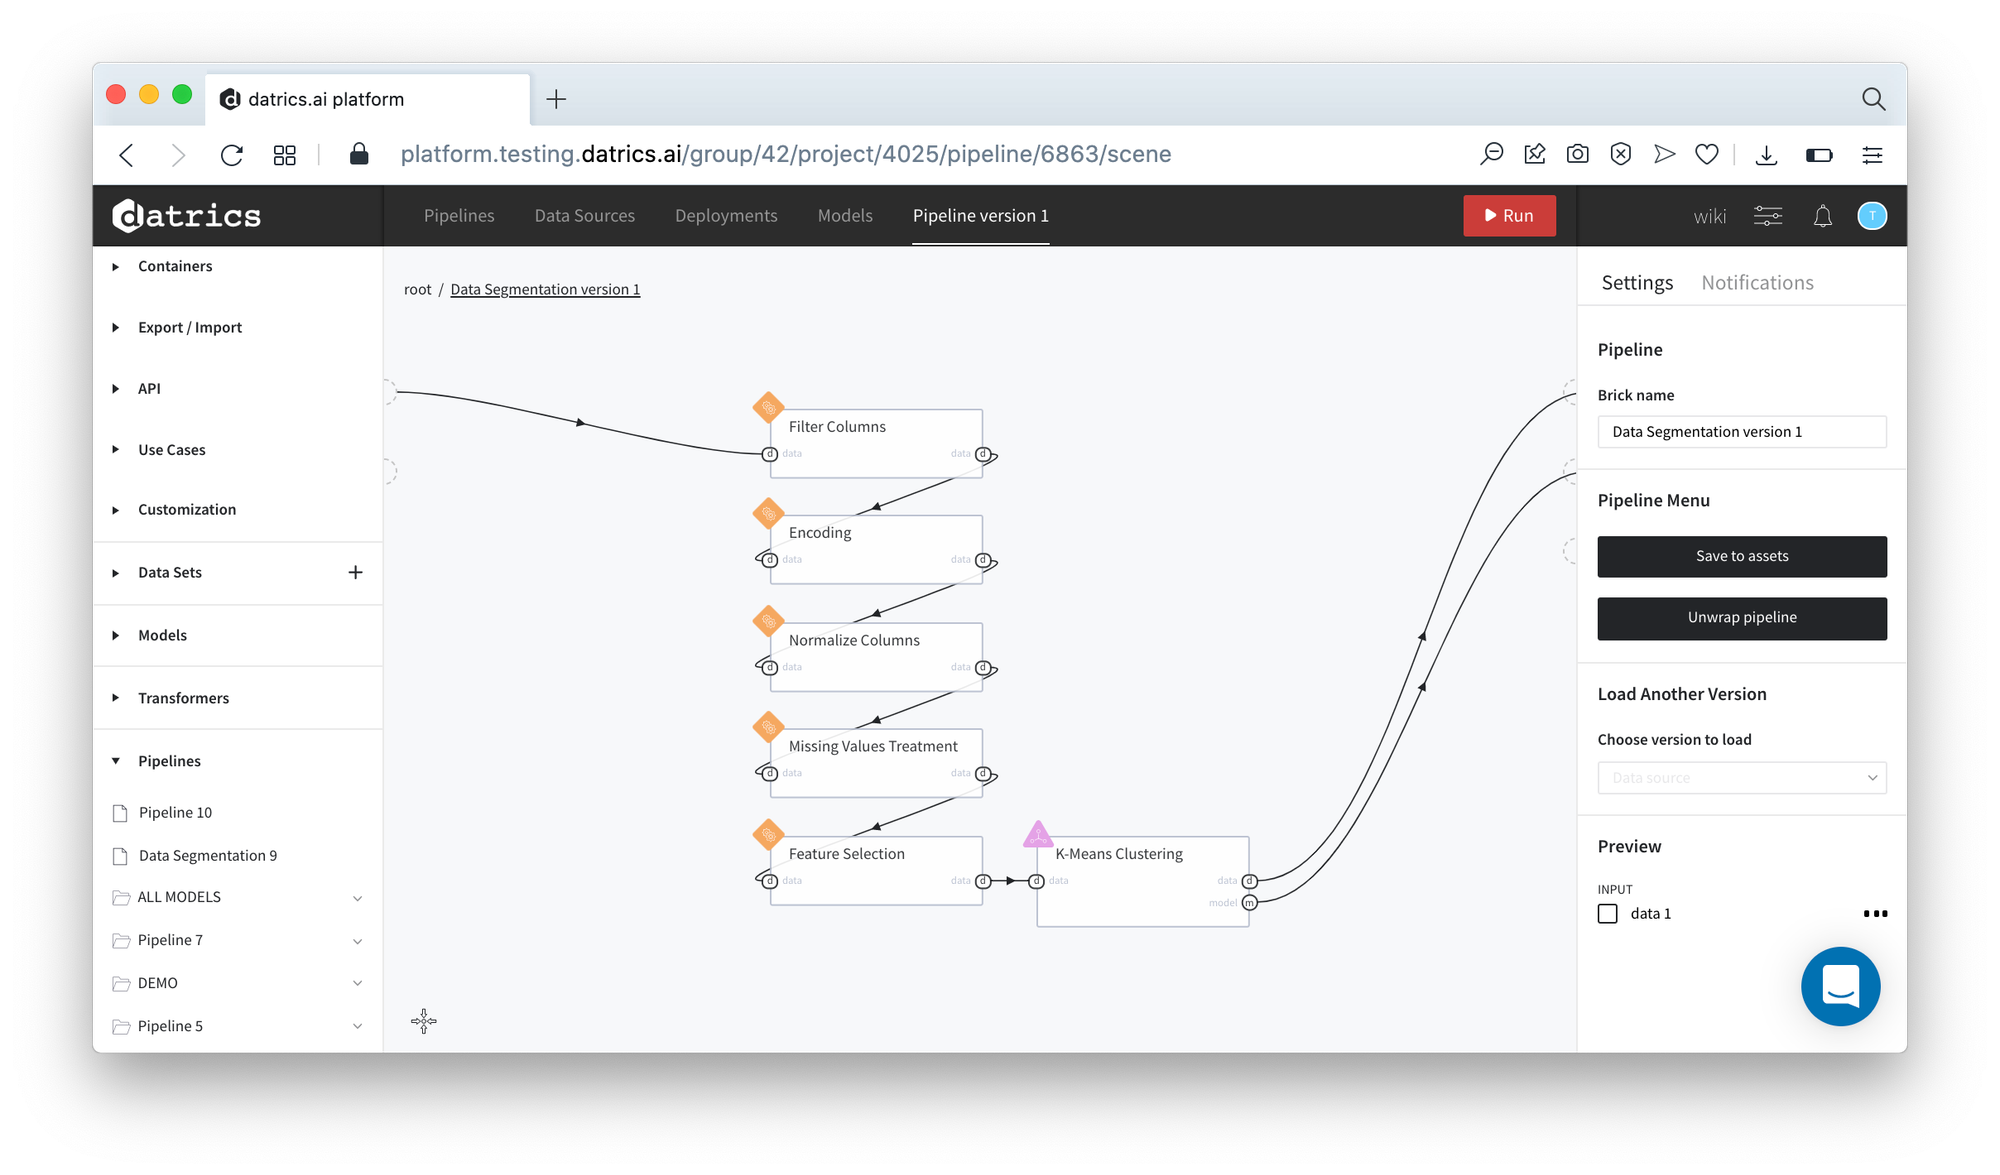
All steps of the Data Segmentation pipeline are showed on the Data Segmentation Processing tab:
Data Segmentation Processing
{
  "INPUT DATA": [
    "survived",
    "name",
    "pclass",
    "sex",
    "age",
    "sibsp",
    "parch",
    "ticket",
    "fare",
    "cabin",
    "embarked"
  ],
  "FILTER COLUMNS": [
    "survived",
    "pclass",
    "age",
    "sibsp",
    "parch",
    "fare",
    "embarked",
    "sex"
  ],
  "ENCODING": {
    "embarked": {
      "method": "One-Hot",
      "categories": [
        "C",
        "Q",
        "S",
        "nan"
      ]
    },
    "sex": {
      "method": "Binary",
      "categories": [
        "female",
        "male",
        "~~~unknown~~~"
      ]
    }
  },
  "NORMALIZATION": {
    "columns": [
      "survived",
      "pclass",
      "age",
      "sibsp",
      "parch",
      "fare",
      "embarked_C",
      "embarked_Q",
      "embarked_S",
      "embarked_nan",
      "sex"
    ],
    "max_values": {
      "survived": 1,
      "pclass": 3,
      "age": 80,
      "sibsp": 8,
      "parch": 9,
      "fare": 512.3292,
      "embarked_C": 1,
      "embarked_Q": 1,
      "embarked_S": 1,
      "embarked_nan": 1,
      "sex": 1
    },
    "min_values": {
      "survived": 0,
      "pclass": 1,
      "age": 0.1667,
      "sibsp": 0,
      "parch": 0,
      "fare": 0,
      "embarked_C": 0,
      "embarked_Q": 0,
      "embarked_S": 0,
      "embarked_nan": 0,
      "sex": 0
    }
  },
  "TREAT MISSING VALUES": {
    "age": {
      "treatment_type": "fill_with_function",
      "function": "mean",
      "value": 0.37220601569054895
    },
    "fare": {
      "treatment_type": "fill_with_function",
      "function": "mean",
      "value": 0.06498844743056917
    }
  },
  "FEATURE SELECTION": {
    "selected_features": [
      "survived",
      "pclass",
      "age",
      "sibsp",
      "parch",
      "fare",
      "embarked_C",
      "embarked_Q",
      "embarked_nan",
      "sex"
    ]
  },
  "K-MEANS": {
    "n_clusters": 7
  }
}
- INPUT DATA - the columns of thee input dataset
- FILTER COLUMNS - columns that are used for the data segmentation
- ENCODING - parameters of the categorical features encoding
- NORMALIZATION - parameters of min-max scaler
- TREAT MISSING VALUES - missing values treatment rules
- FEATURE SELECTION - the list of features to be passed to the model
The main results of the data preprocessing:
- The columns "name", "ticket", and "cabin" were excluded as non-informative. They relate to the categorical features, which do not match the one-hot encoding requirements.
- The categorical columns "embarked" and "sex" were transformed to the numerical view via one-hot and binary encoding correspondingly.
- All numerical columns were normalized via min-max scaling.
- The multicollinearity issue was fixed via VIF analysis
- The optimal number of clusters was detected and is equal to 7.
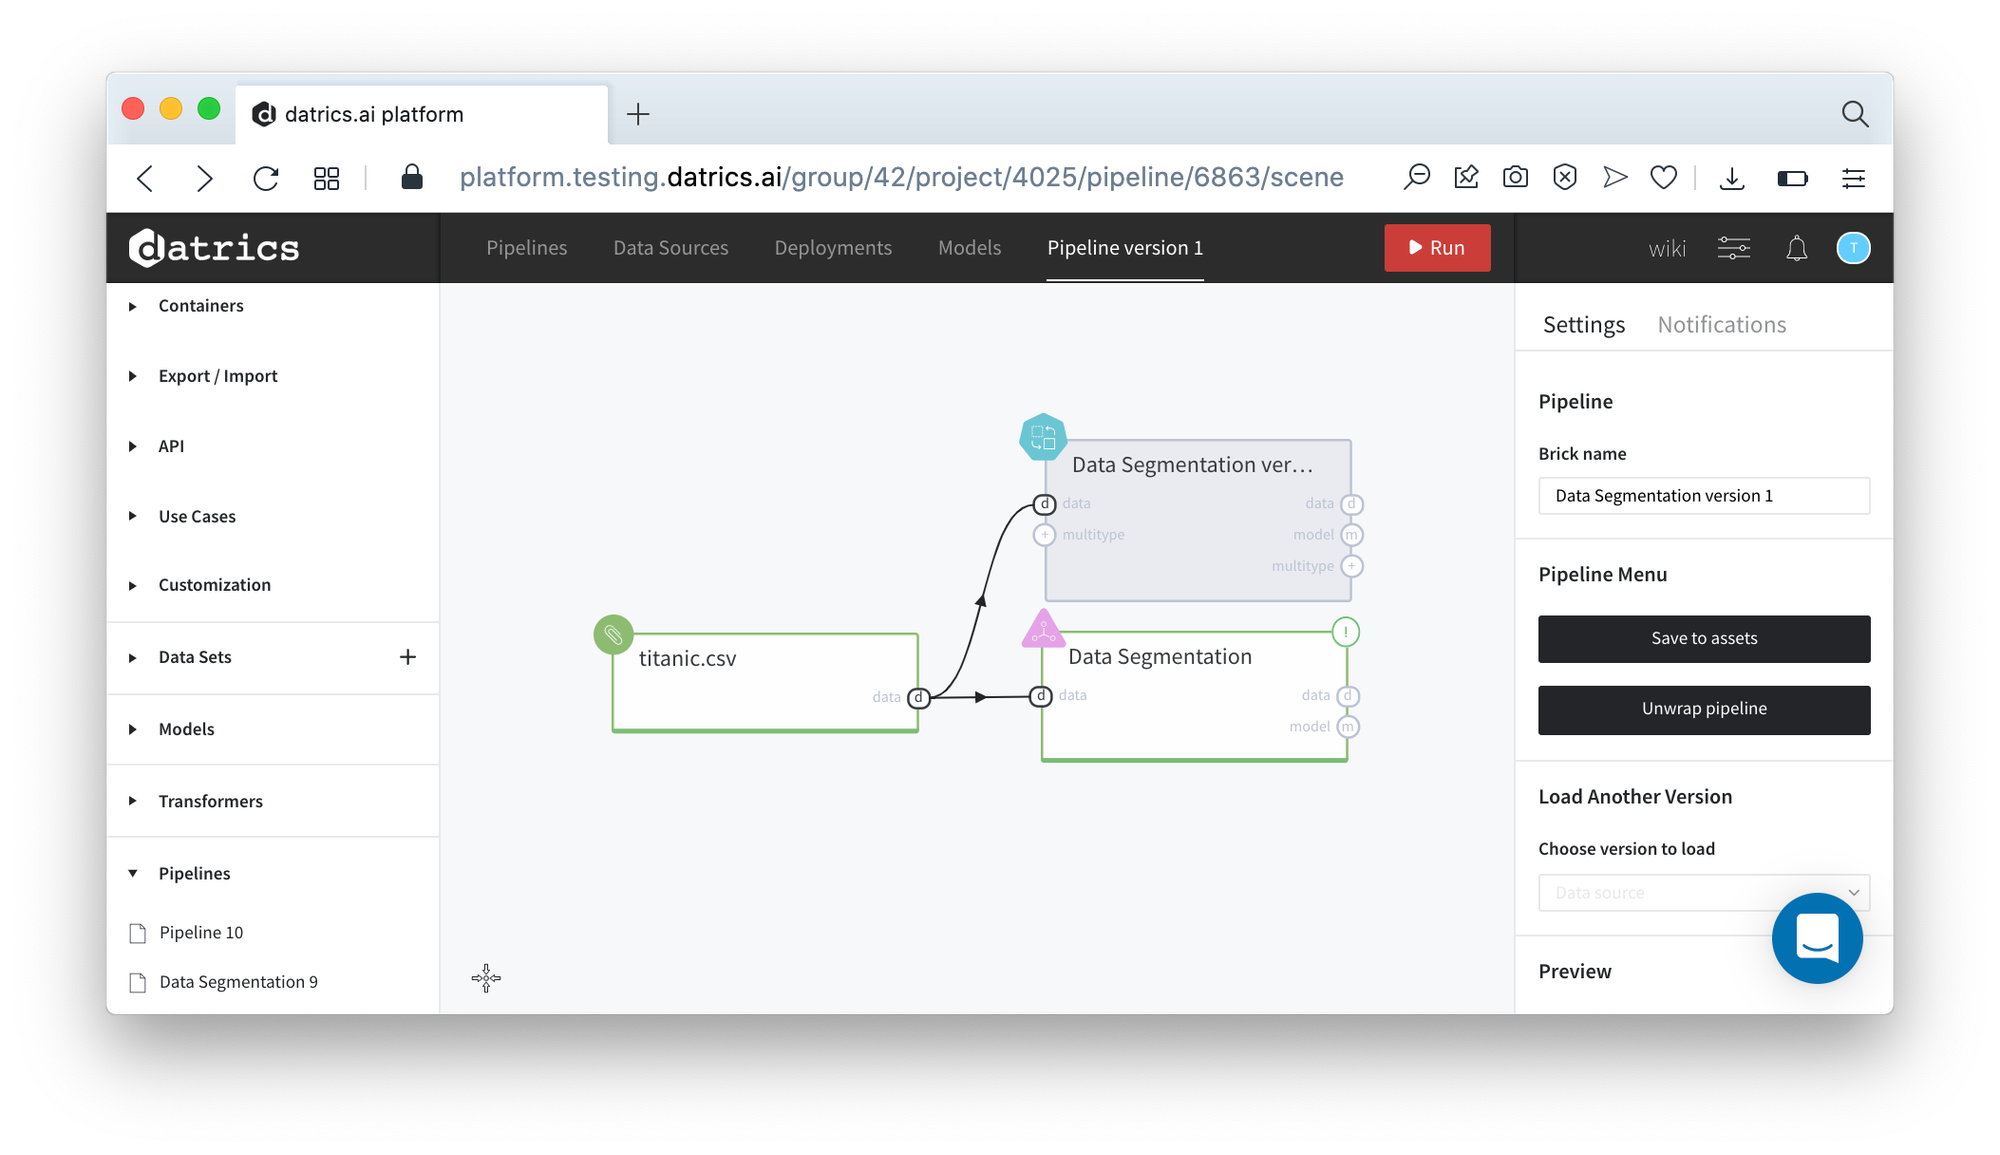
The results of the Data Segmentation can be saved as a pipeline with the configured and frozen bricks:
- Press Open View button to open the Data Segmentation dashboard
- Press Save Pipeline button and enter the pipeline name (Data Segmentation)
- Close dashboard and open Pipeline tab on the left sidebar - Data Segmentation pipeline is available for usage
- Drag-n-Drop the Data Segmentation pipeline brick to the canvas. Now you may pass the data to the new brick and perform the data segmentation step-by-step.
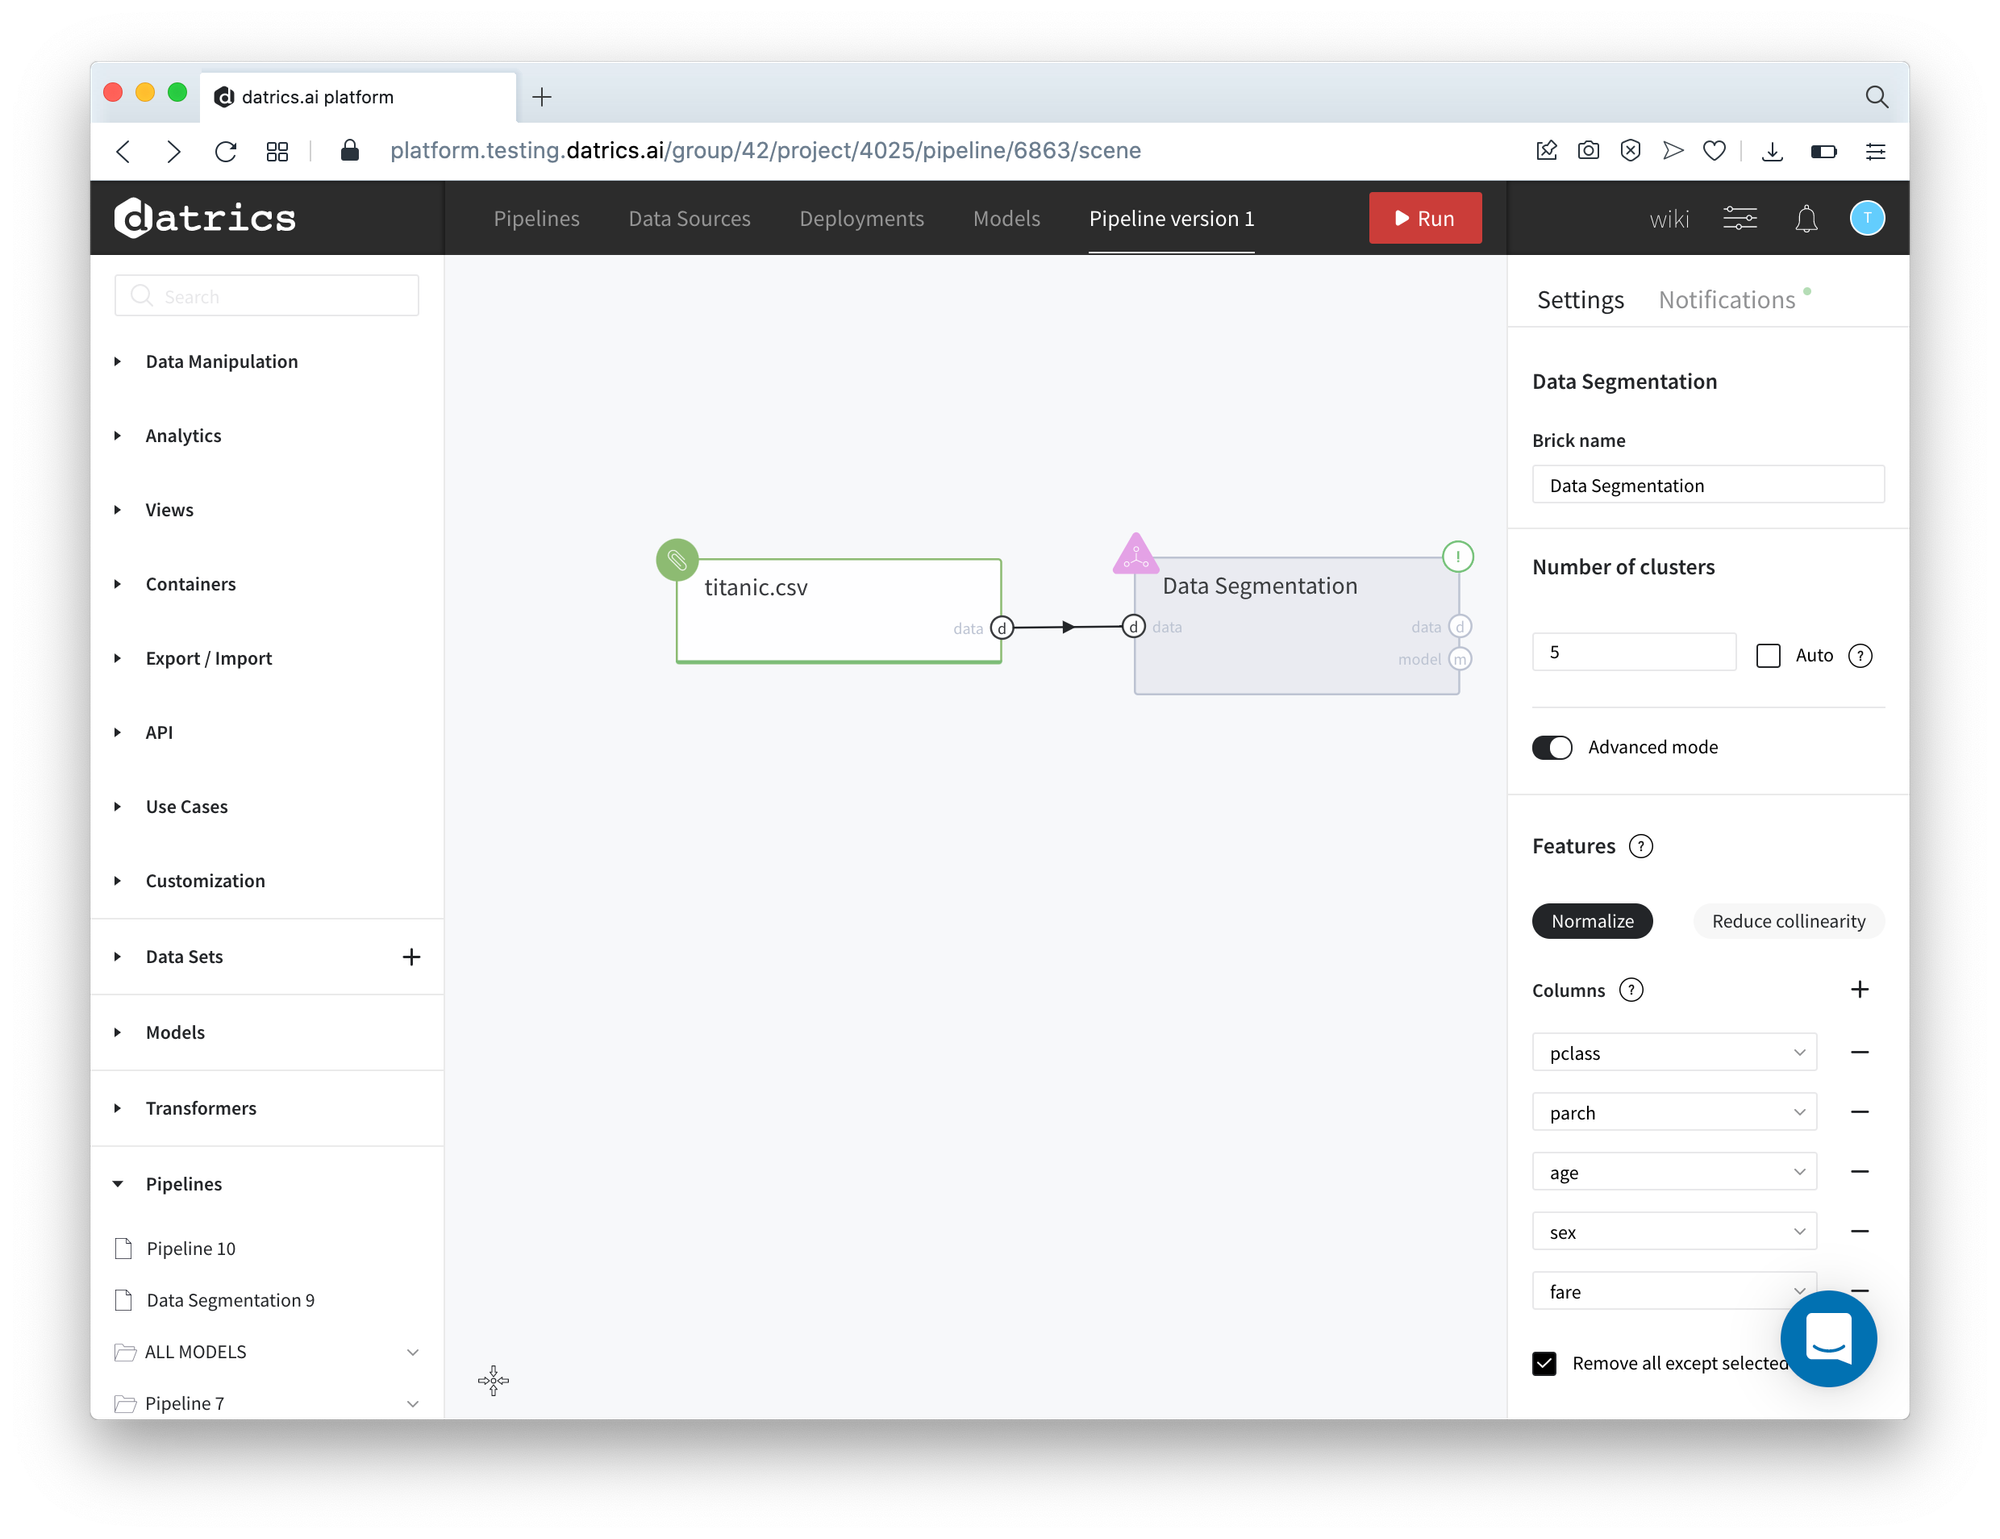
Executing advanced-mode pipeline
- Drag'n'drop titanic.csv file from Storage→Samples folder, Data Segmentation brick from Bricks →Analytics/Data Mining / ML/Clustering
- Connect the data set to Data Segmentation brick, switch to Advanced Mode
- Configure the brick:
- Number of Clusters - 5
- Columns: class, parch, age, sex, fare
- Normalize - True
- Reduce Collinearity - False
Data Segmentation metrics are represented below:
Data Segmentation pipeline contains another set of bricks - Feature selection was not included in the pipeline.
The results of the Data Segmentation pipeline running is depicted on the picture below:
It's not difficult to see that the results are equal to the brick execution.