Description
The following pipeline demonstrates Datrics' abilities to predict demand on the store level, based on the analysis of historical sales. The proposed pipeline performs data preparation, training and evaluation of multiple forecasting models, and prediction on the custom dataset.
Problem Statement
Based on the historical sales data, predict the demand level for a specific store.
Dataset
Modeling Scenario
General Schema of the Store Sales Prediction can be depicted as a sequence:
- Load the initial dataset and validate the existing variables
- Extract features that may be relevant for model training
- Split initial data into train\test sets
- Train the forecasting models using the train set
- Evaluate built models on the test set
- Generate predictions for the given stores for the period that is not presented in the initial dataset using the model with the best performance
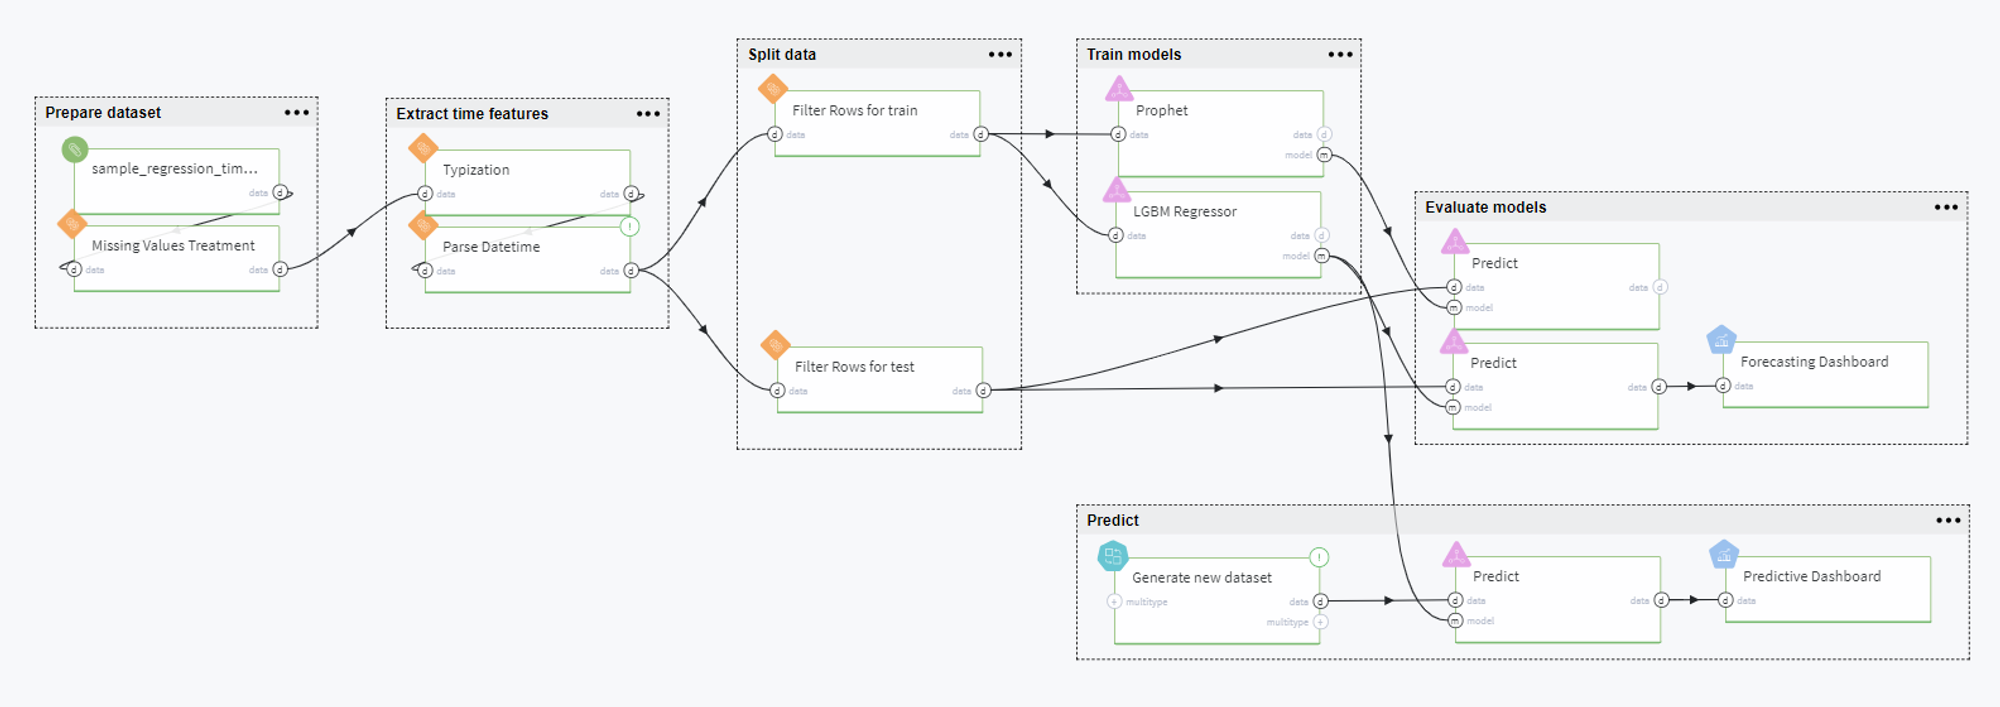
Datrics Pipeline
Pipeline Schema
The full pipeline is presented in the following way:
Pipeline Scenario
Overall, the pipeline can be comprised of the following steps: prepare dataset, extract time features, split data, train models, evaluate models and predict. Let us consider every step in detail below.
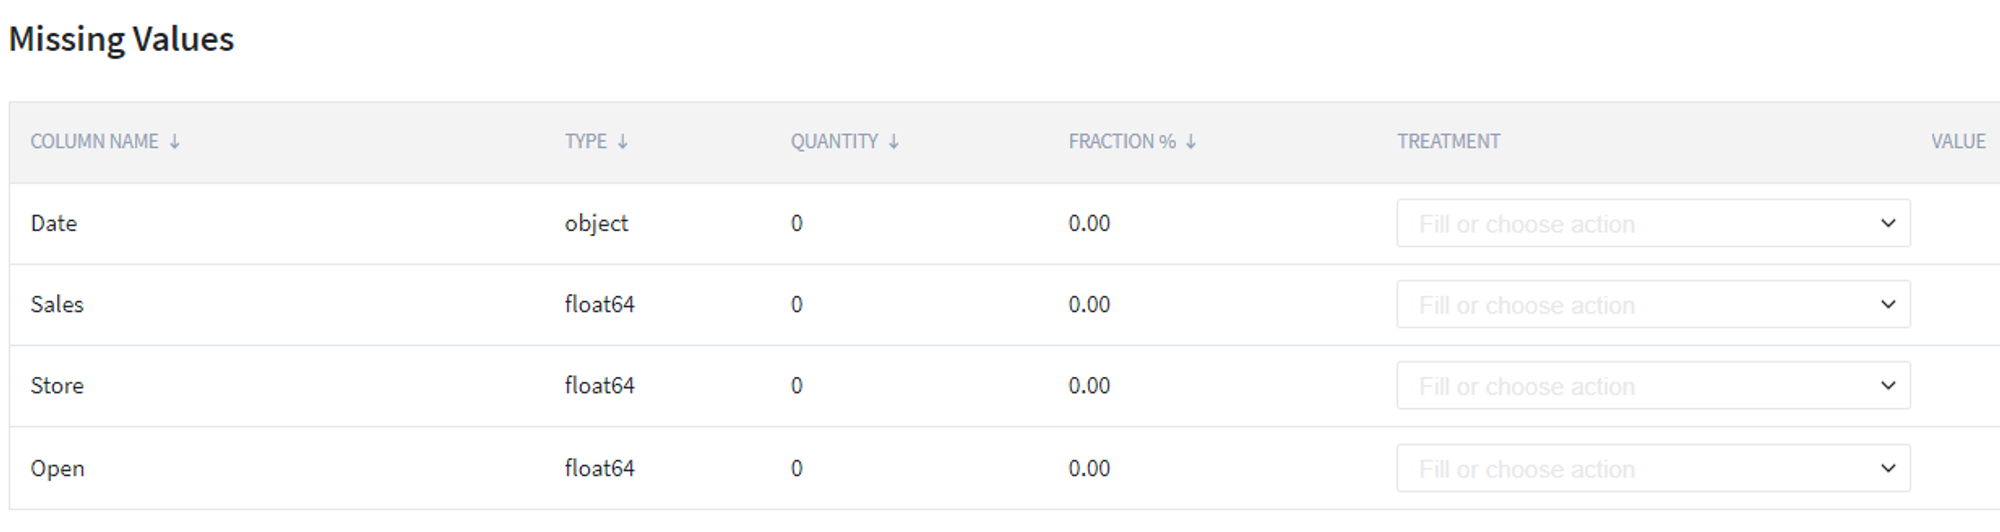
Prepare dataset
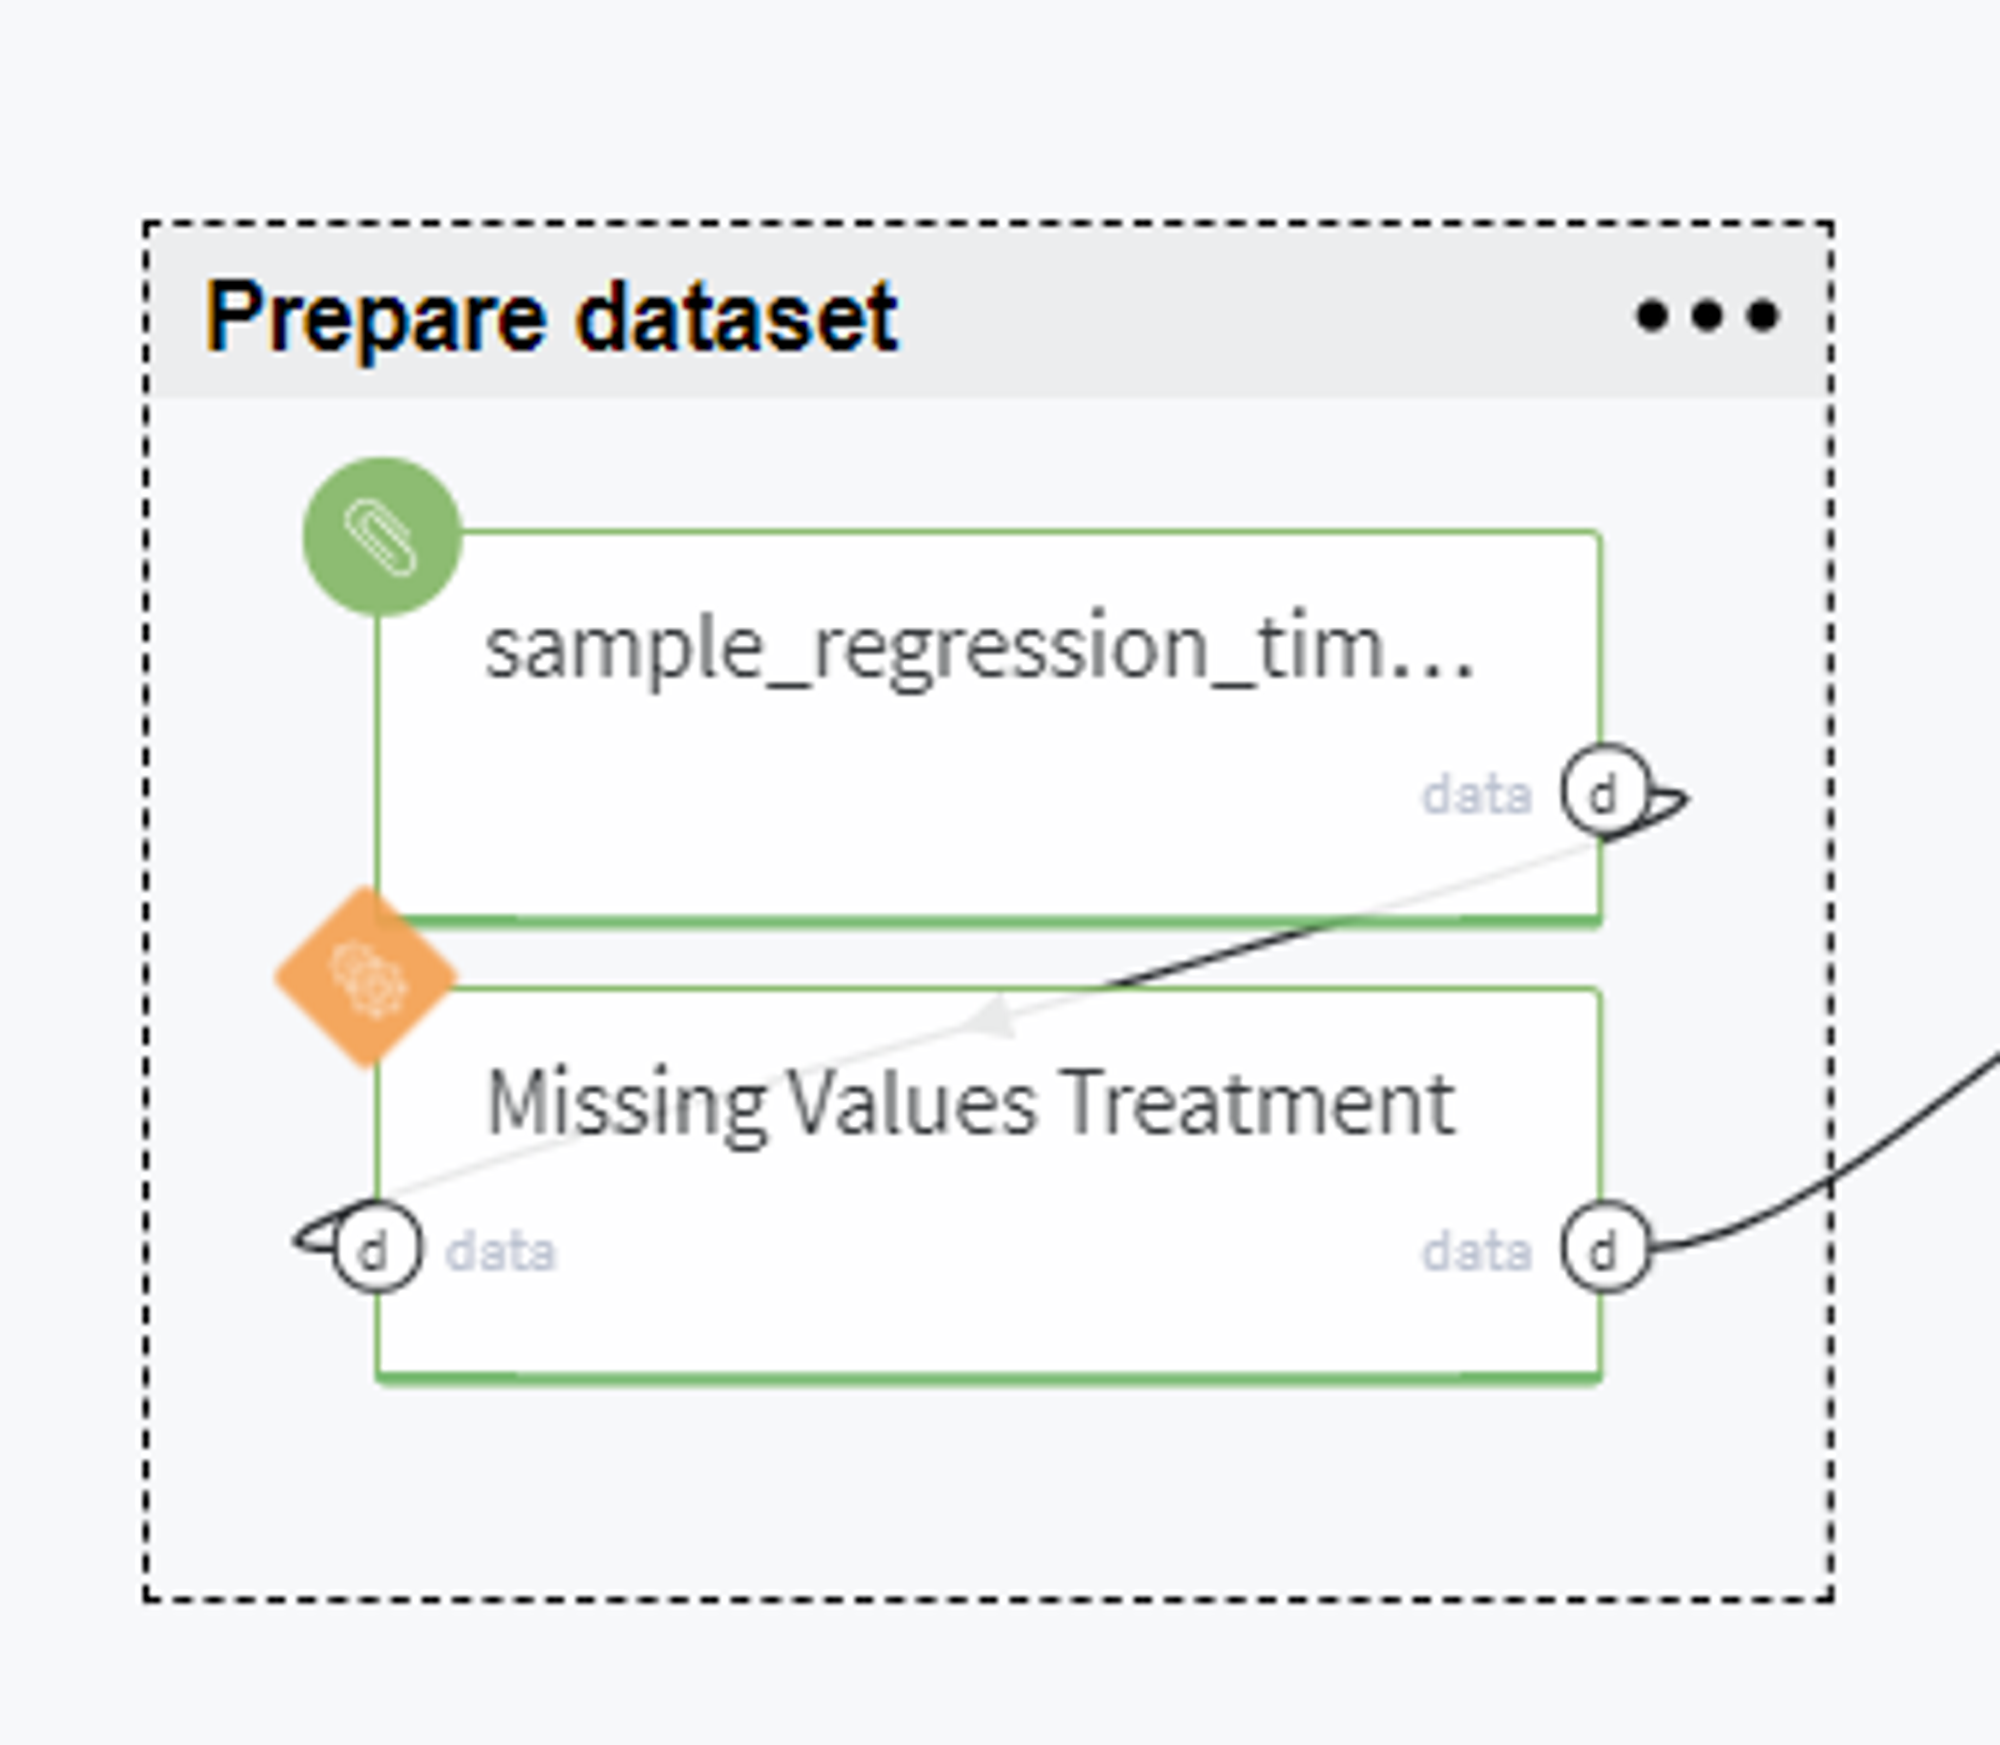
BRICKS:
Missing Values TreatmentFirstly, we upload the data from Storage → Samples → sample_regression_time_series_rossmann.csv and verify that it does not contain missing values.
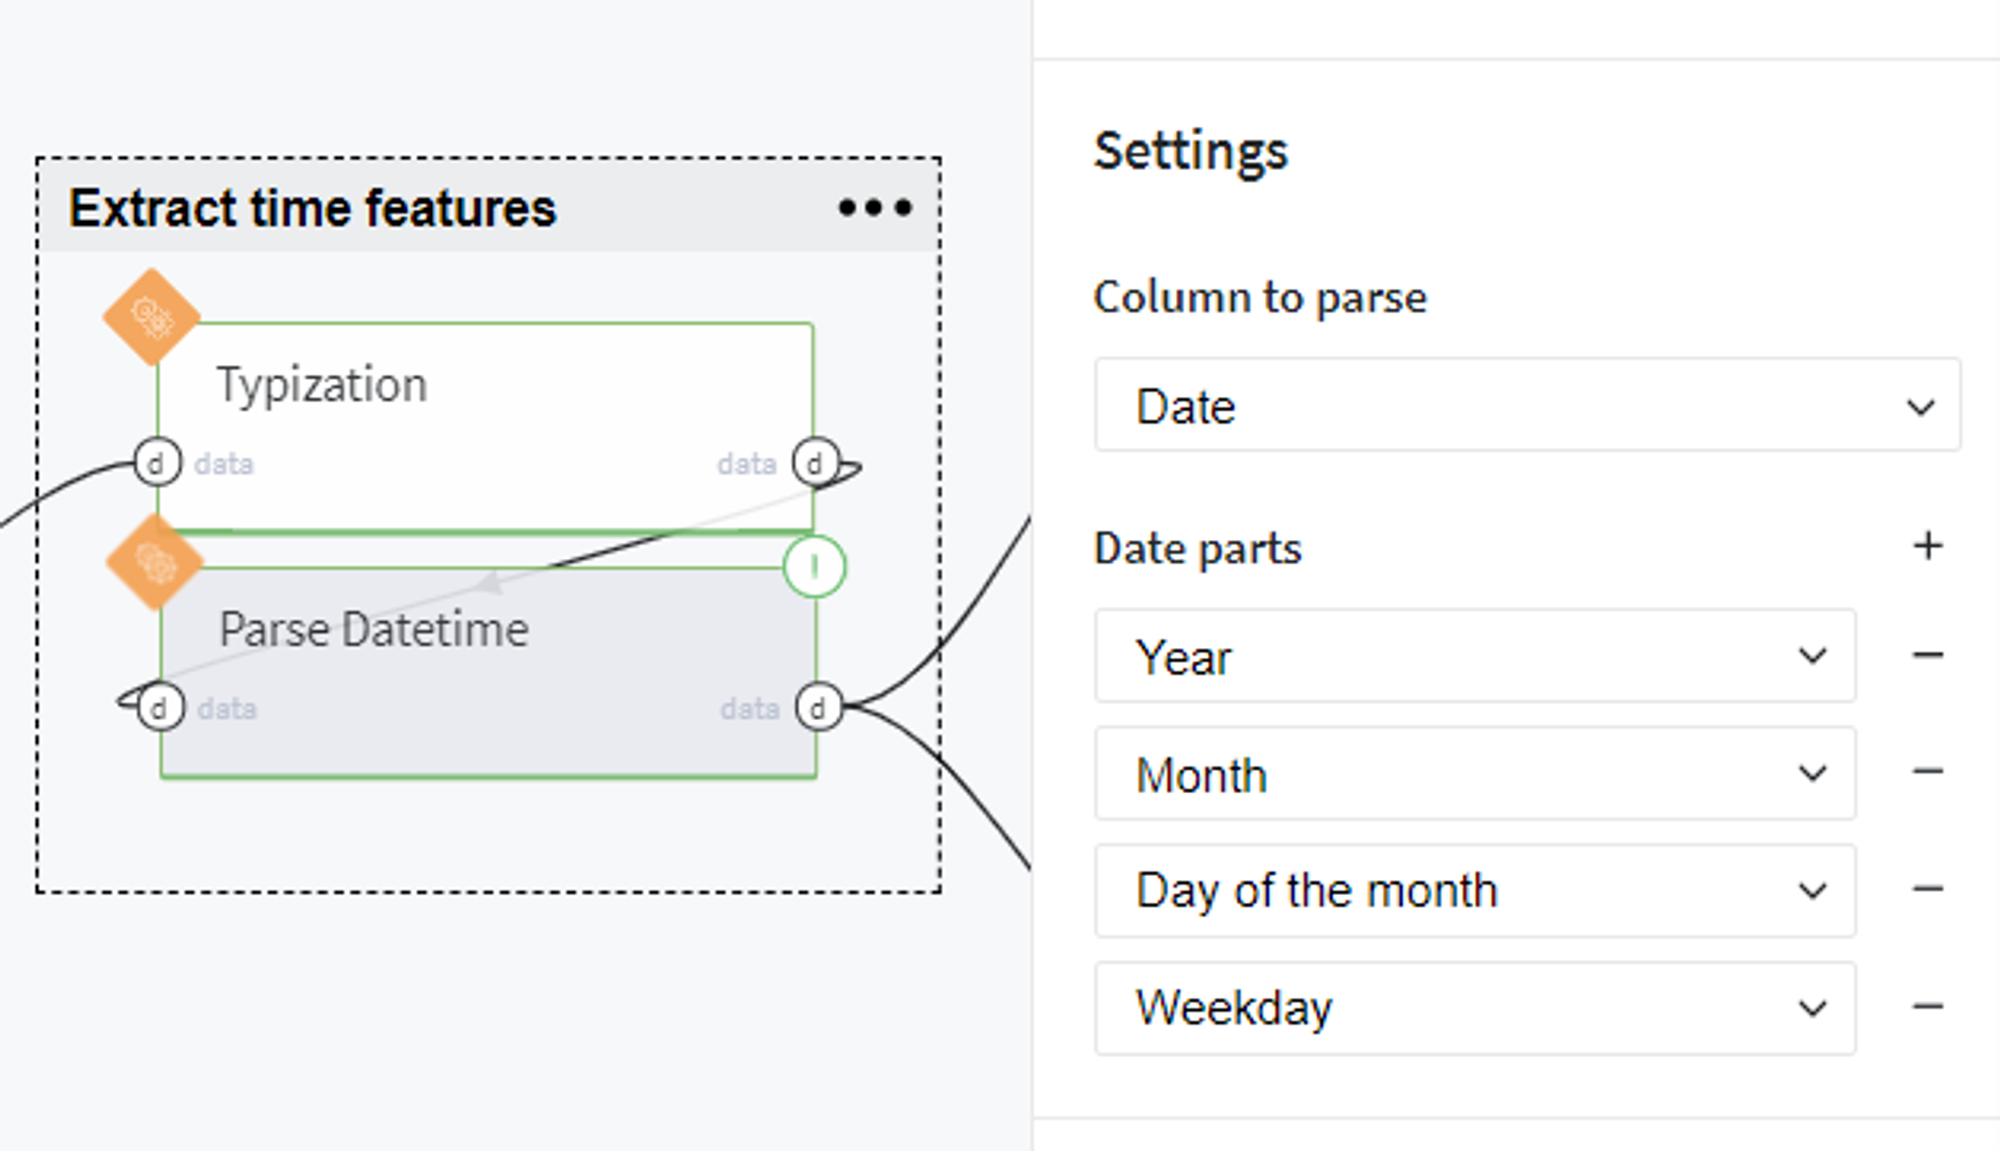
Extract time features
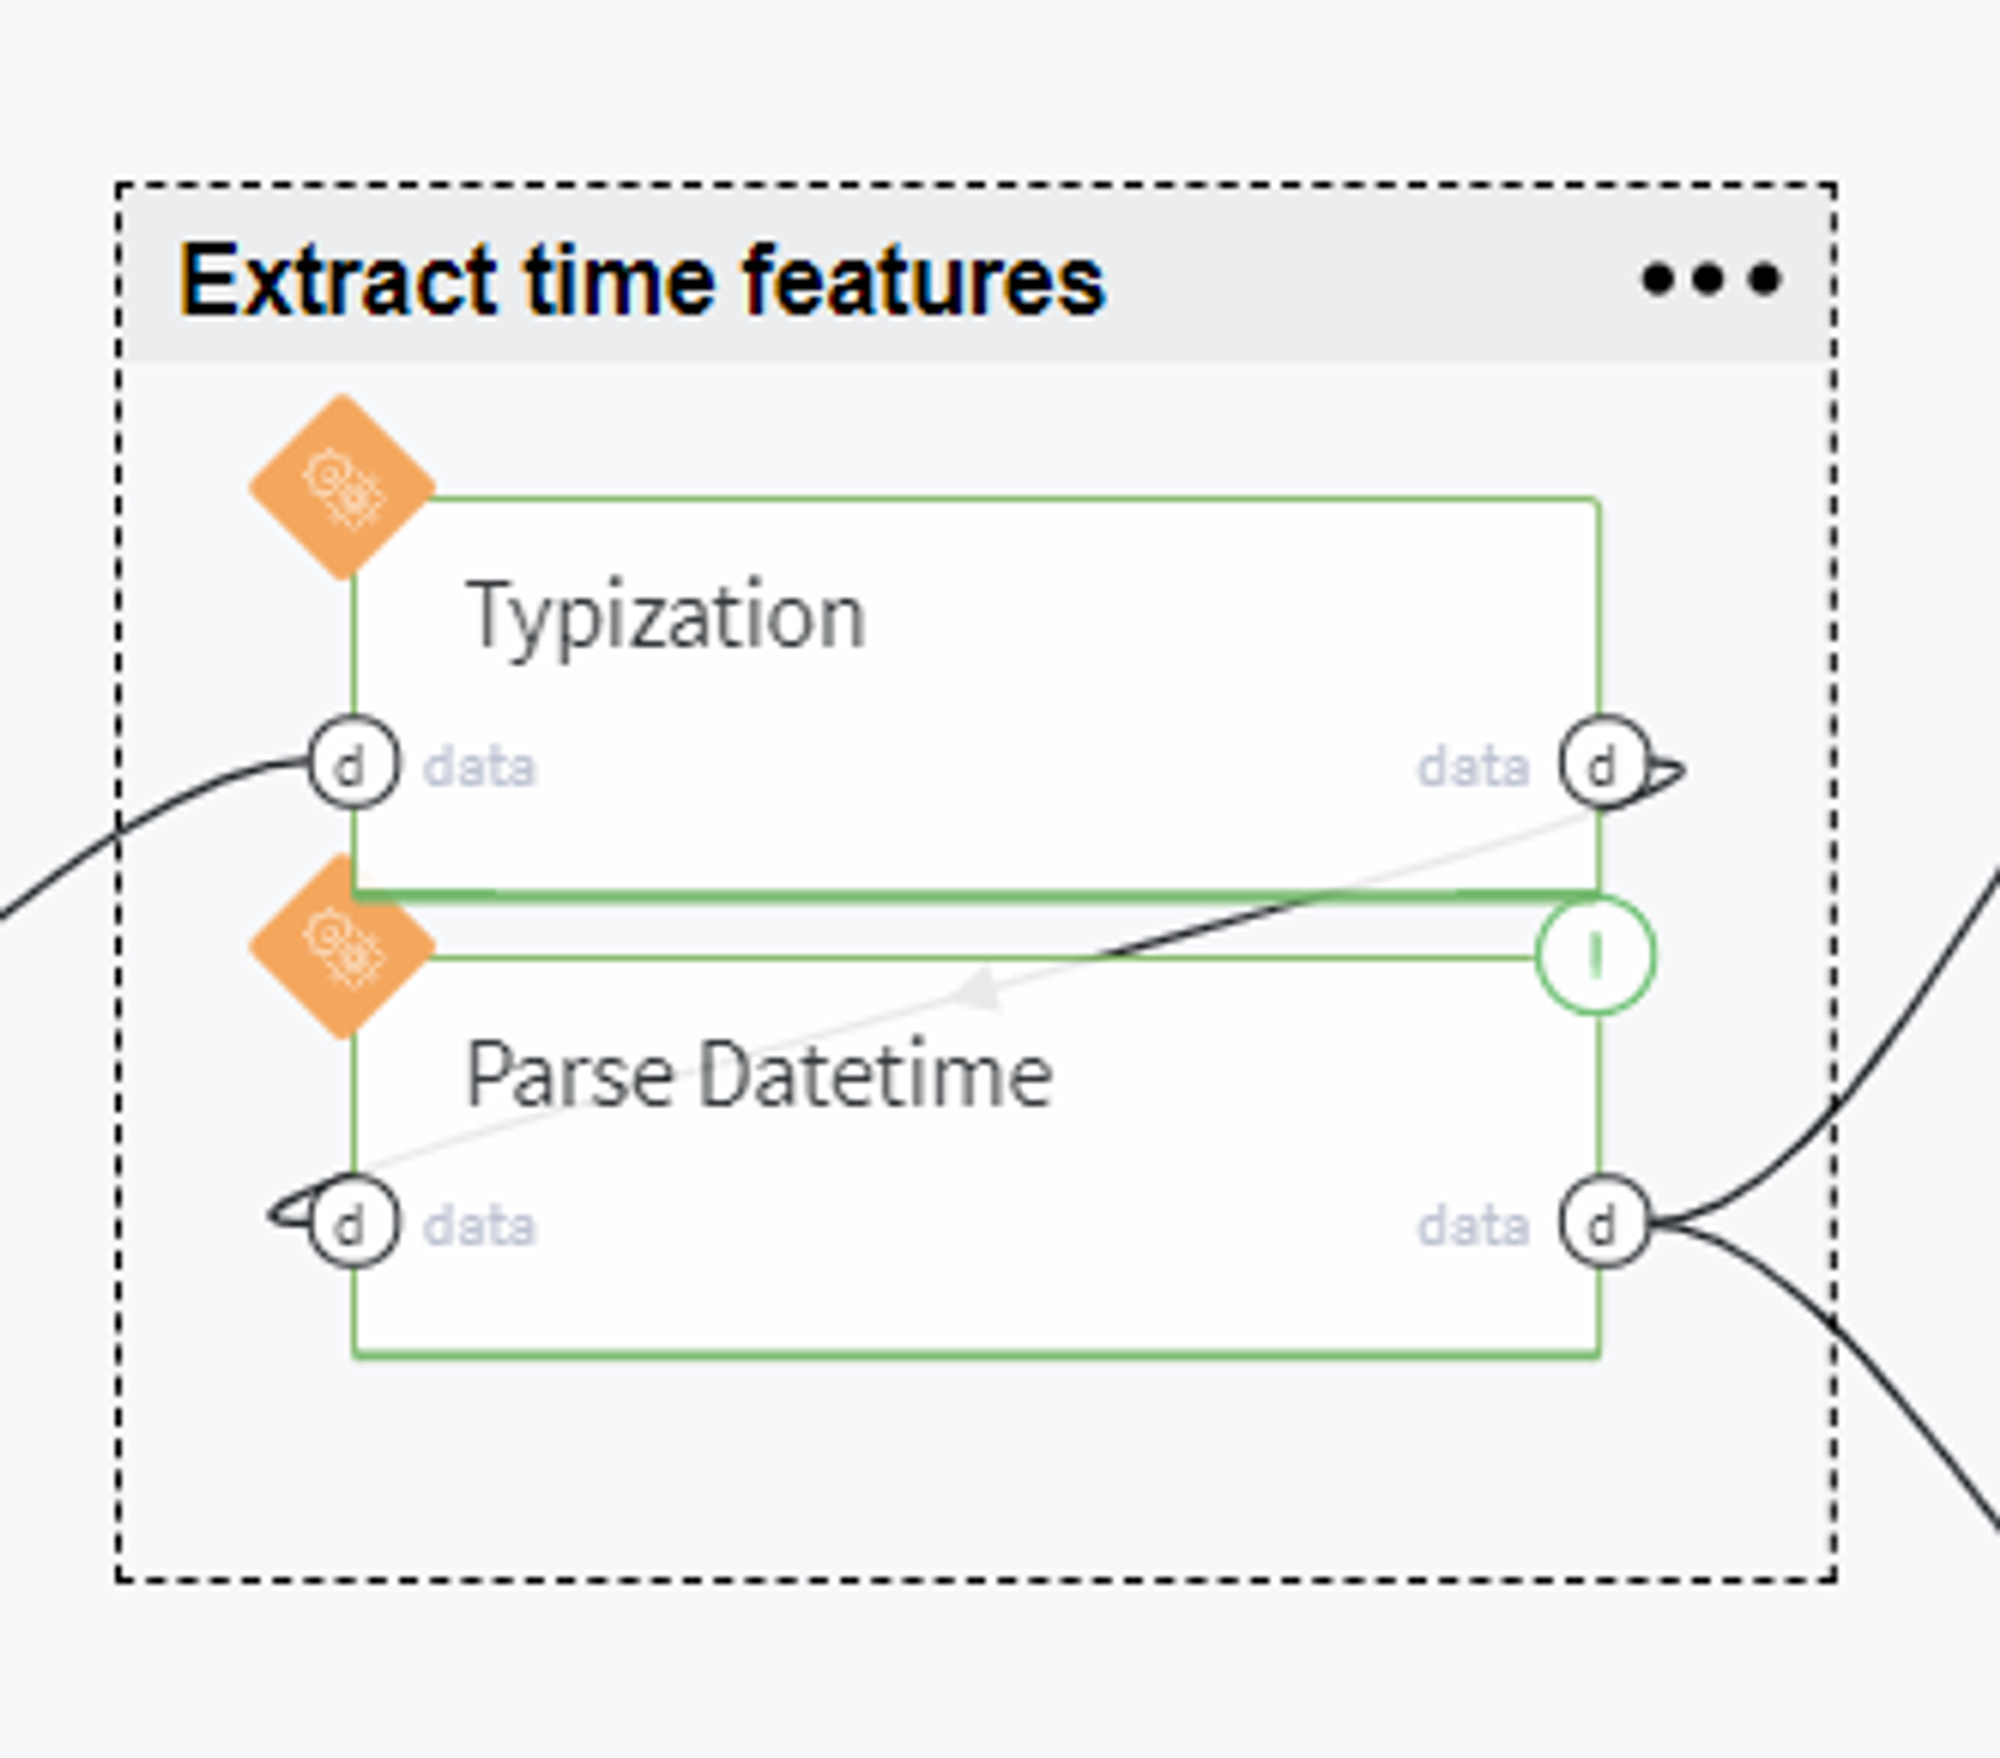
In order to use the date features for sales prediction, we transform the Date column to DateTime type:
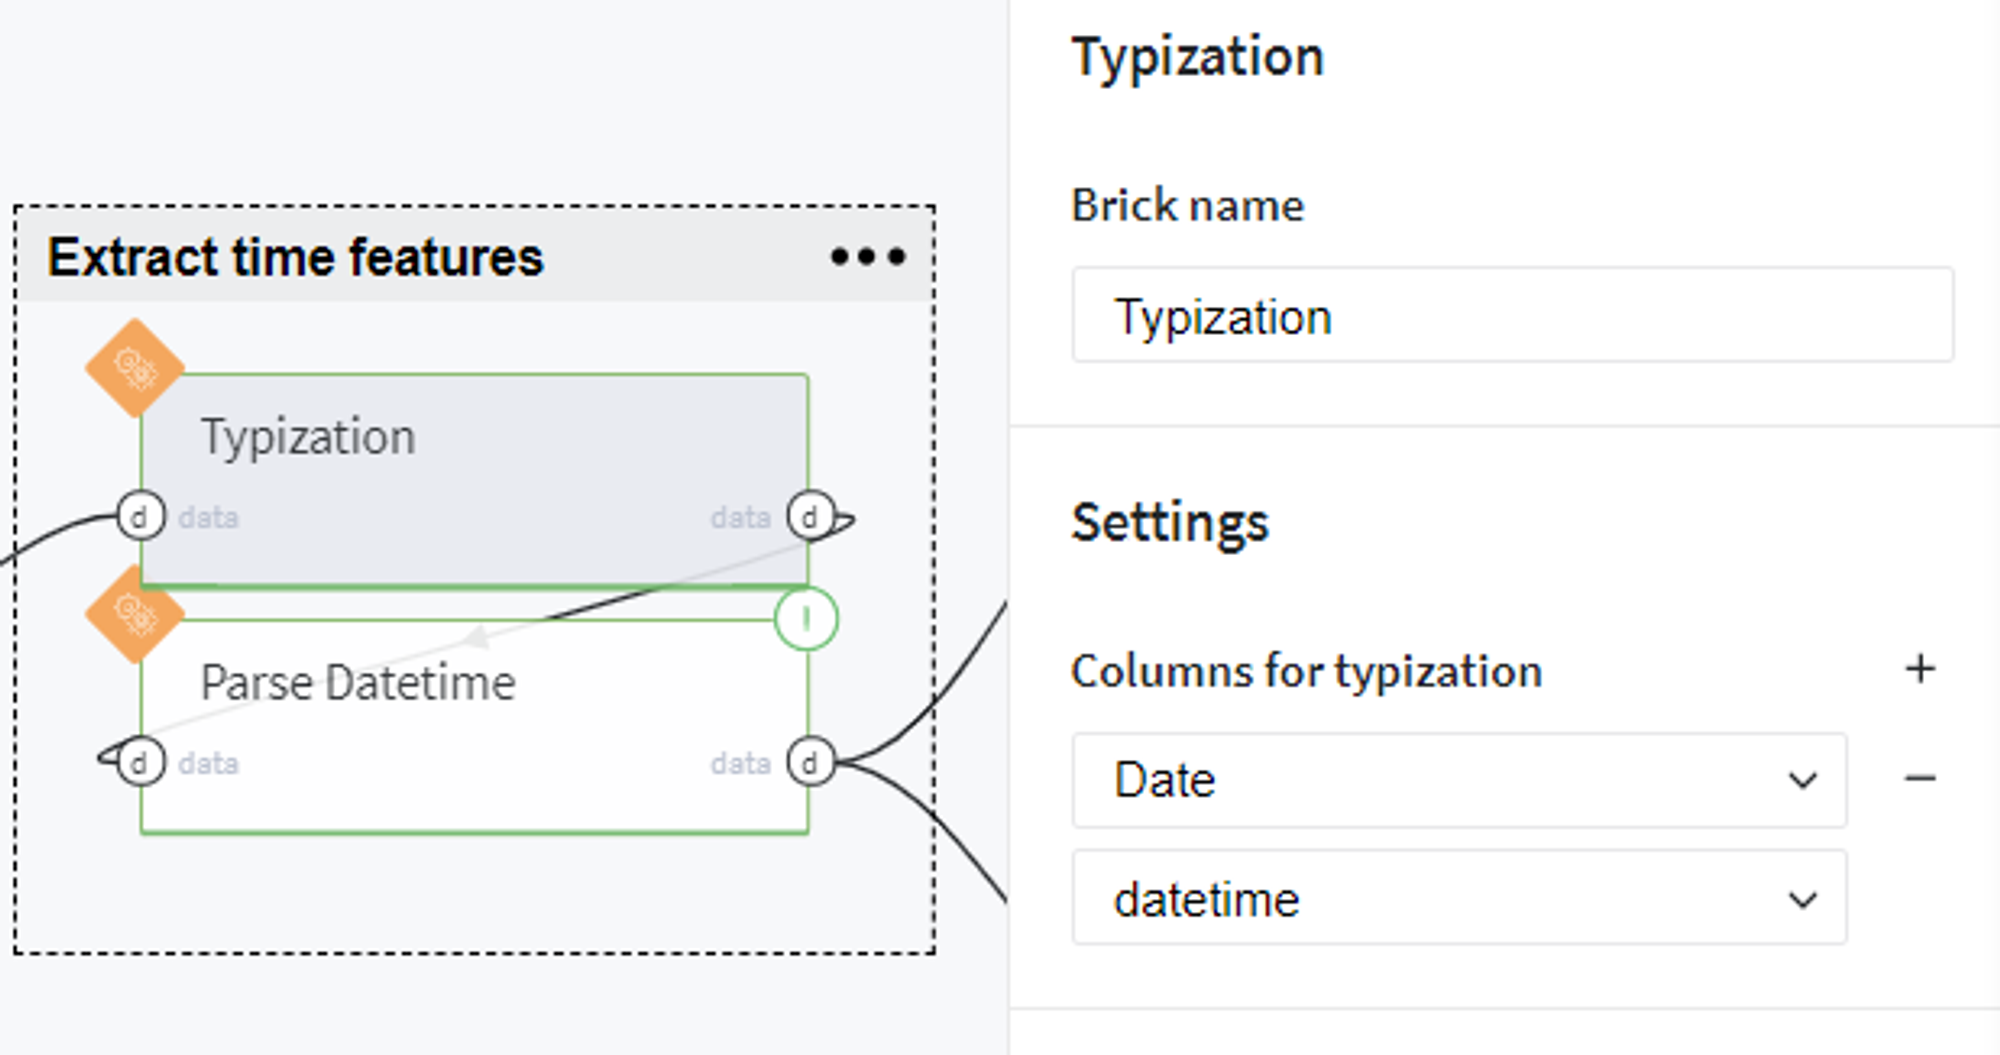
and extract the date parts such as year, month, day of the month and weekday:
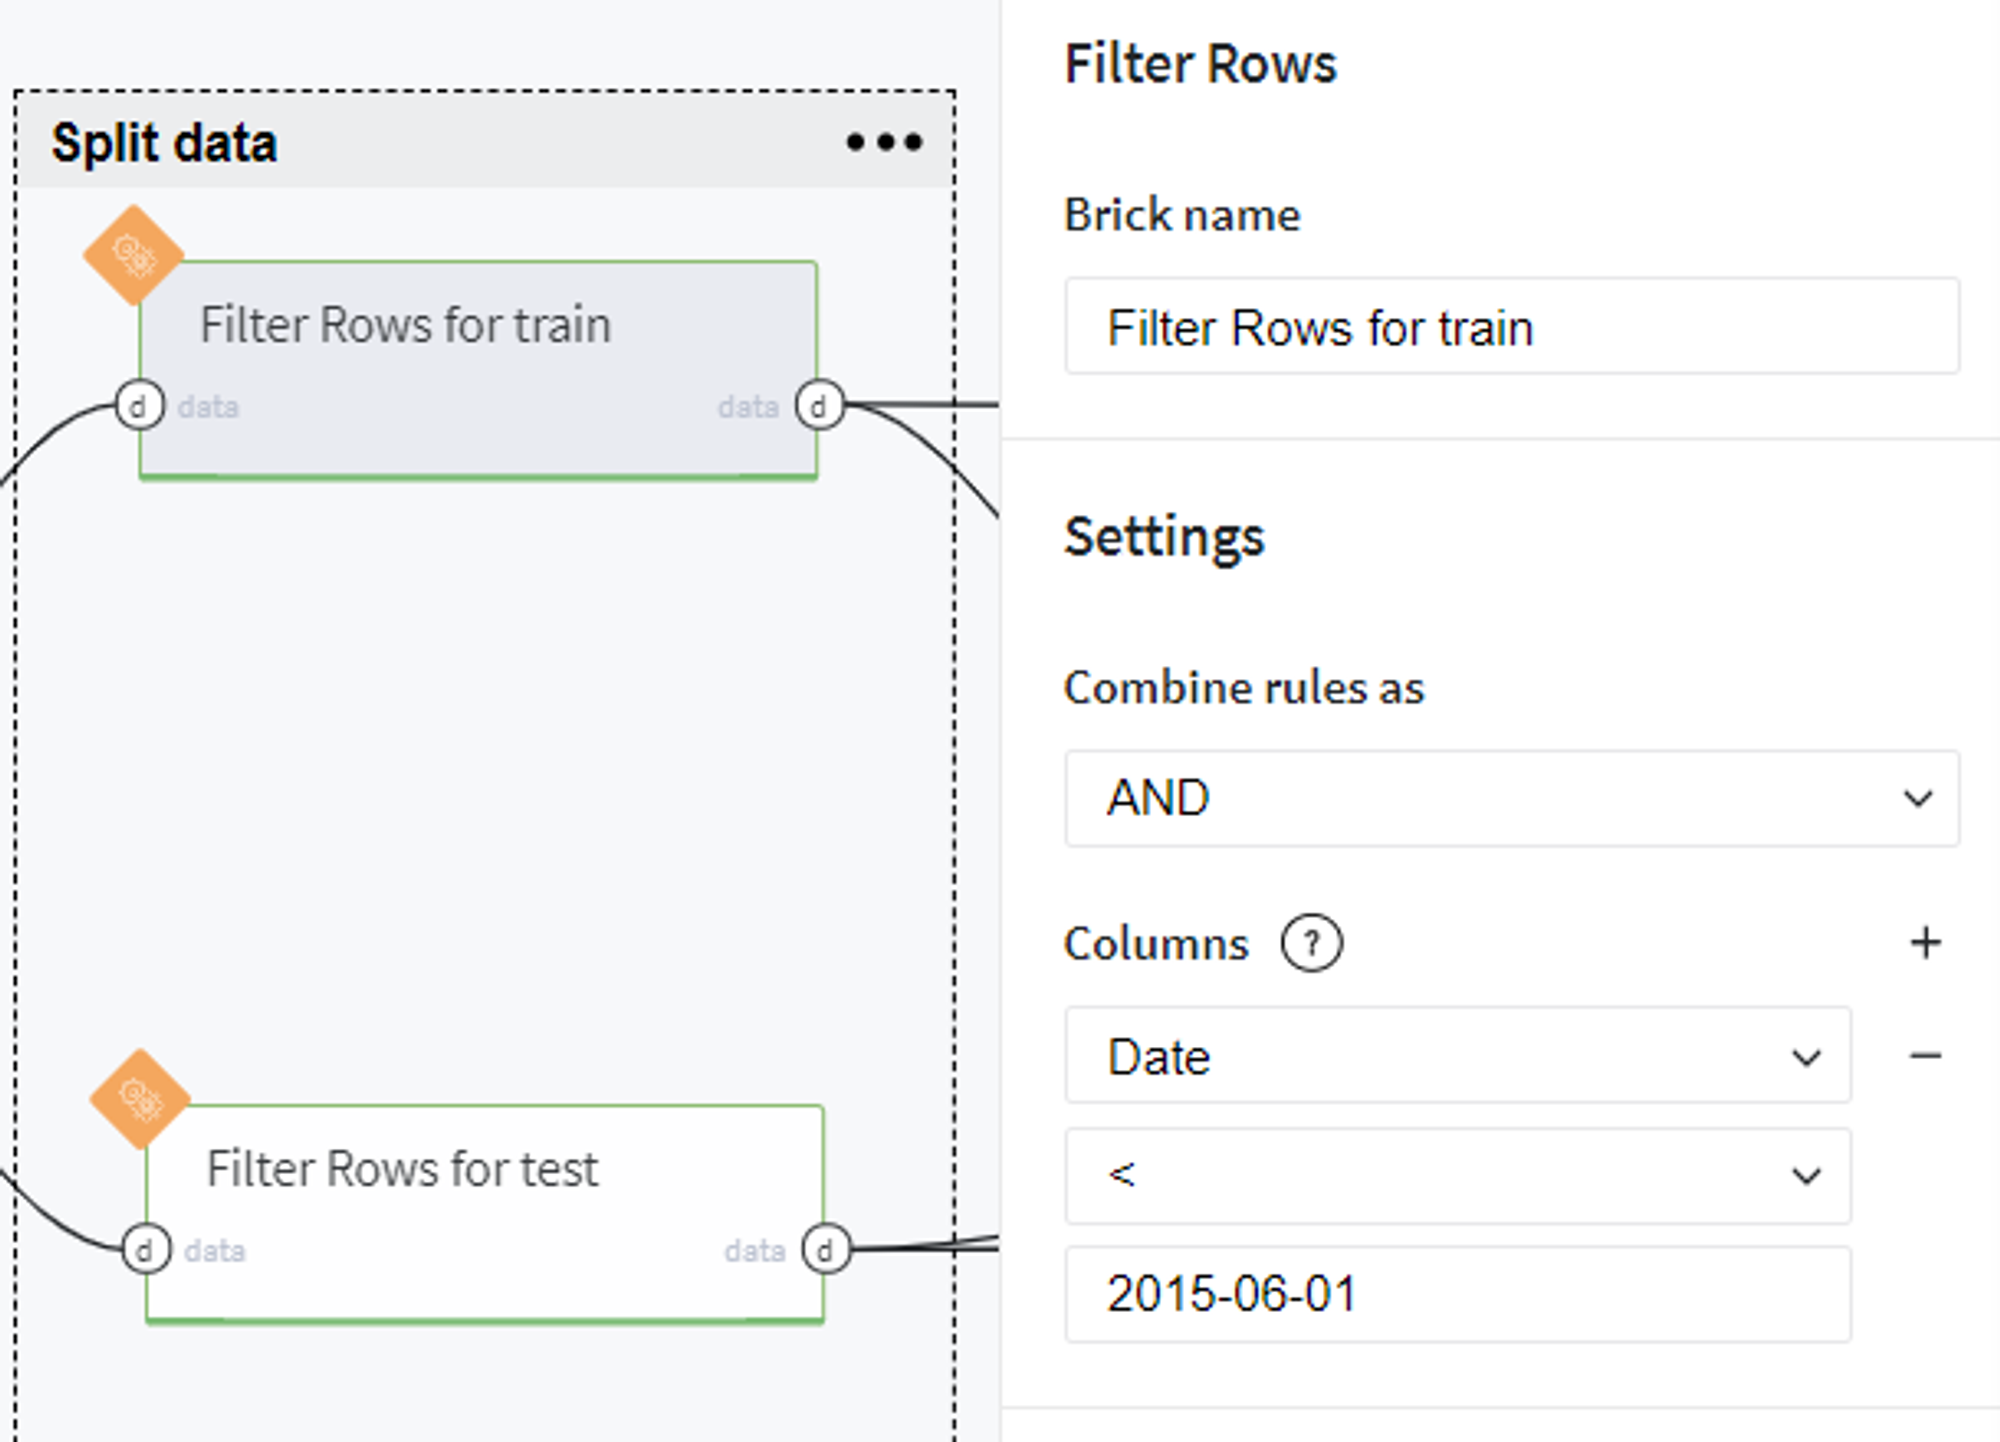
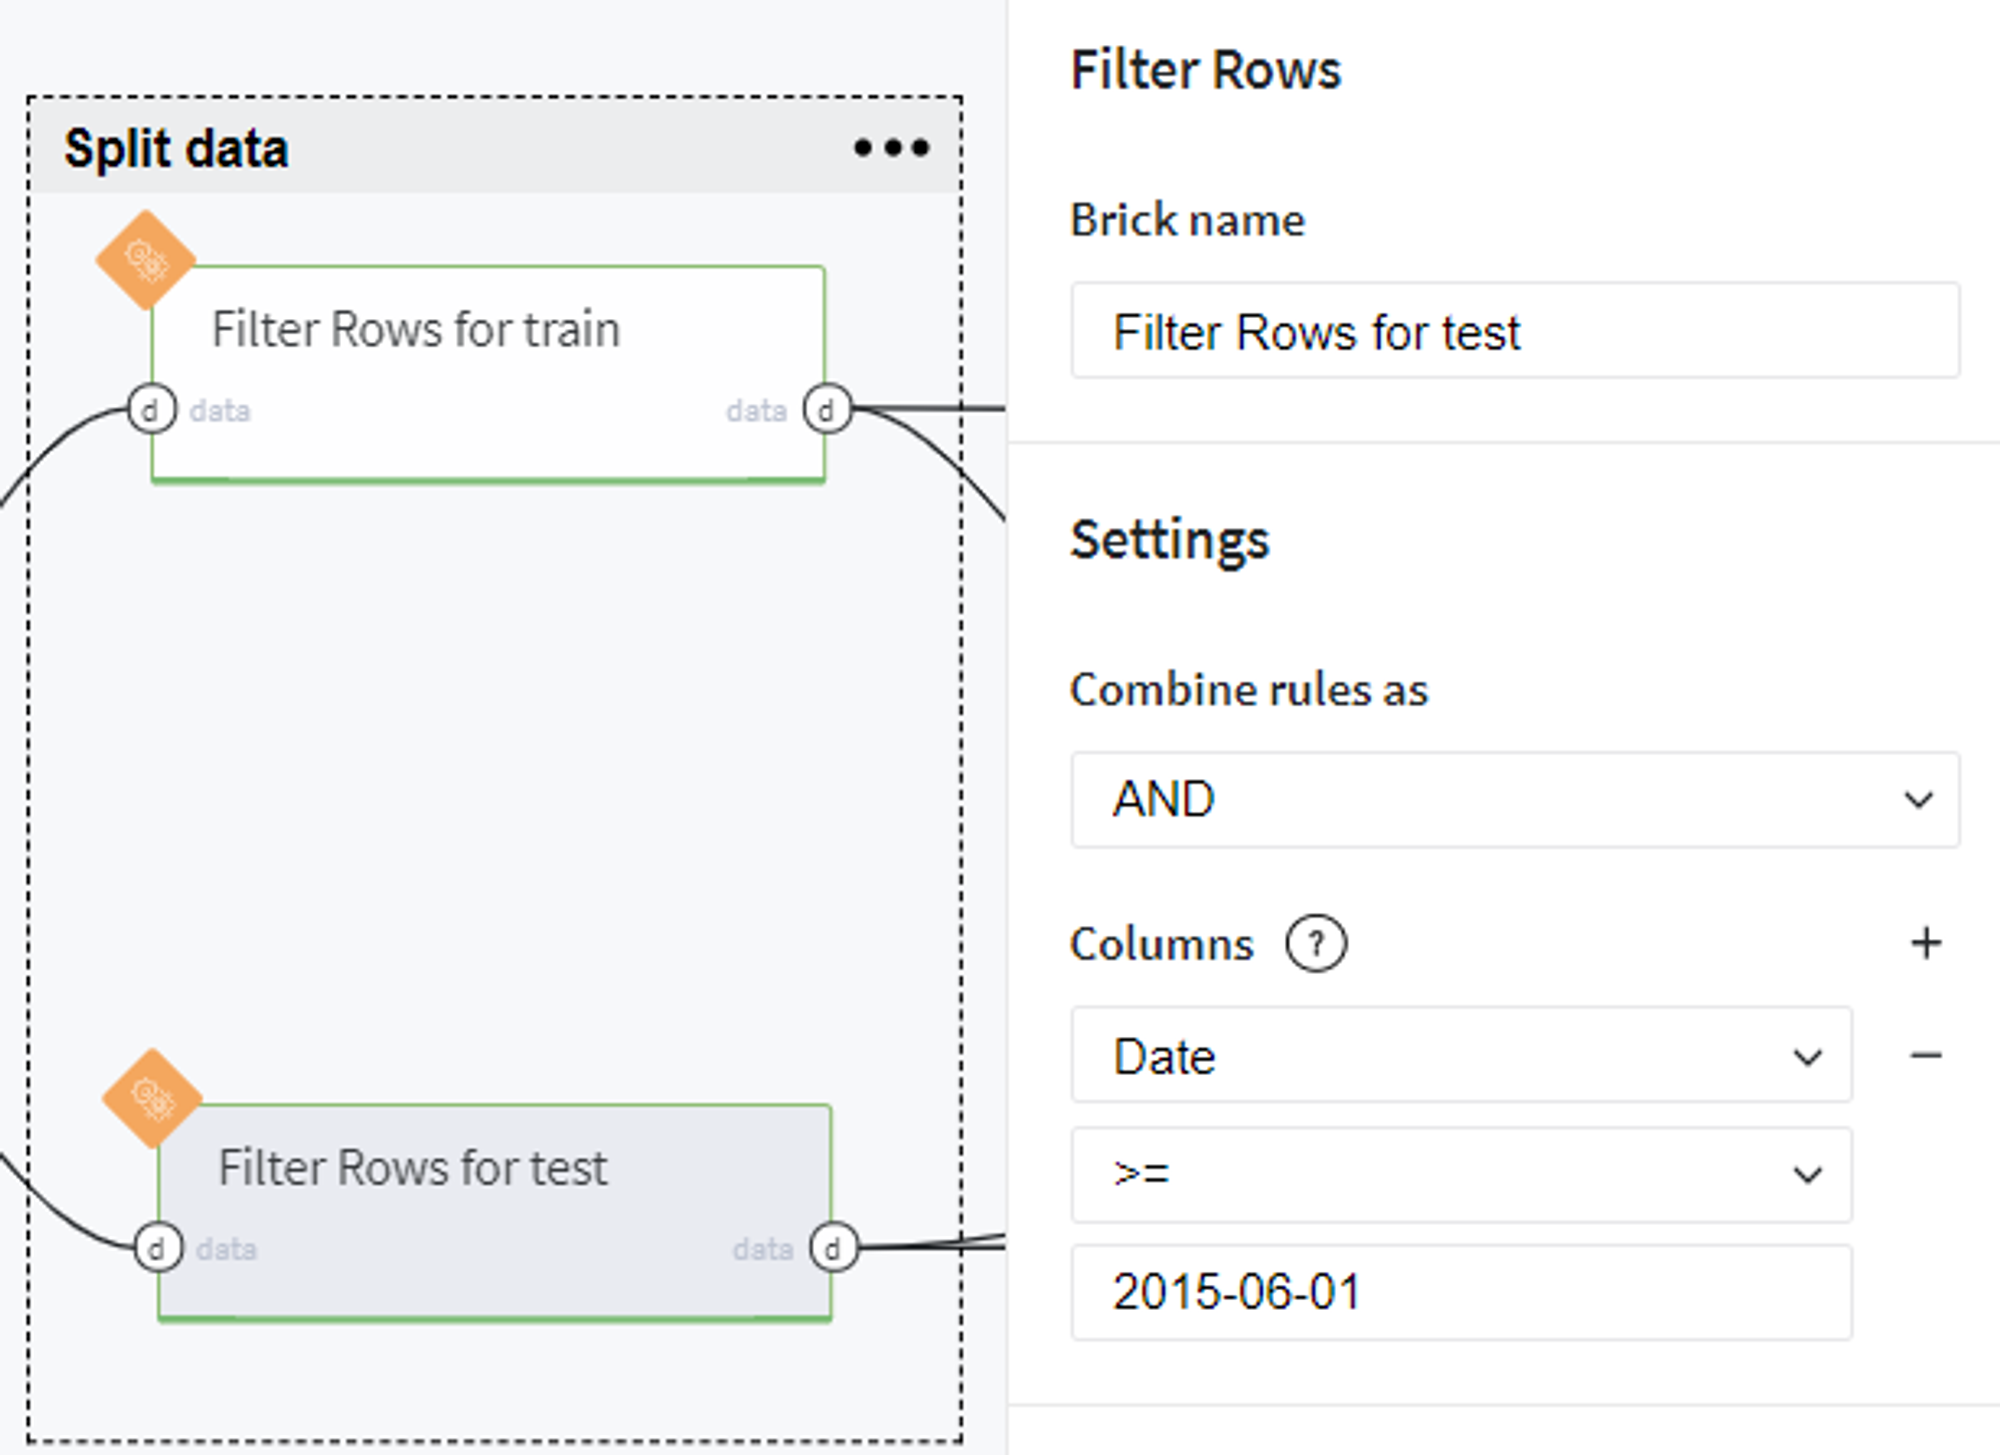
Split data
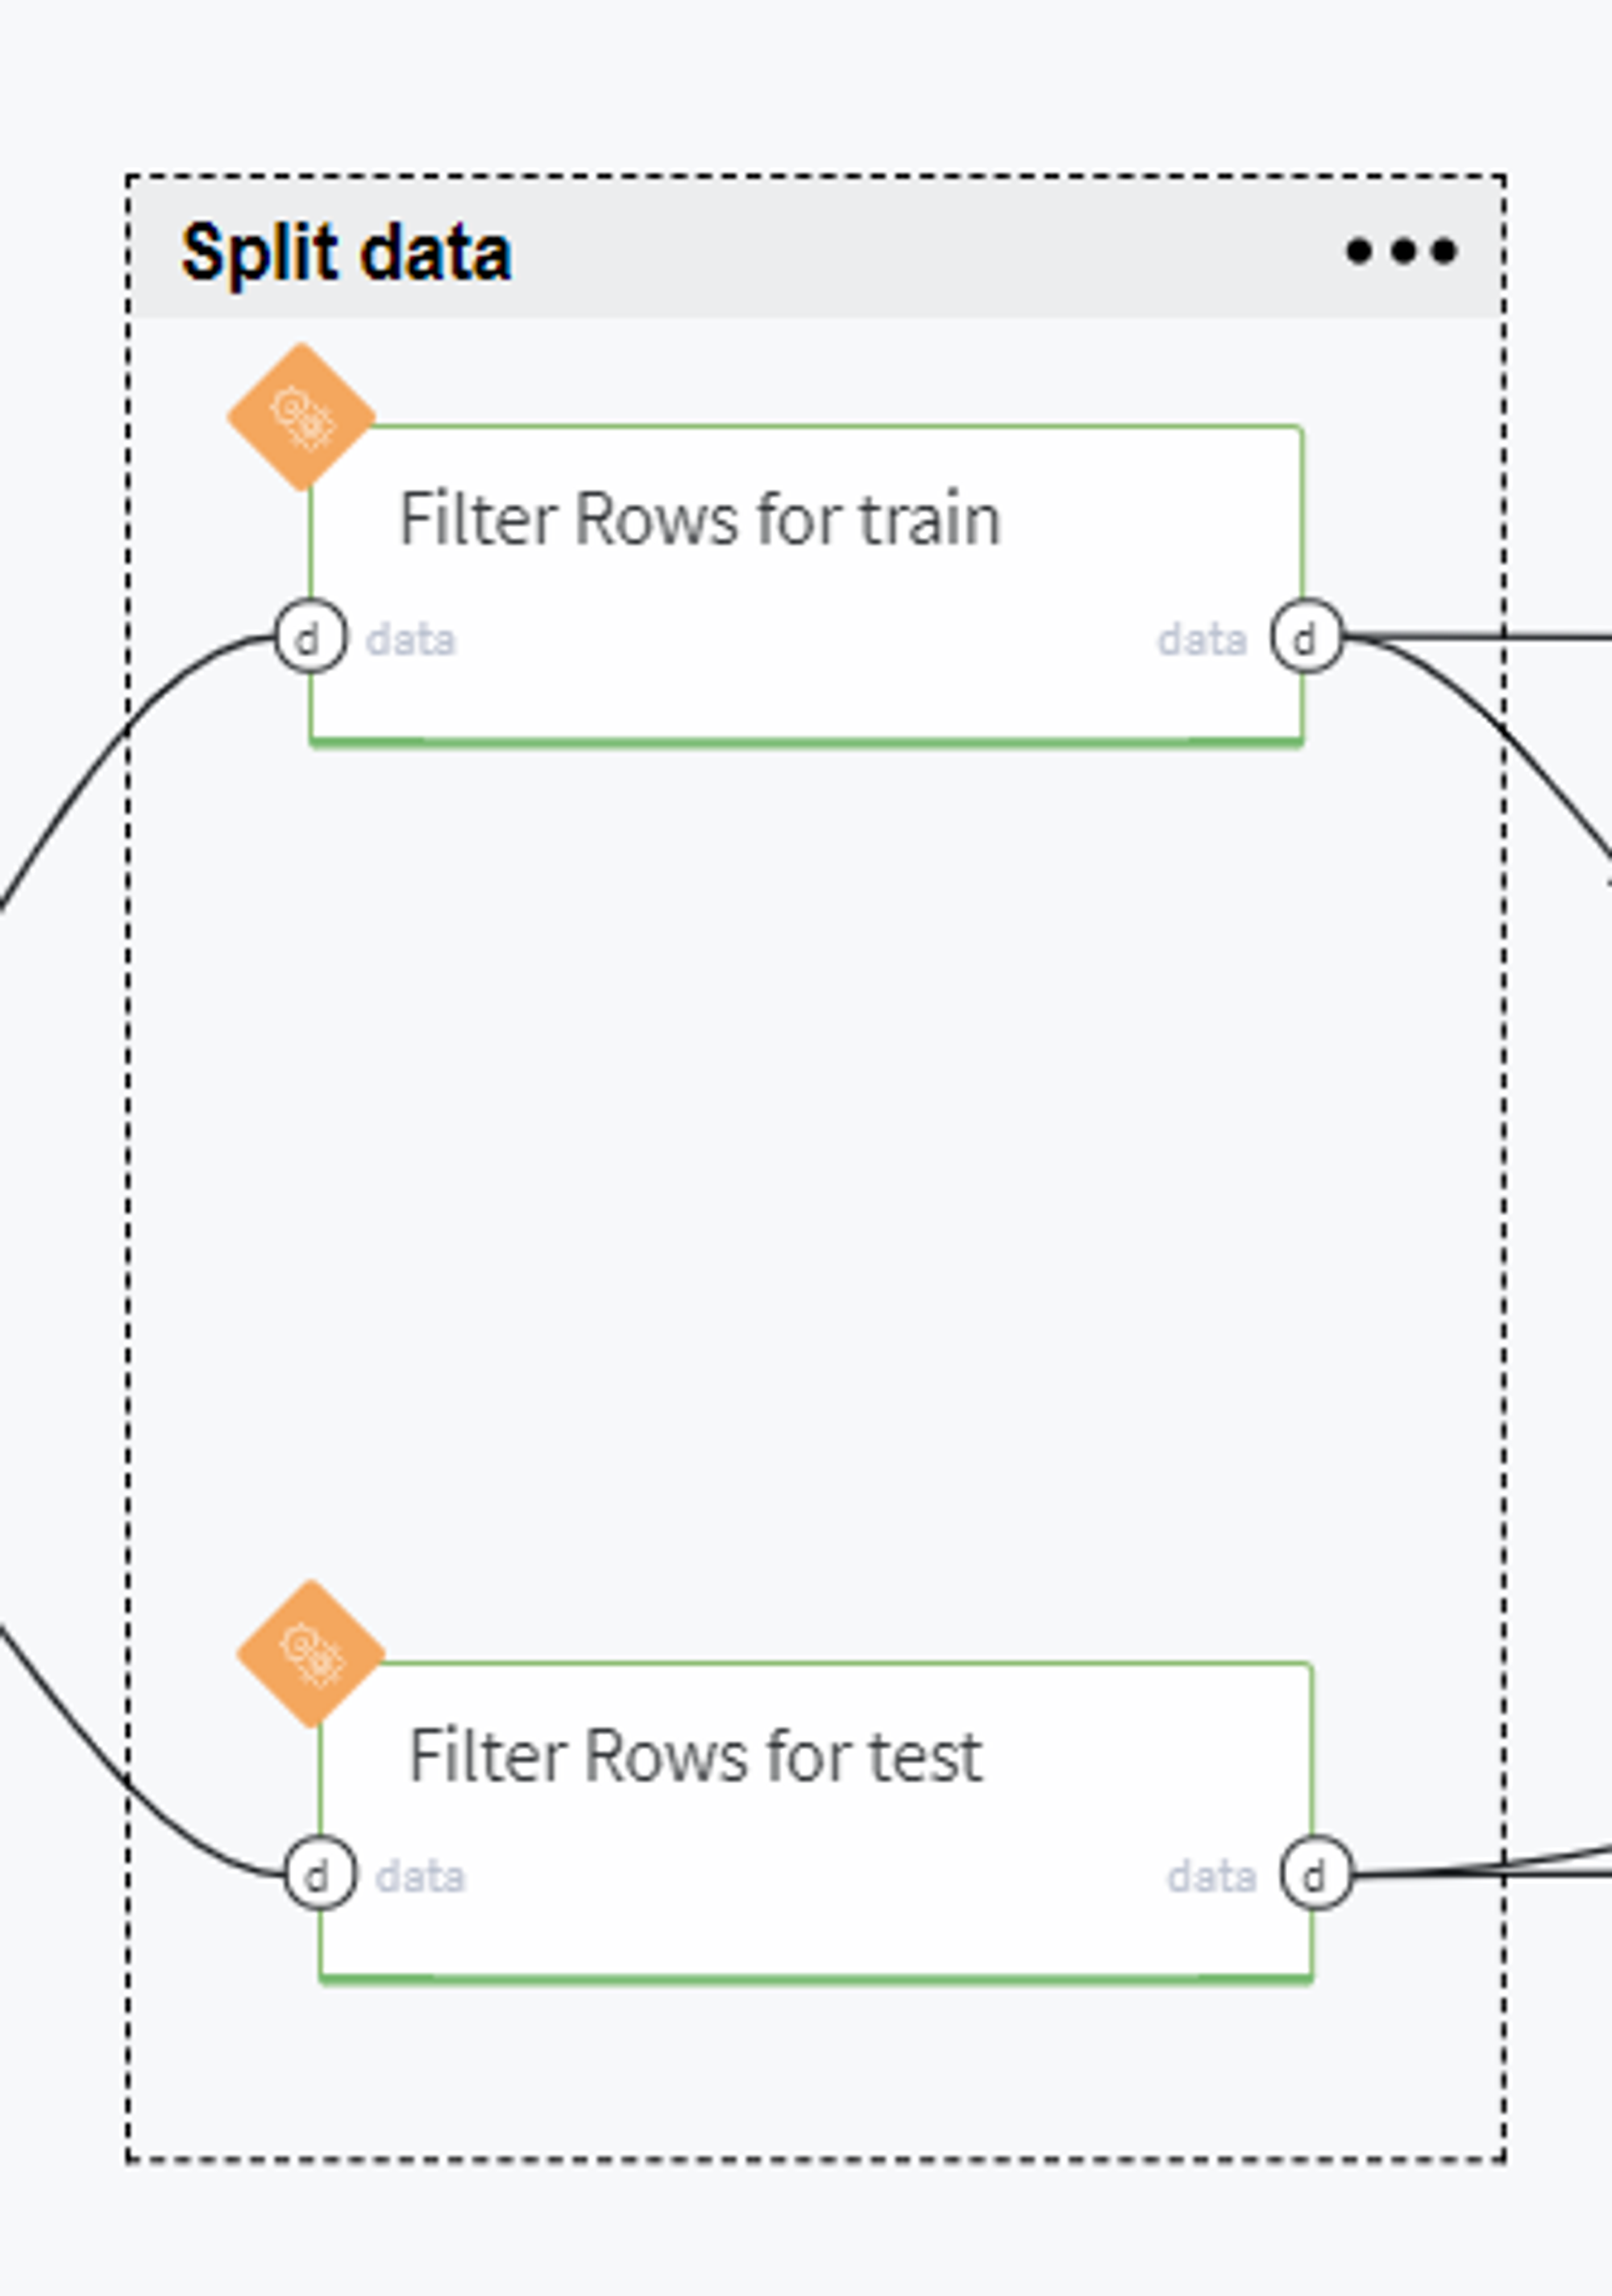
BRICKS:
Filter RowsIn the next step, we split our data into train and test sets by making the selection by time. Thus, to the train set we put the observations taken before the 1st June 2015:
Conversely, the samples from the 1st June 2015 to the 31st July 2015 we consider as a test set:
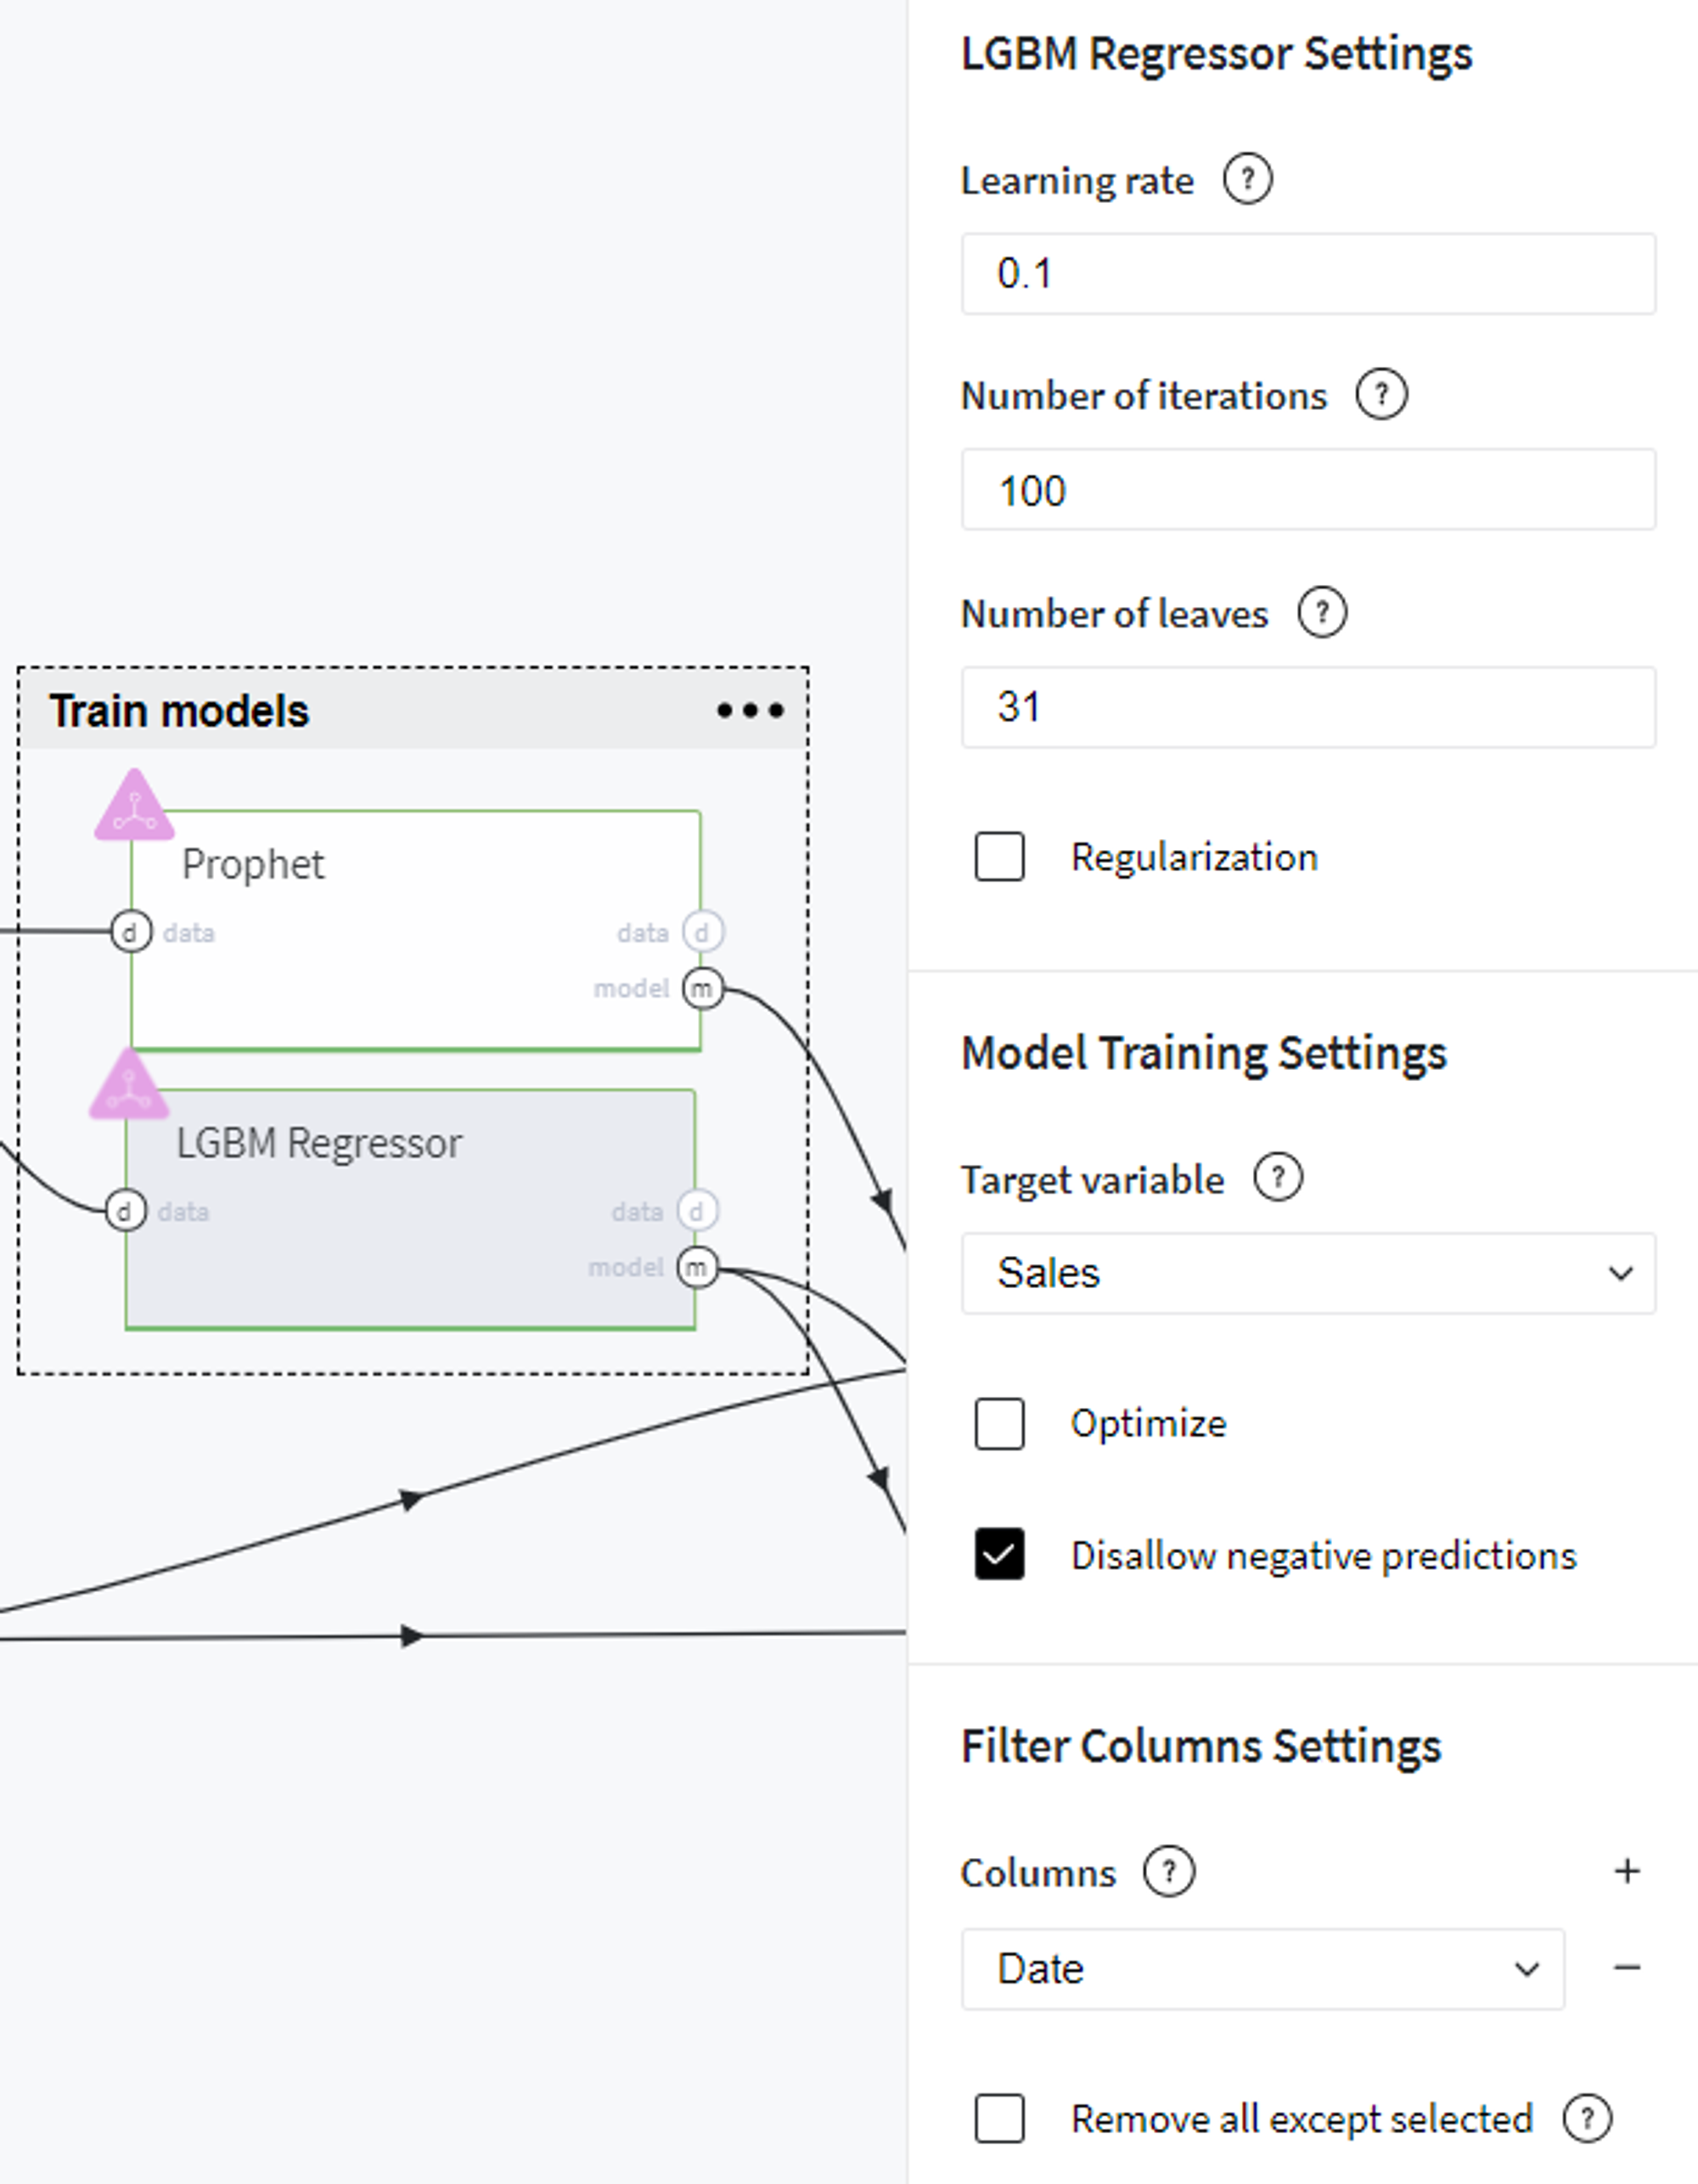
Train models
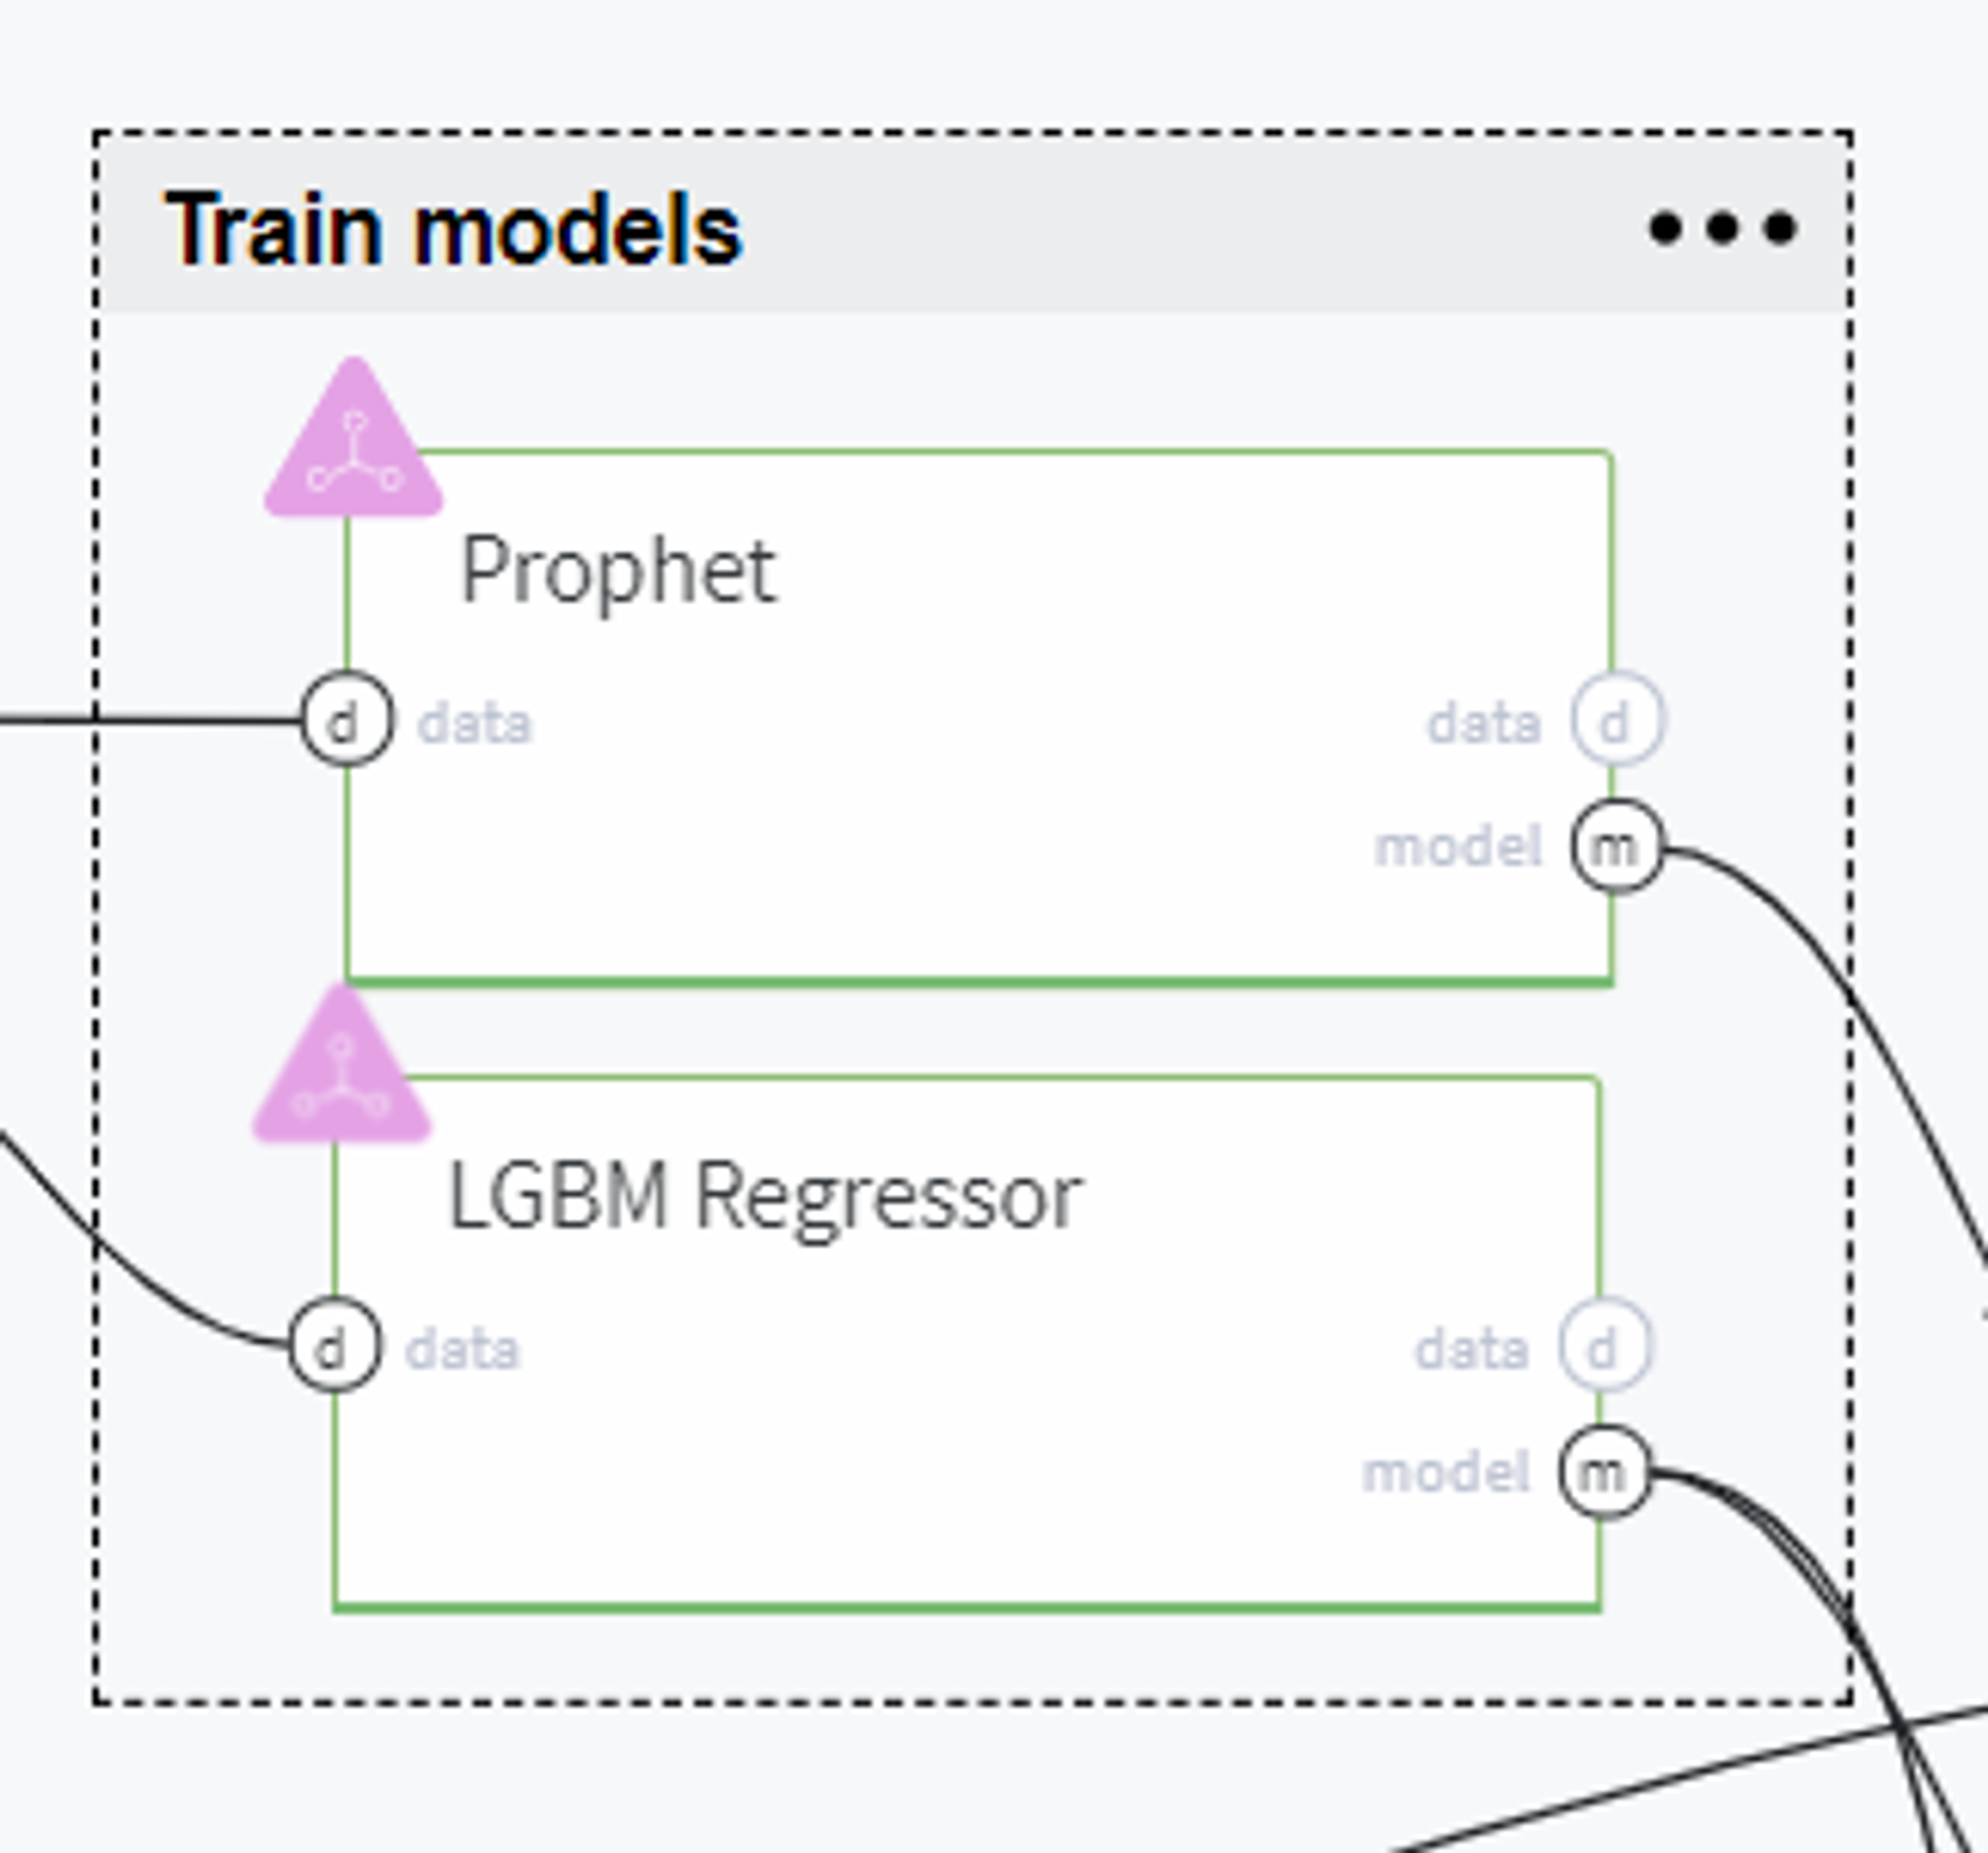
Now, using the train data we build several forecasting models to compare and select the best one for solving our case.
The first candidate here is the Prophet model which is widely used for time series prediction.
Since this model automatically encodes date variable, we filter out the columns with parsed date parts and specify the rest of the parameters as follows:
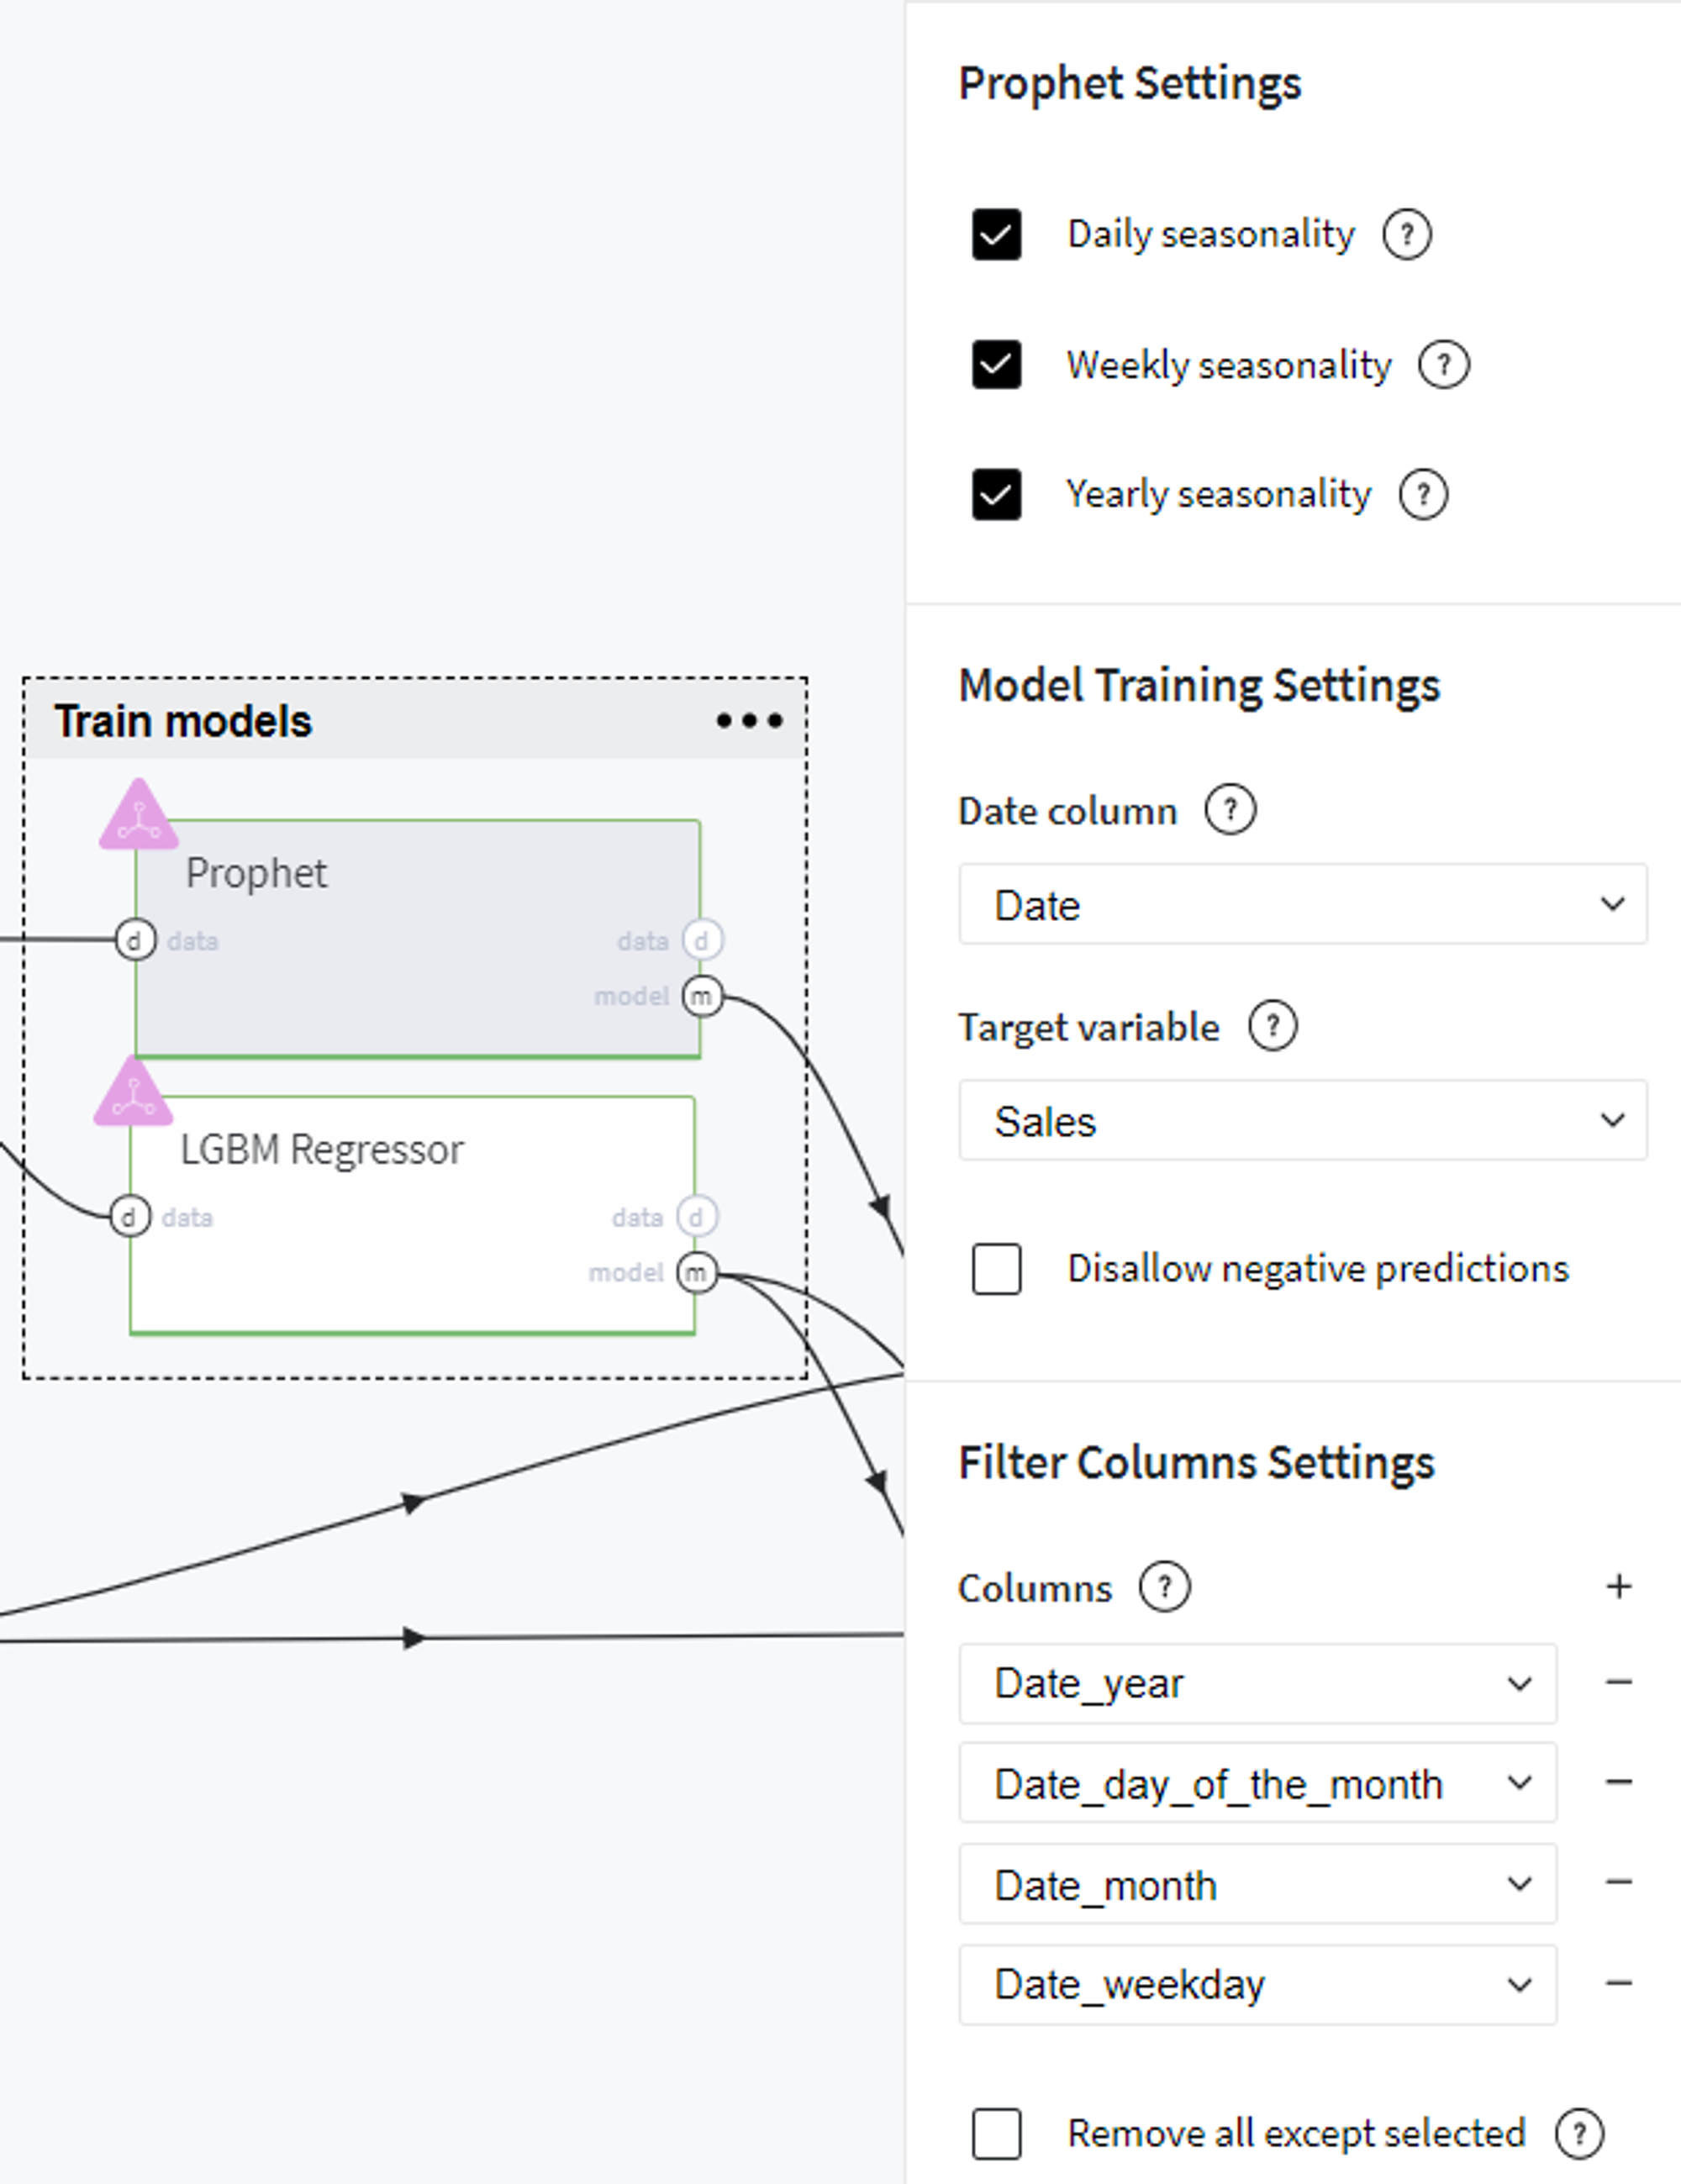
As the alternative model, we chose LGBM Regressor with the following settings:
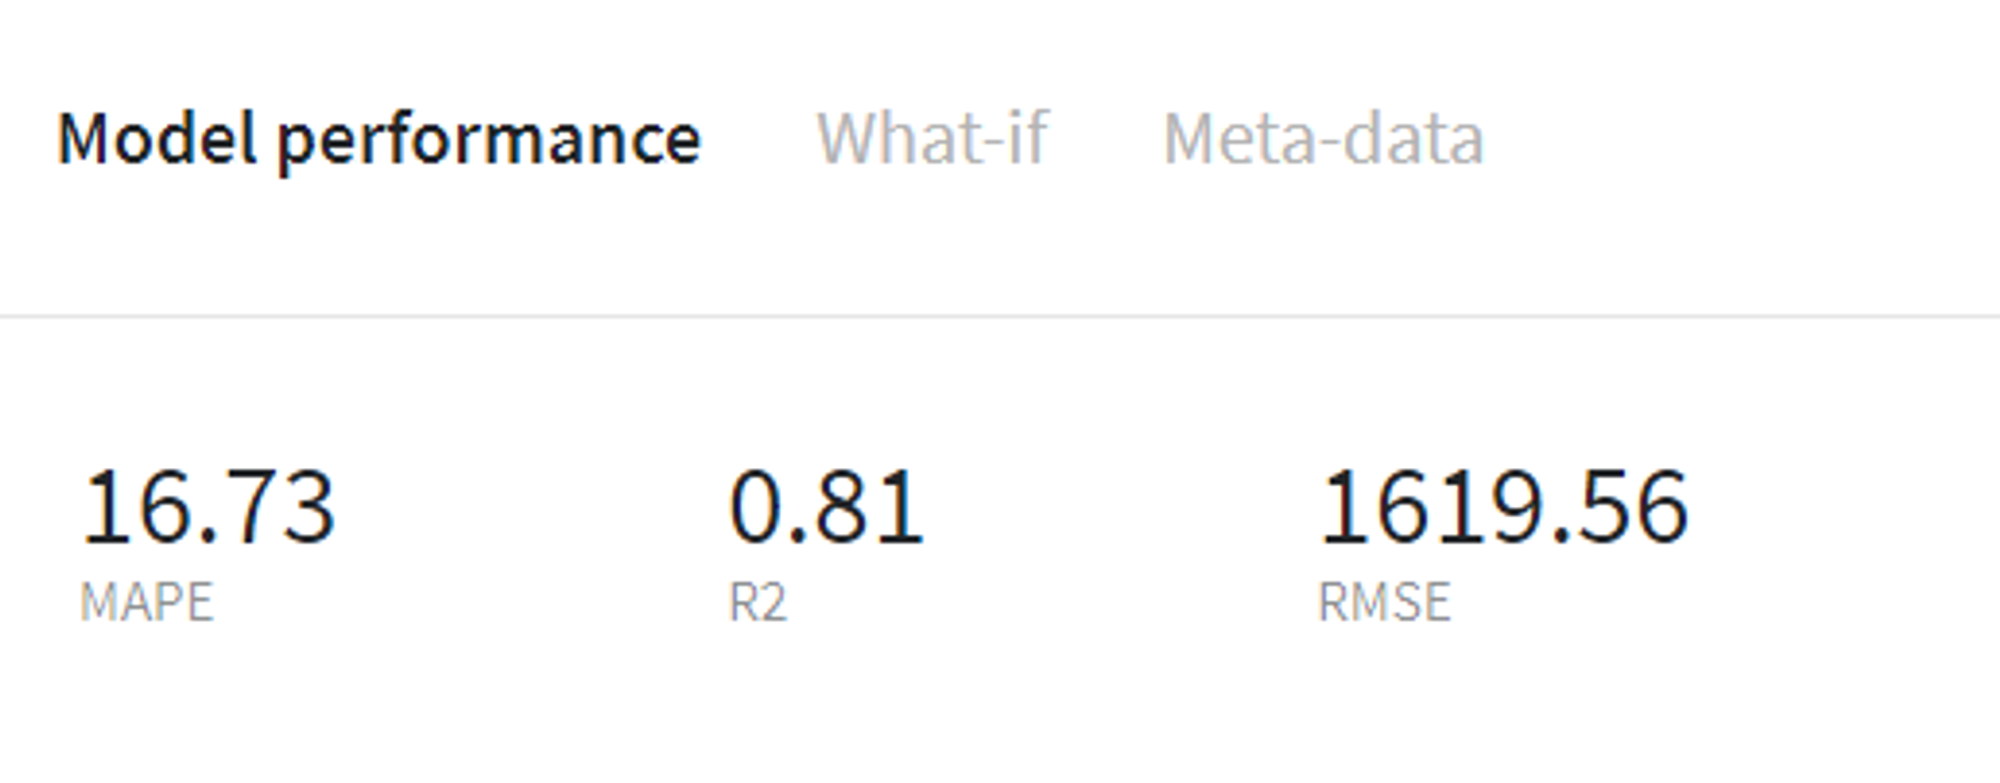
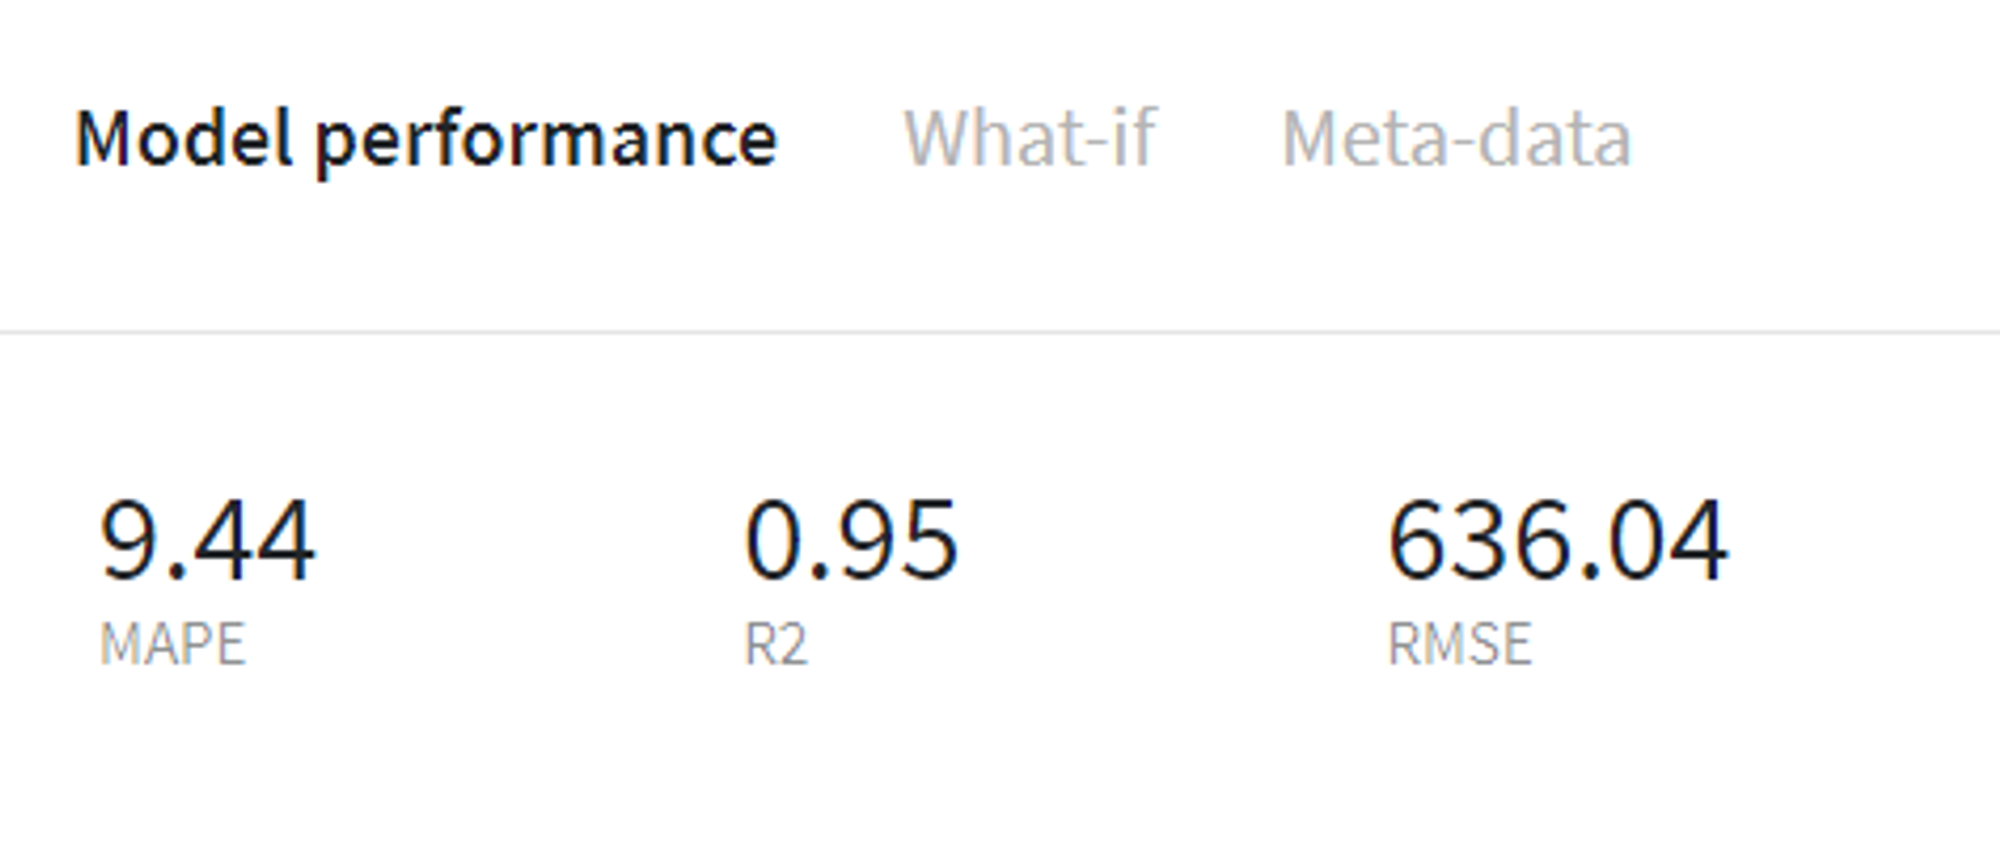
After performing these steps we can evaluate the models' performance on the train data using Model info → Open view on every brick menu and, for instance, compare the common prediction metrics of two models.
Prophet model performance (train)
LGBM Regressor model performance (train)
Evaluate models
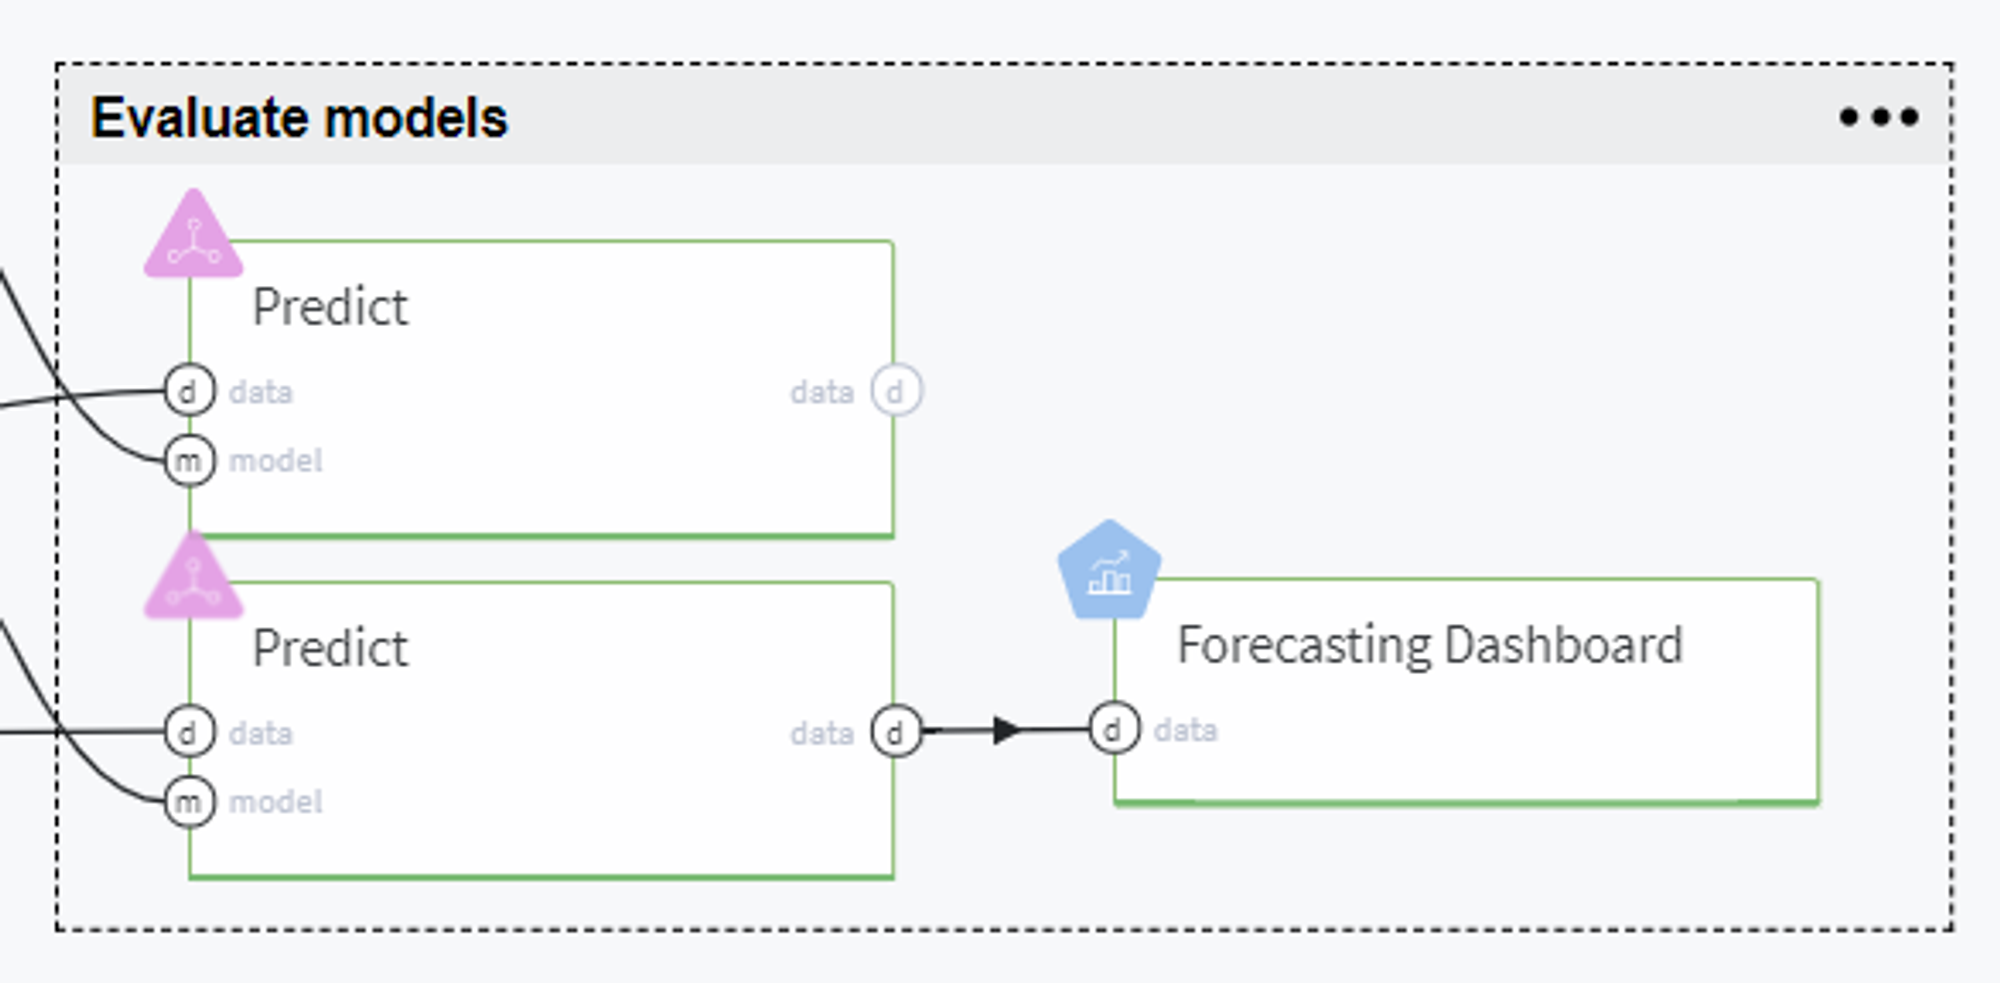
Thereafter, we evaluate the trained models on the test set using Predict brick and compare the models' performance on the tab Predict stats → Model Performance on every brick:
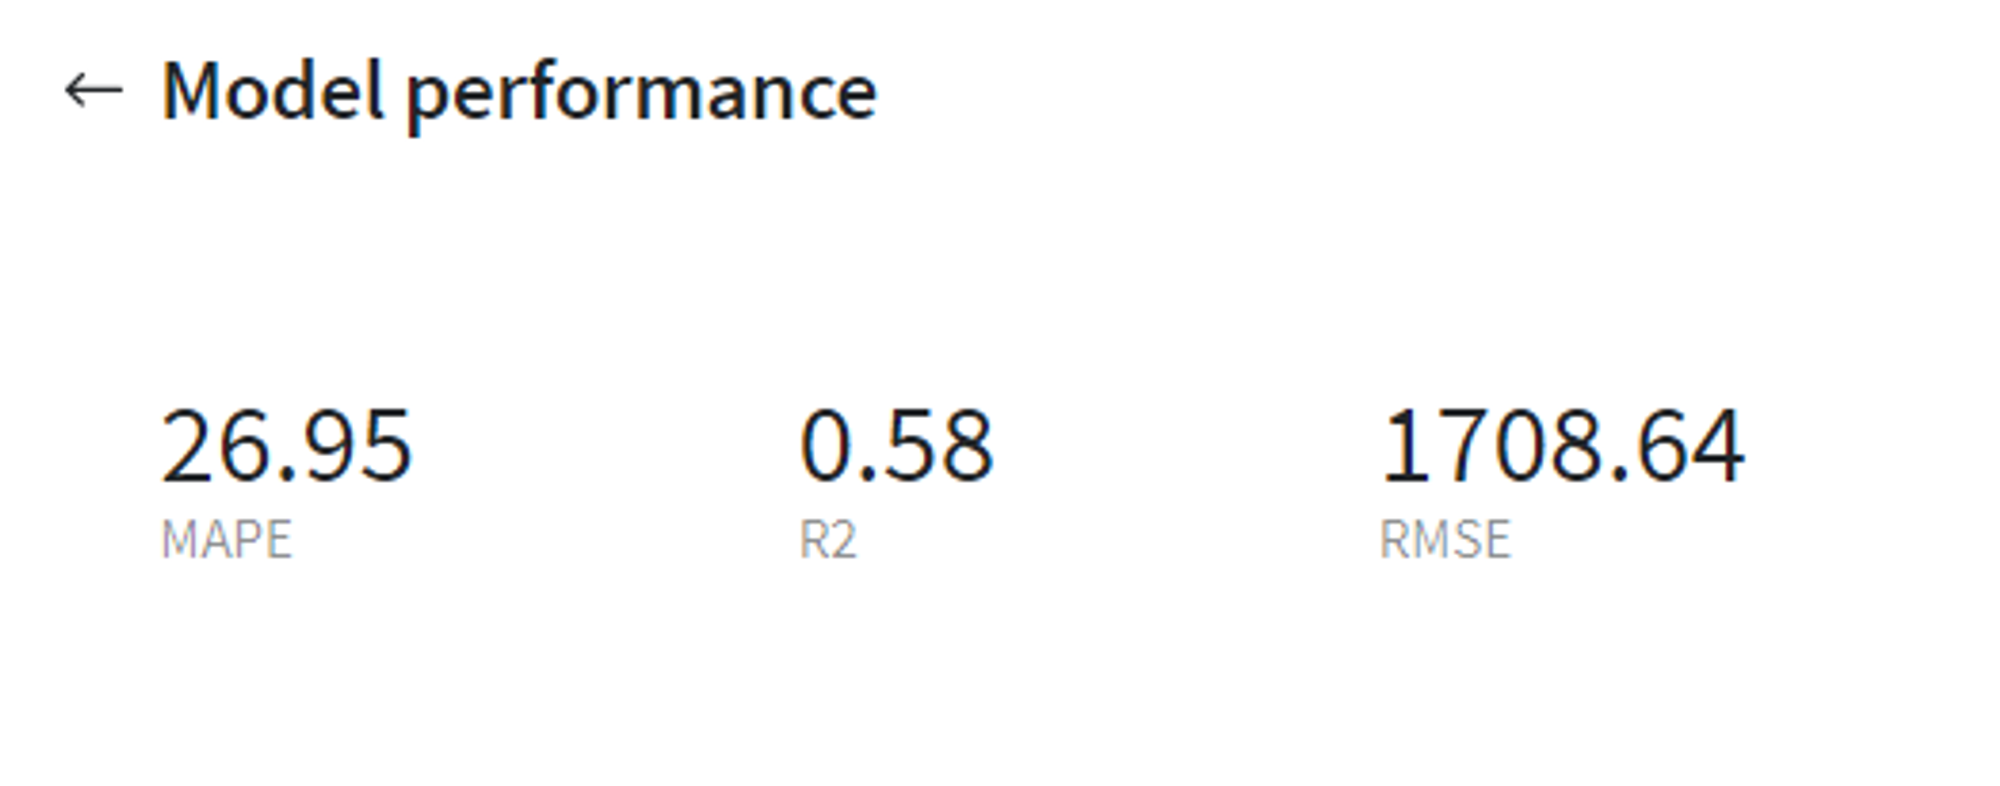
Prophet model performance (test)
LGBM Regressor performance (test)
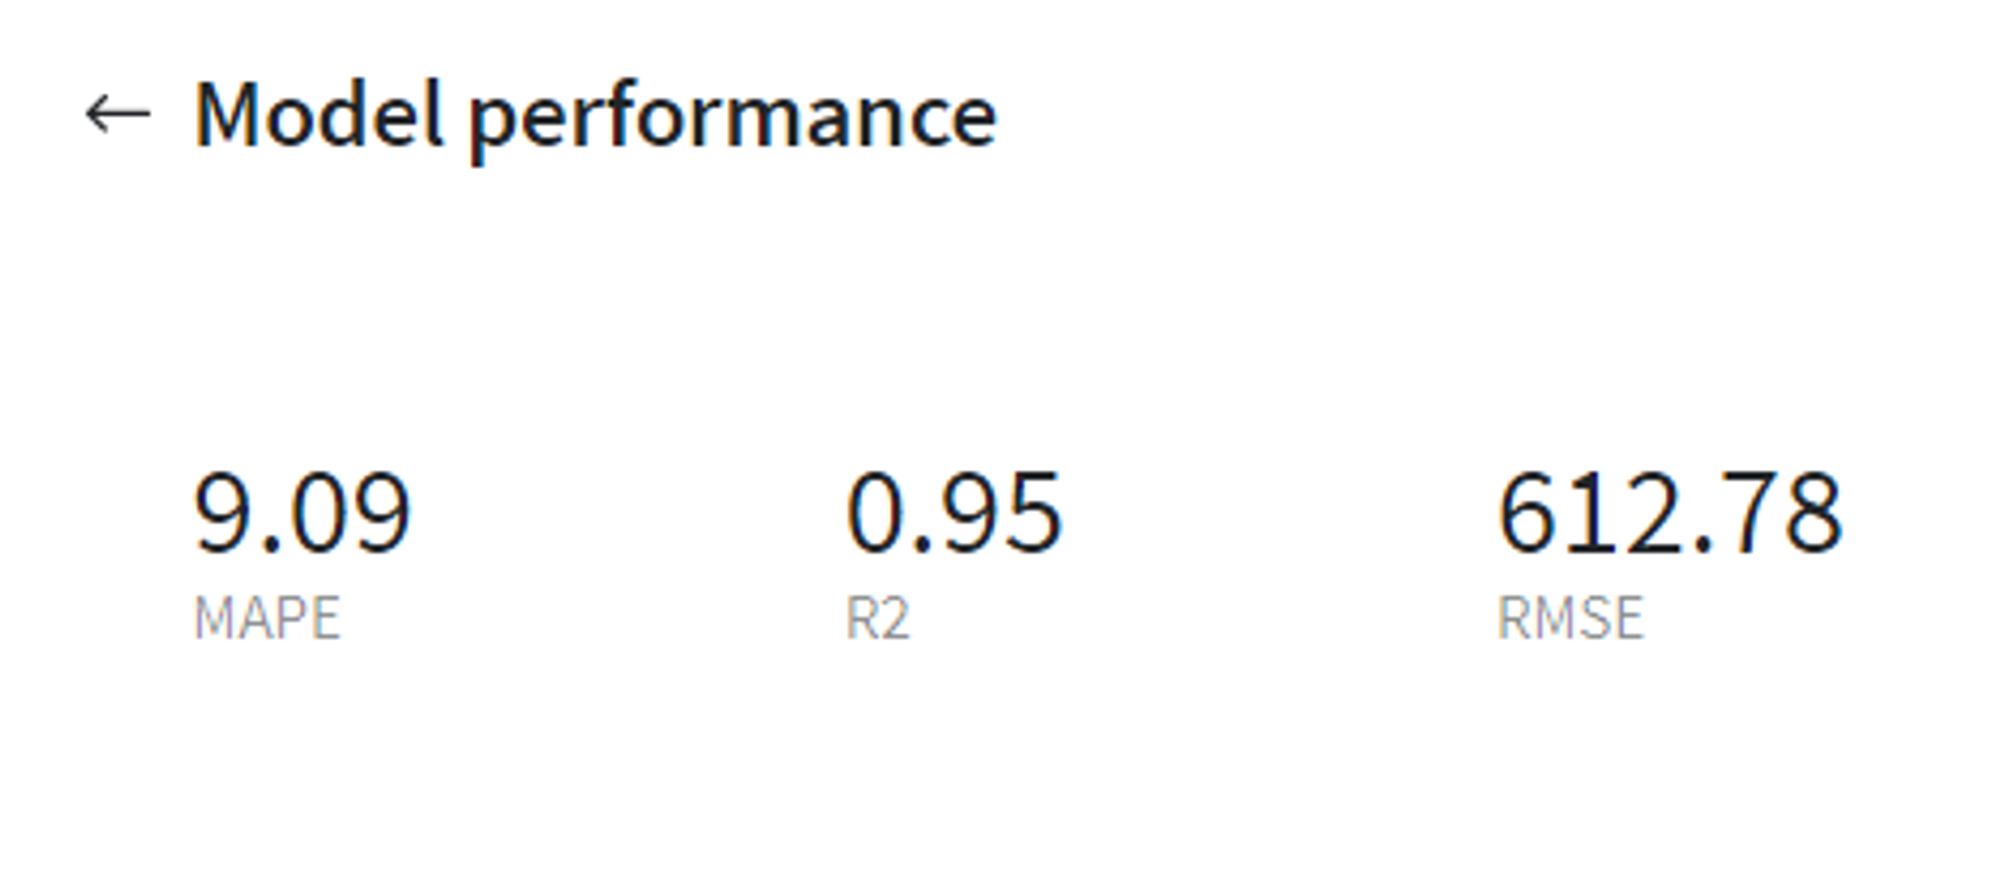
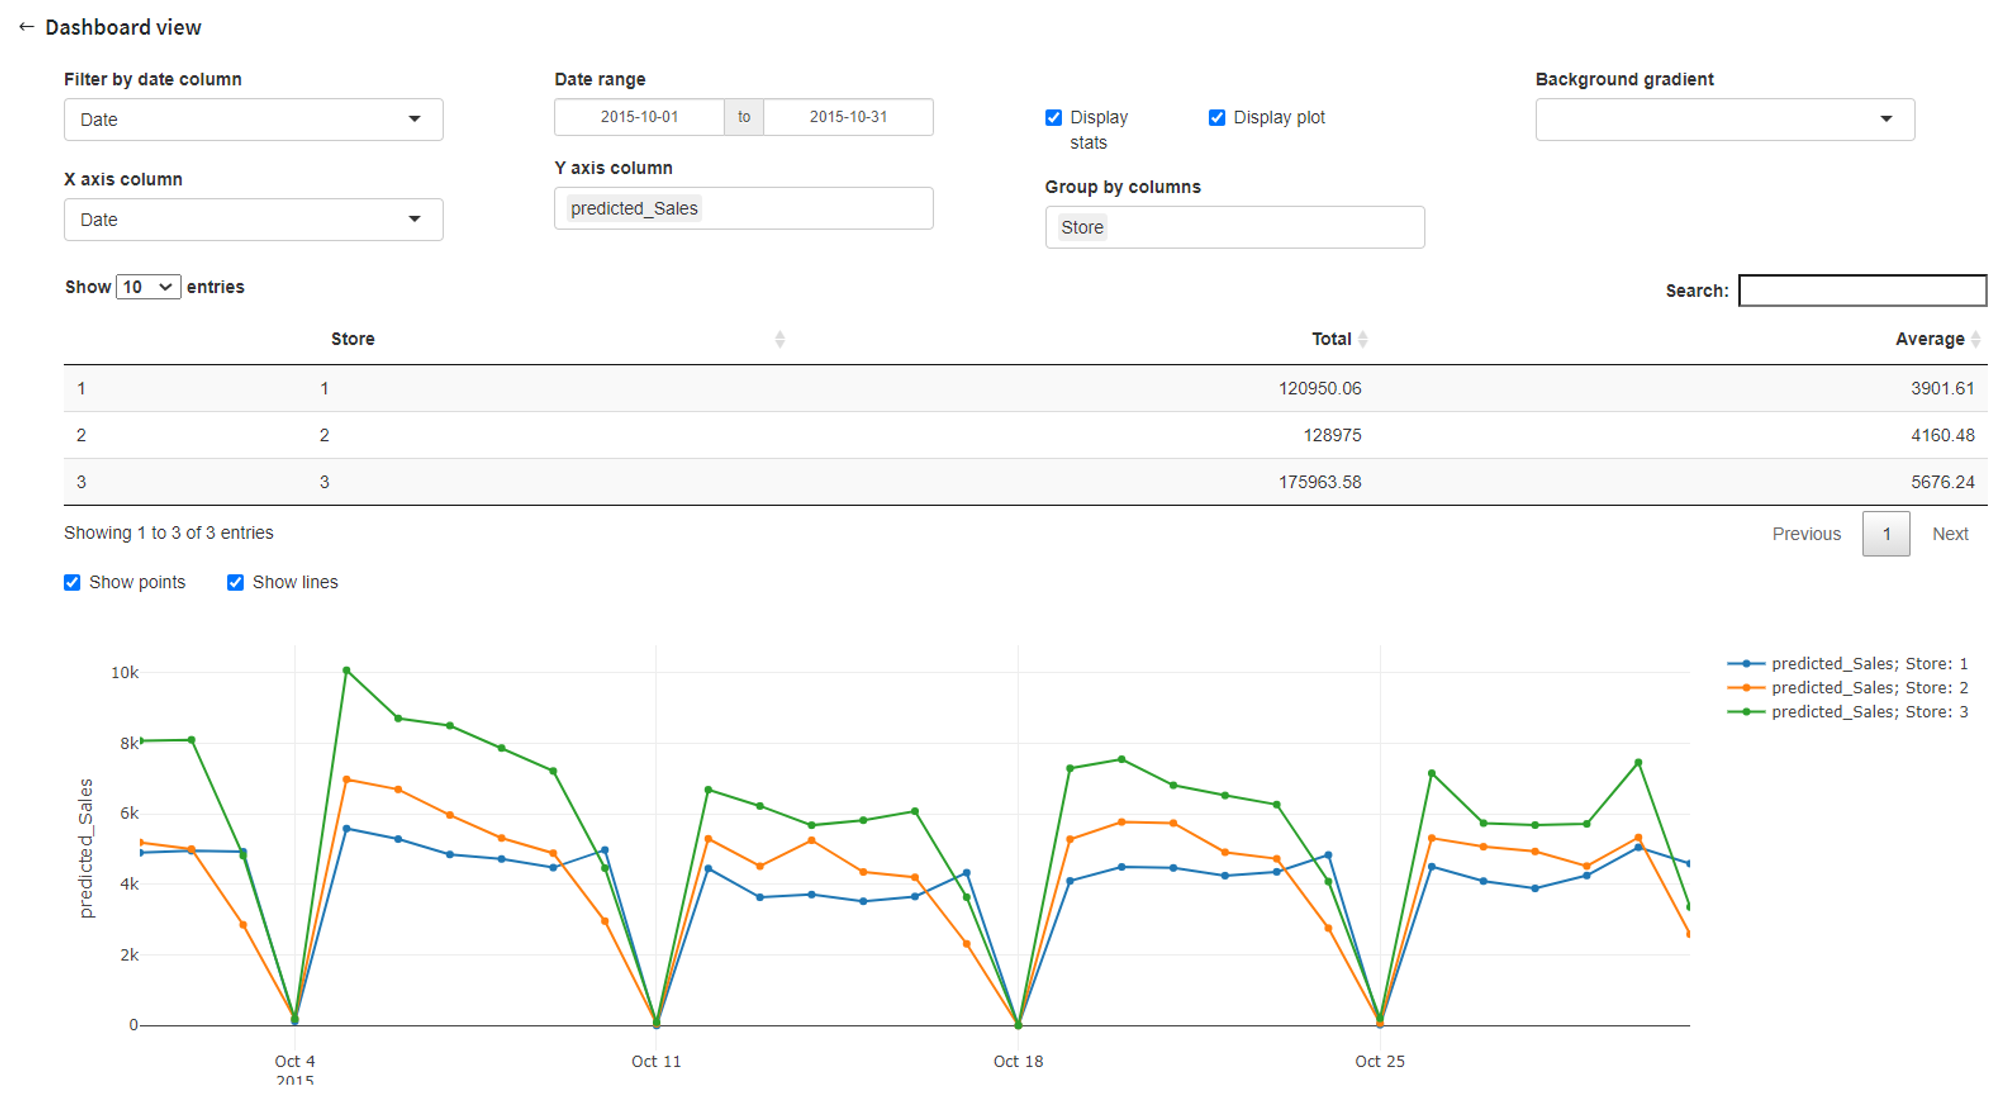
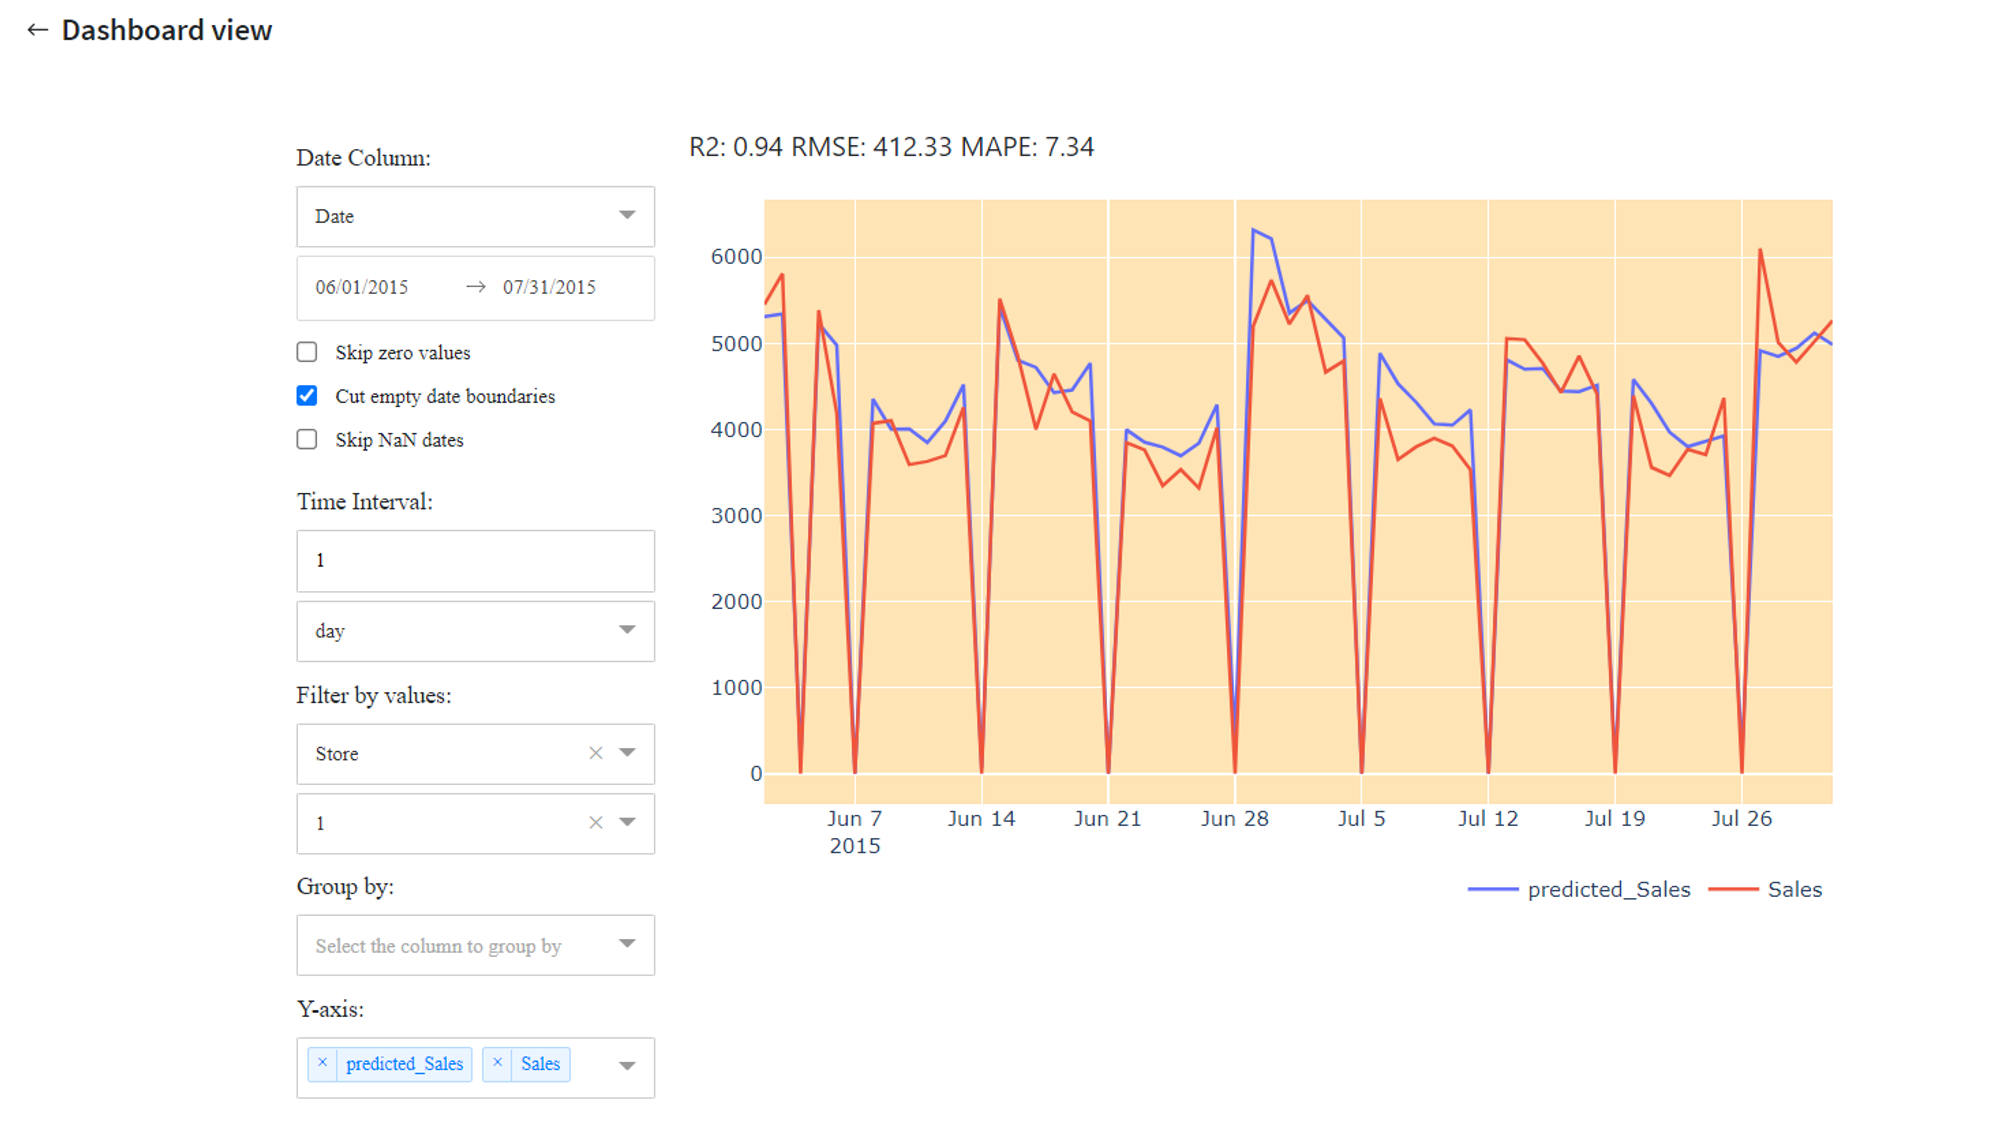
From that we can conclude that the LGBM Regressor model gives us much more accurate results on the test set, therefore it makes sense to use this model further for prediction and also assess the forecast visually with Forecasting Dashboard by looking at predicted sales values for every store or in total.
Predict
Finally, we can use the obtained model for further predictions.
Let us assume that we need to make a daily sales forecast for October 2015, which is totally absent in our initial dataset. Hence, for doing so, firstly we need to create the prediction dataset from scratch.
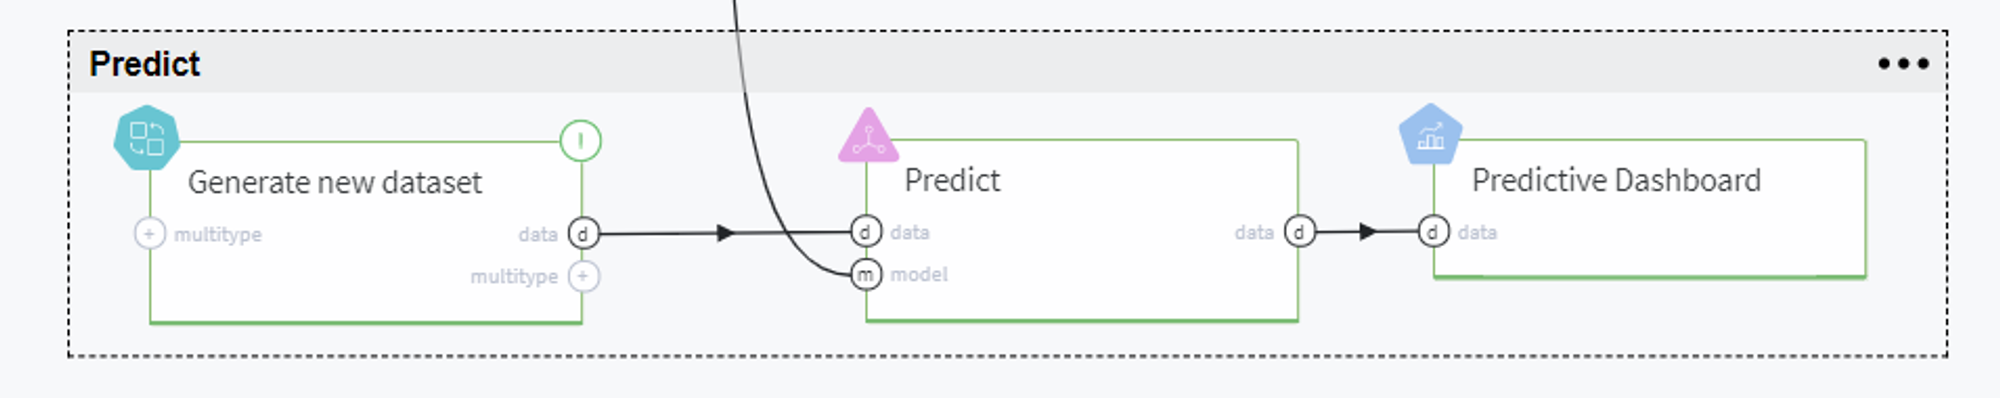
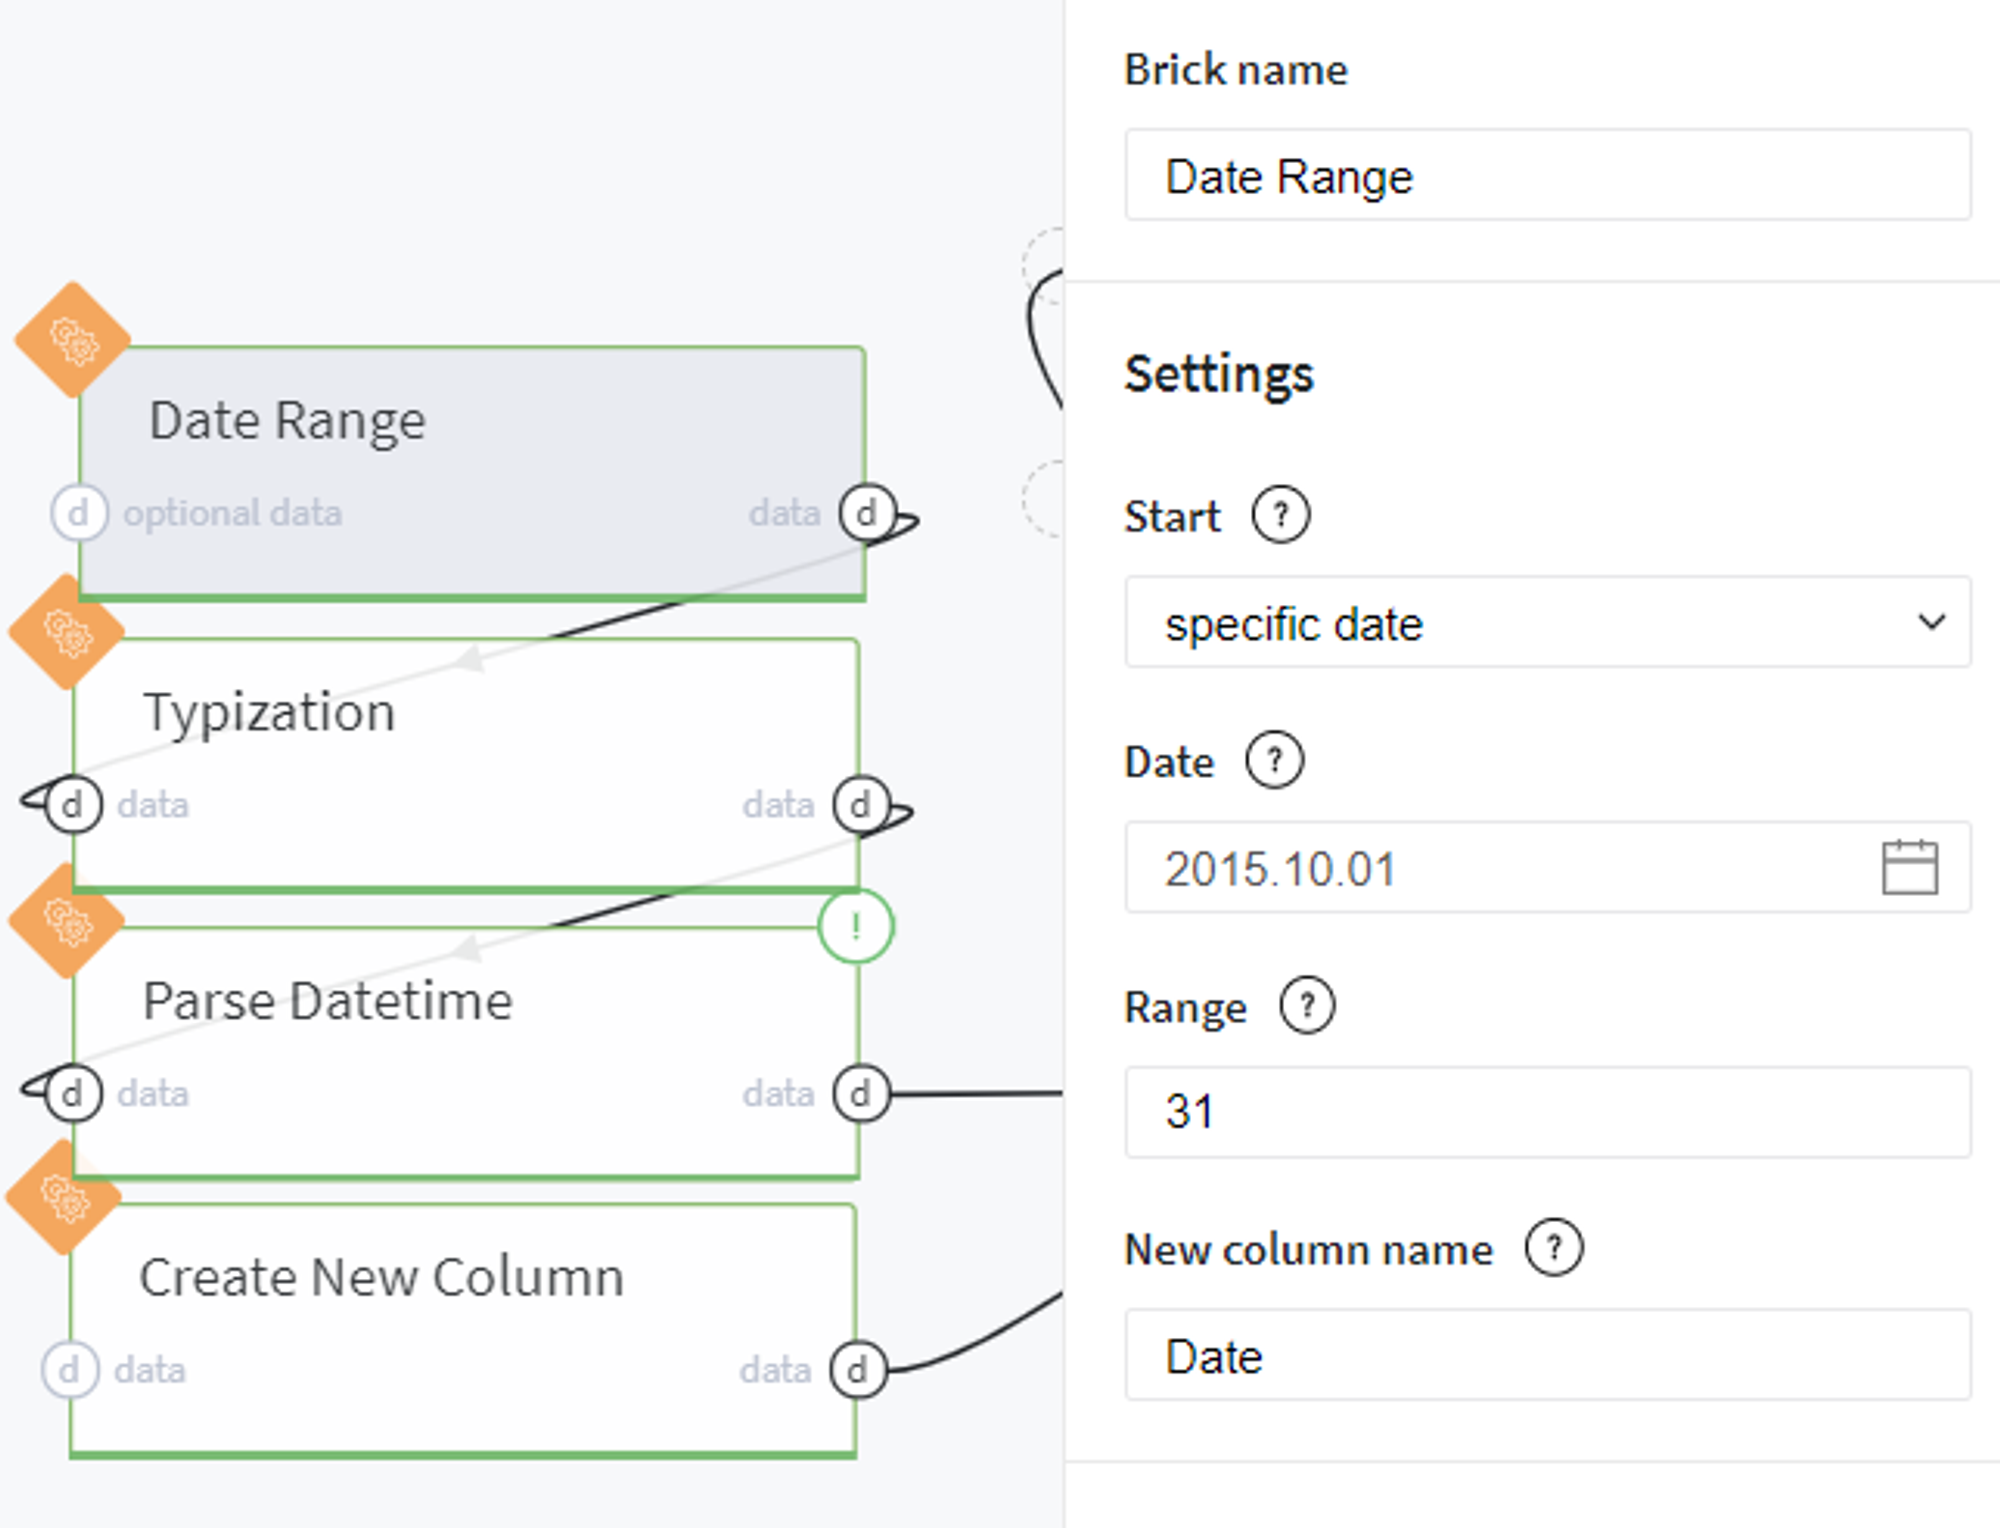
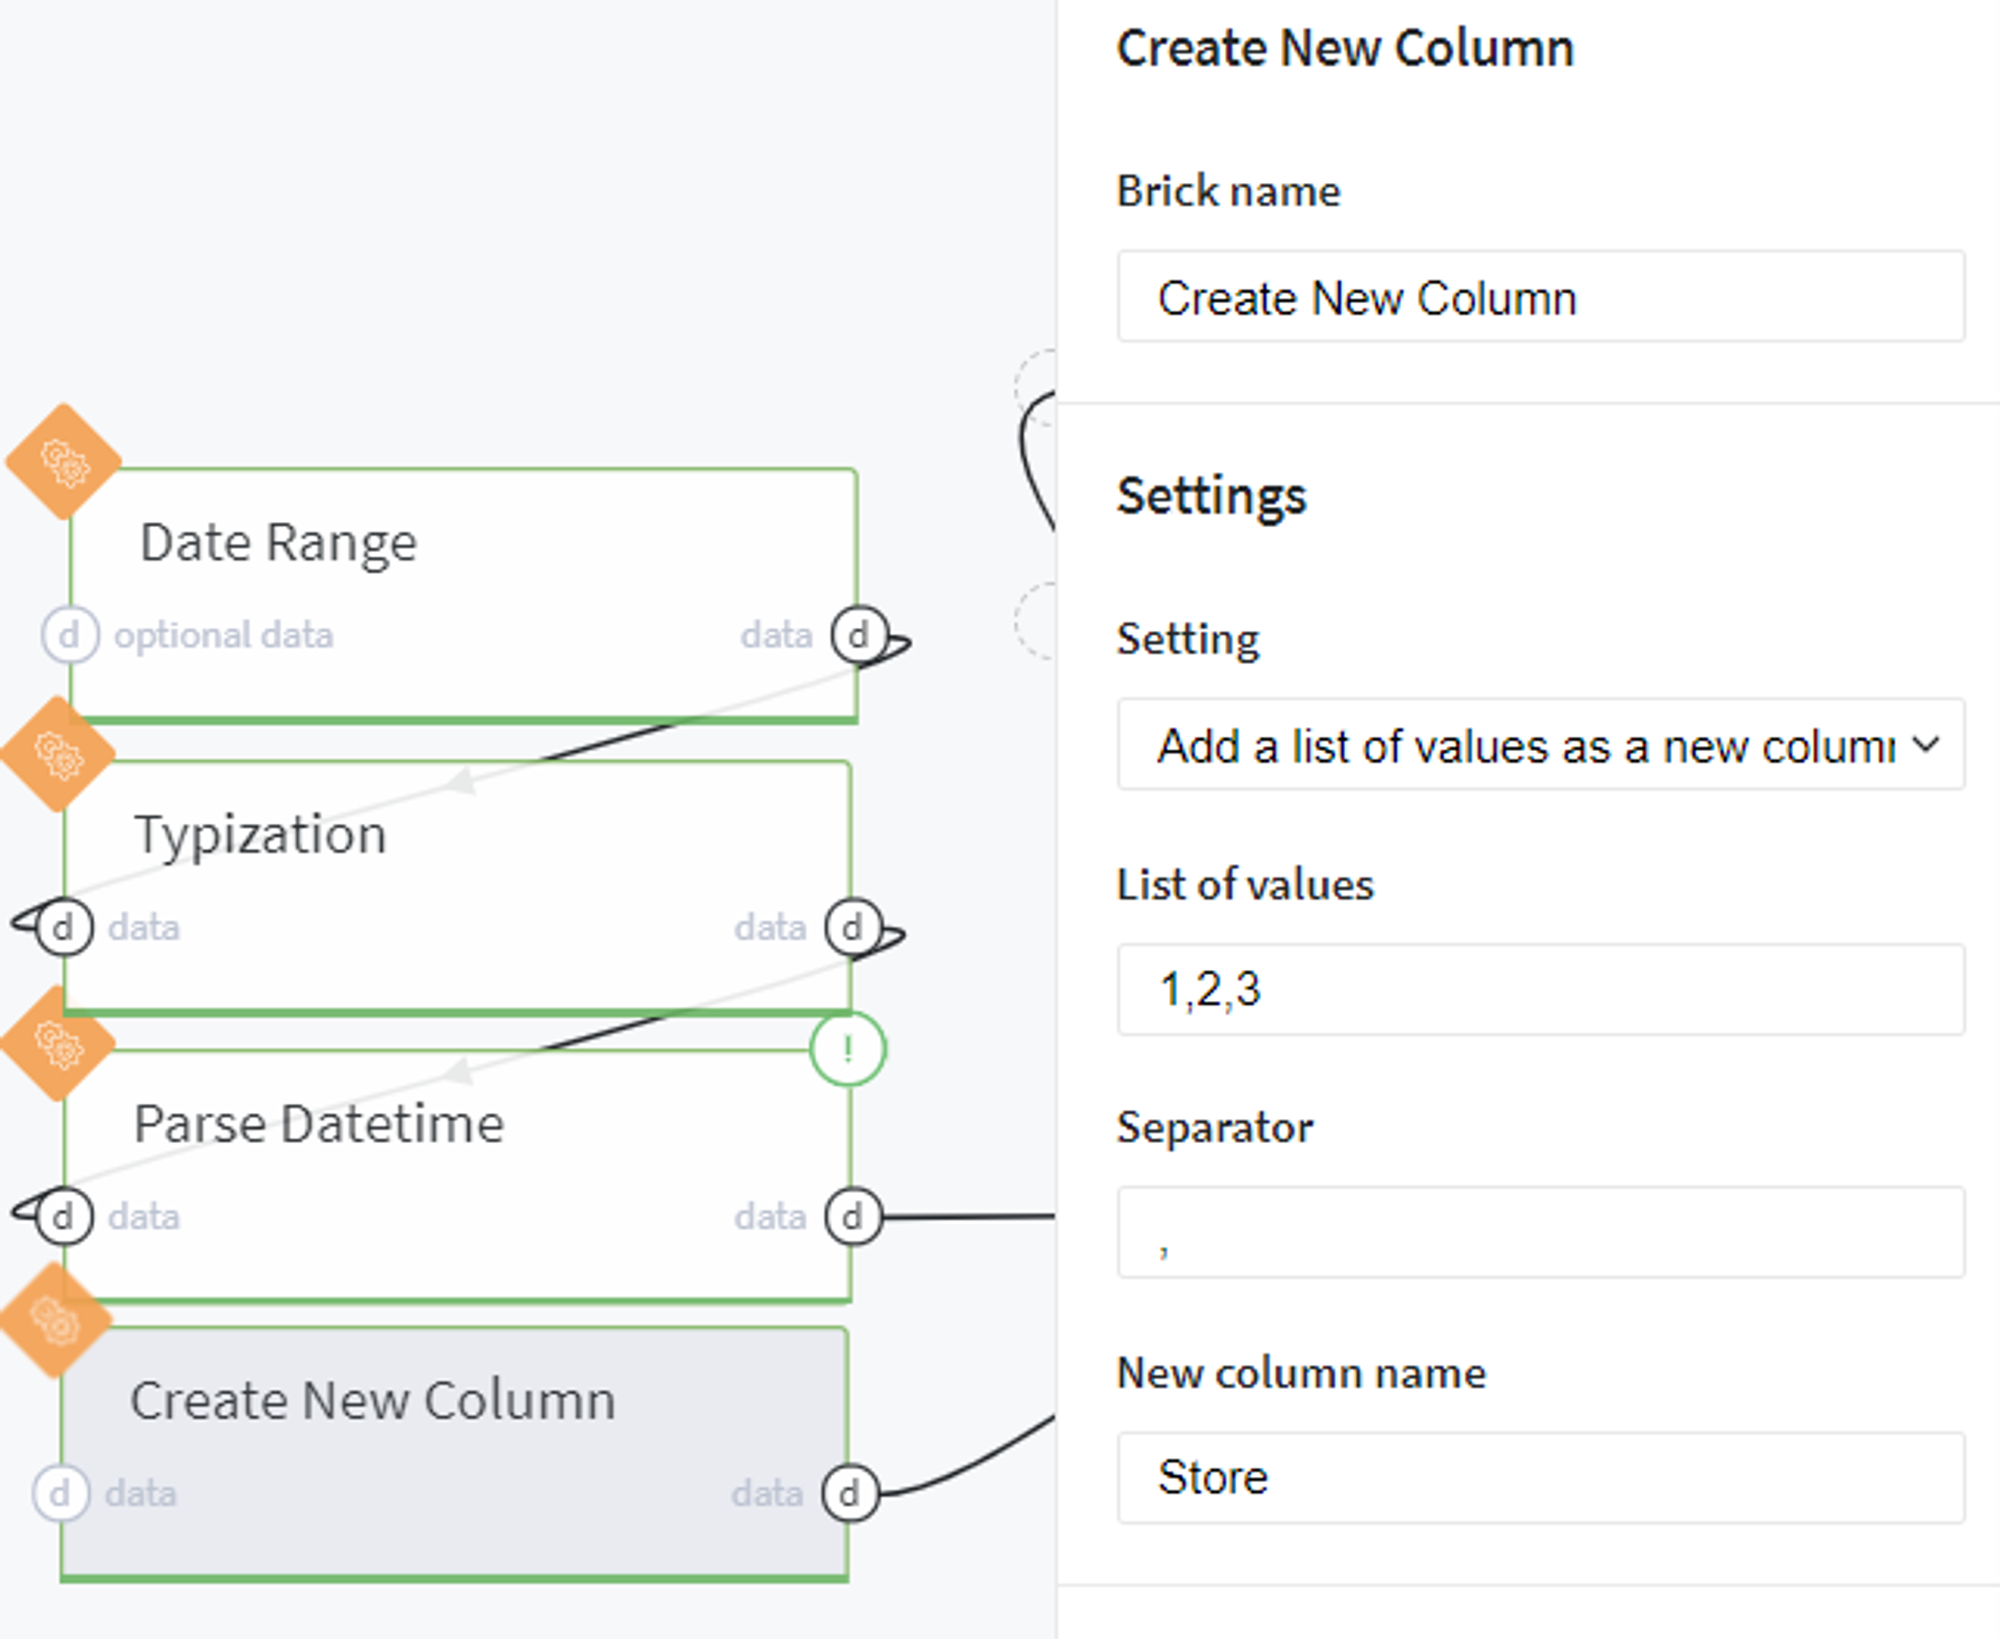
This step is merged into Generate new dataset pipeline brick, which can be expanded with mouse double-click into the following pipeline:
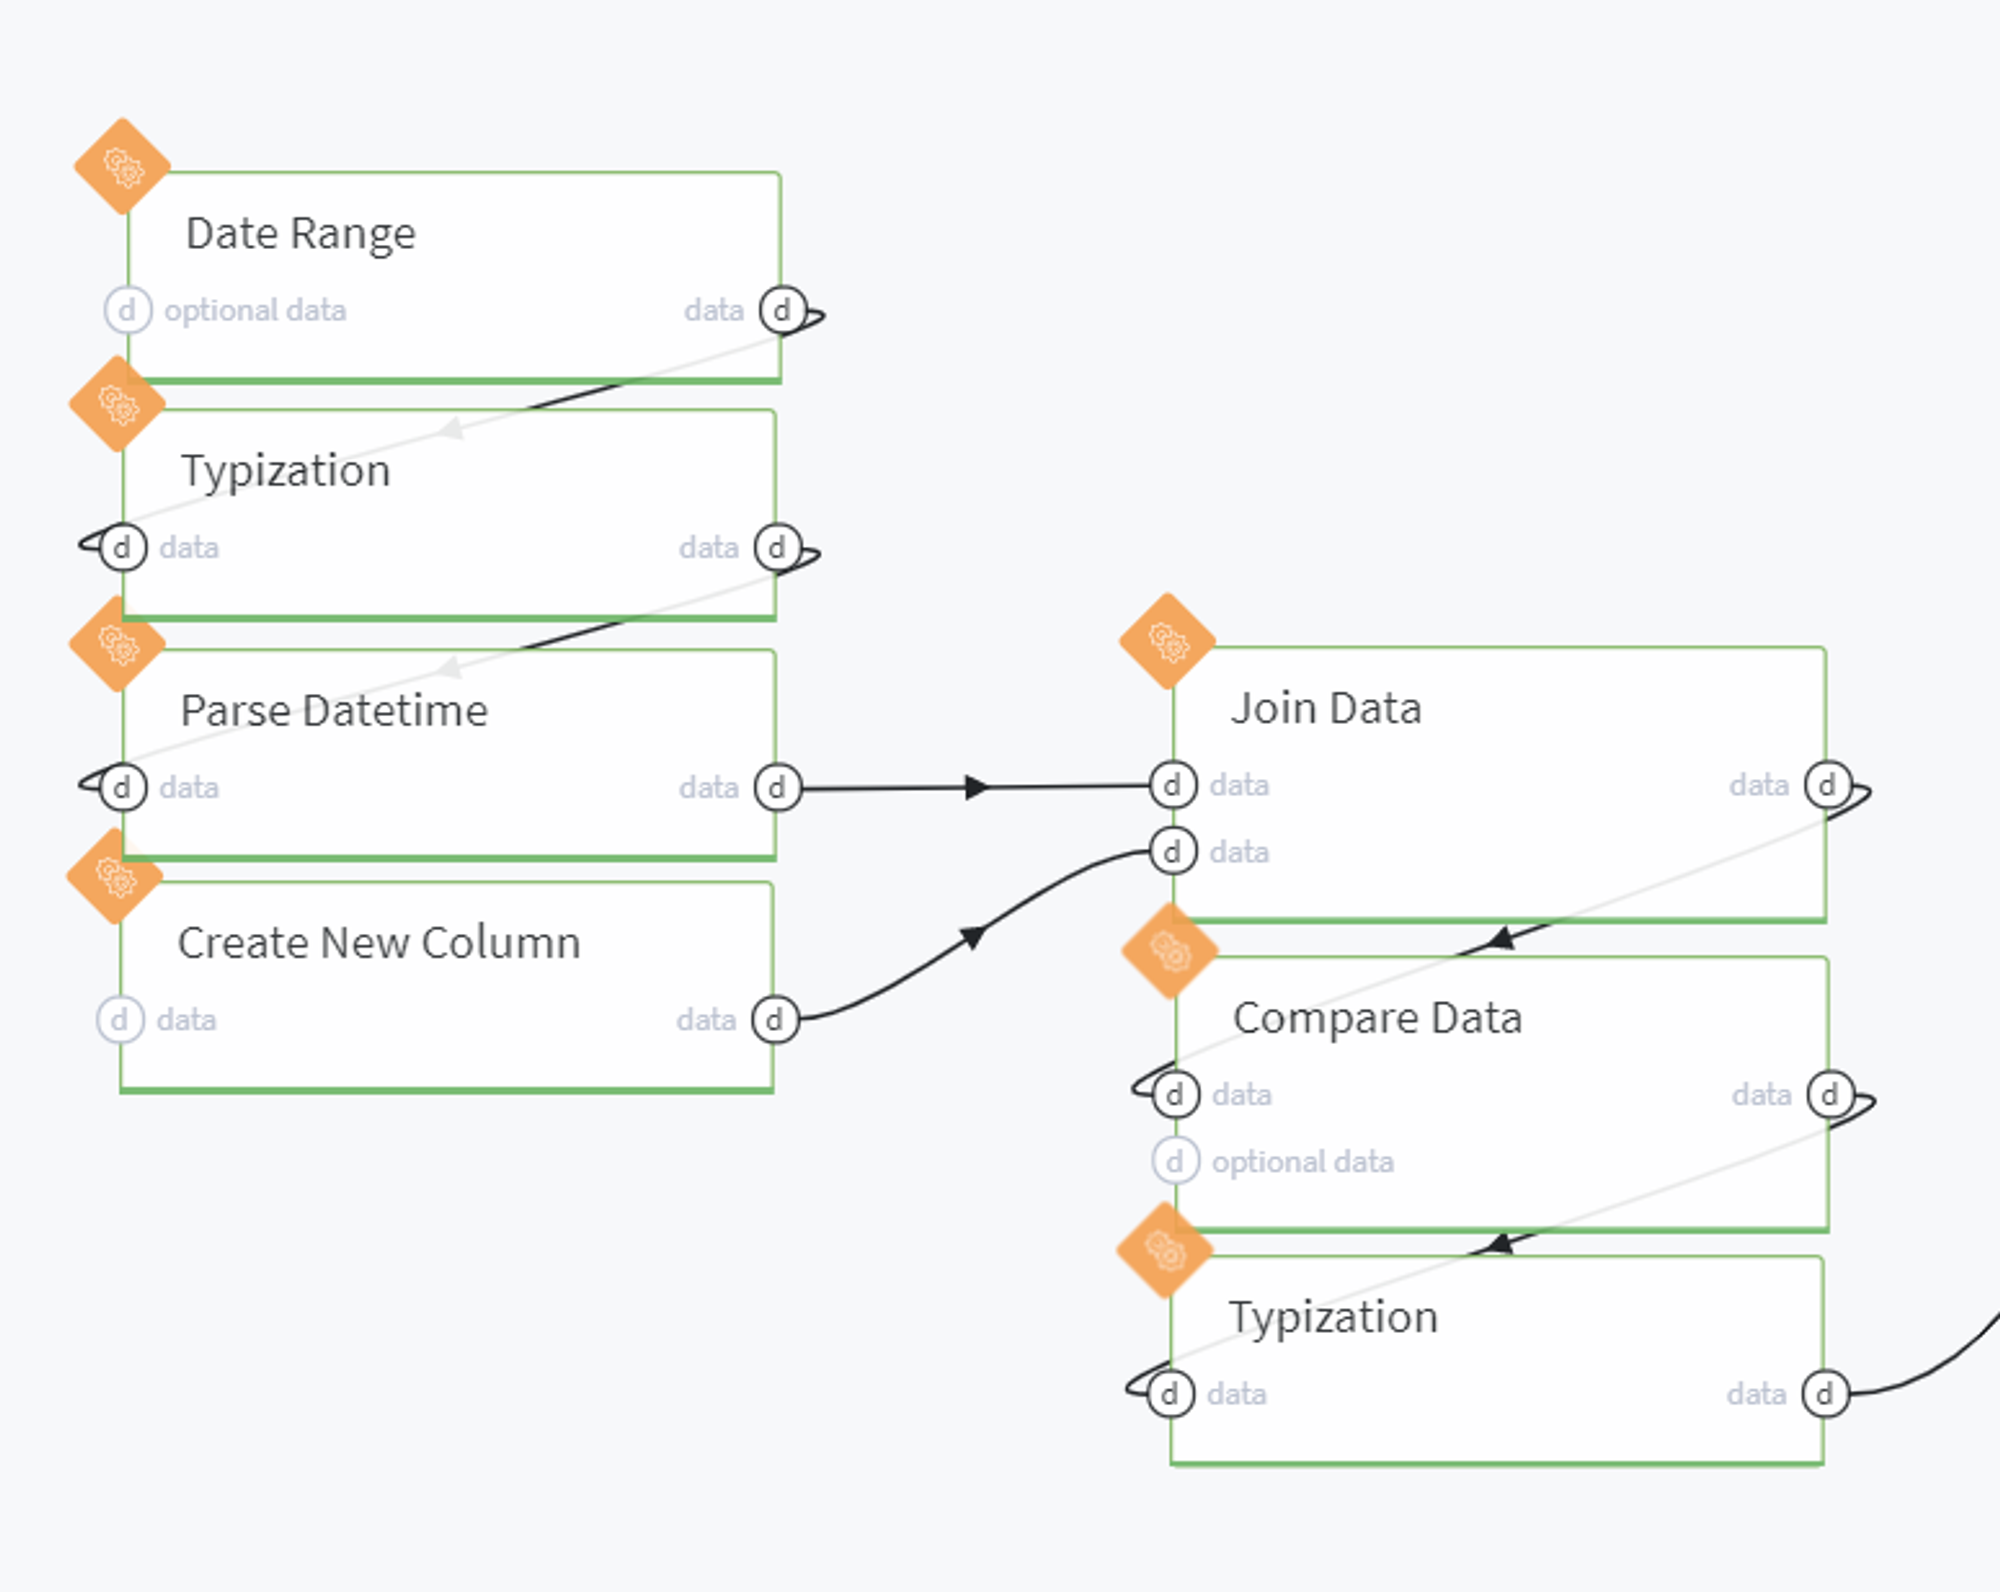
Here we generate a one-column dataset with dates that cover the proposed month:
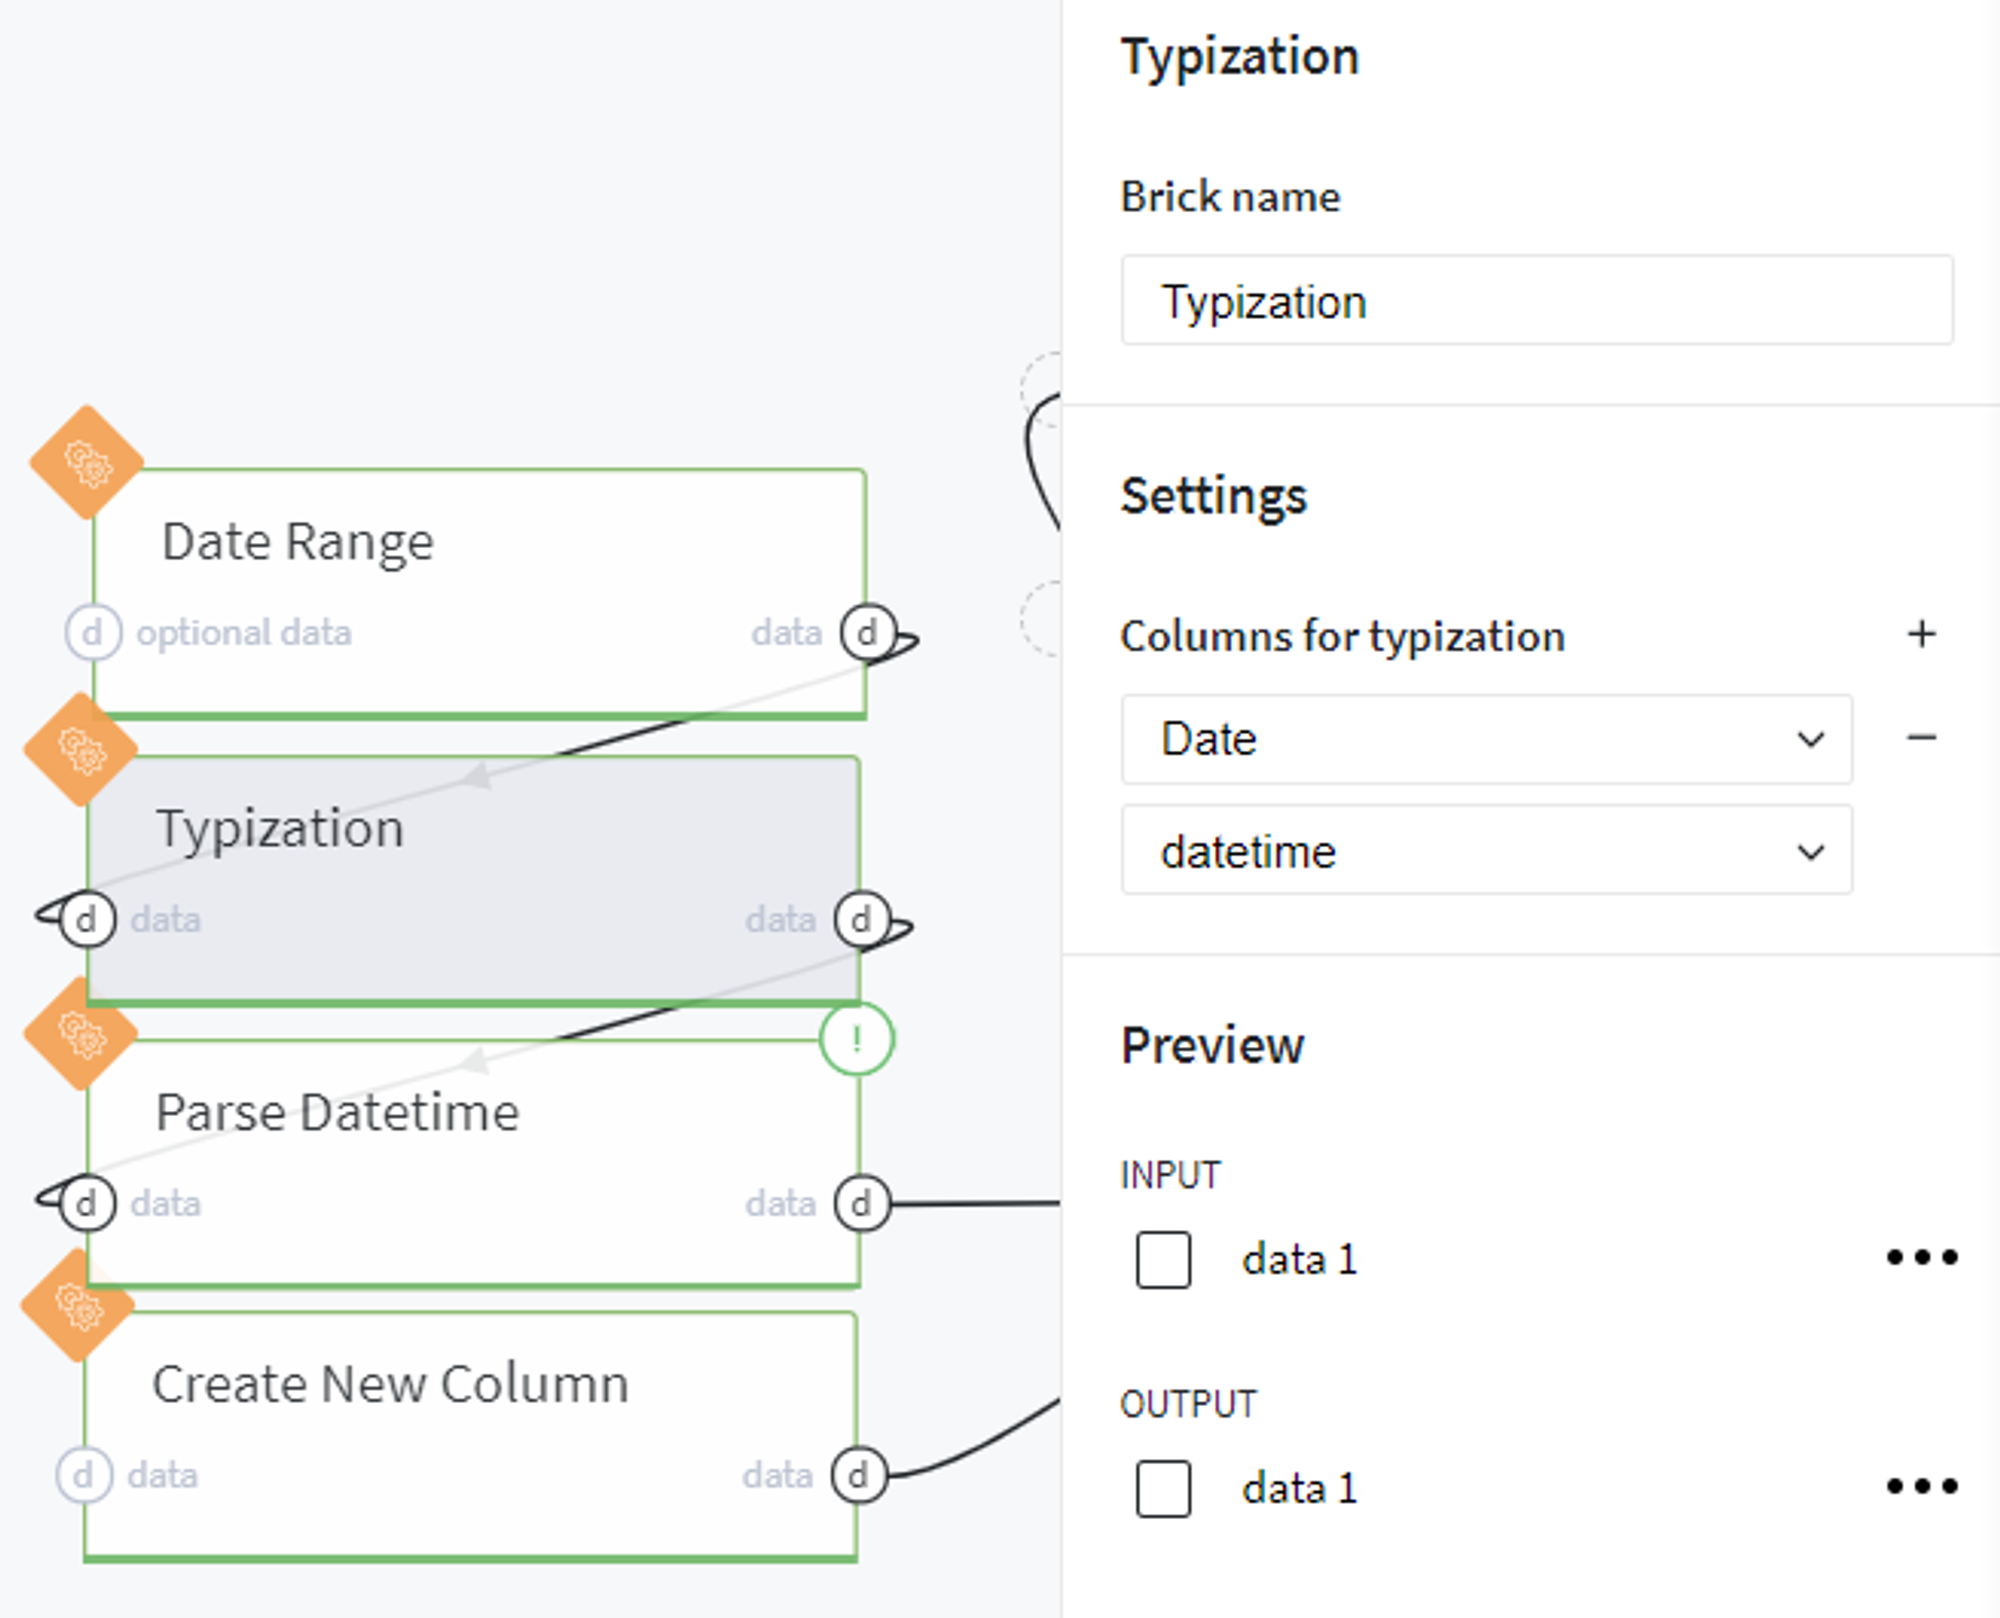
Then we set the DateTime type for the created column:
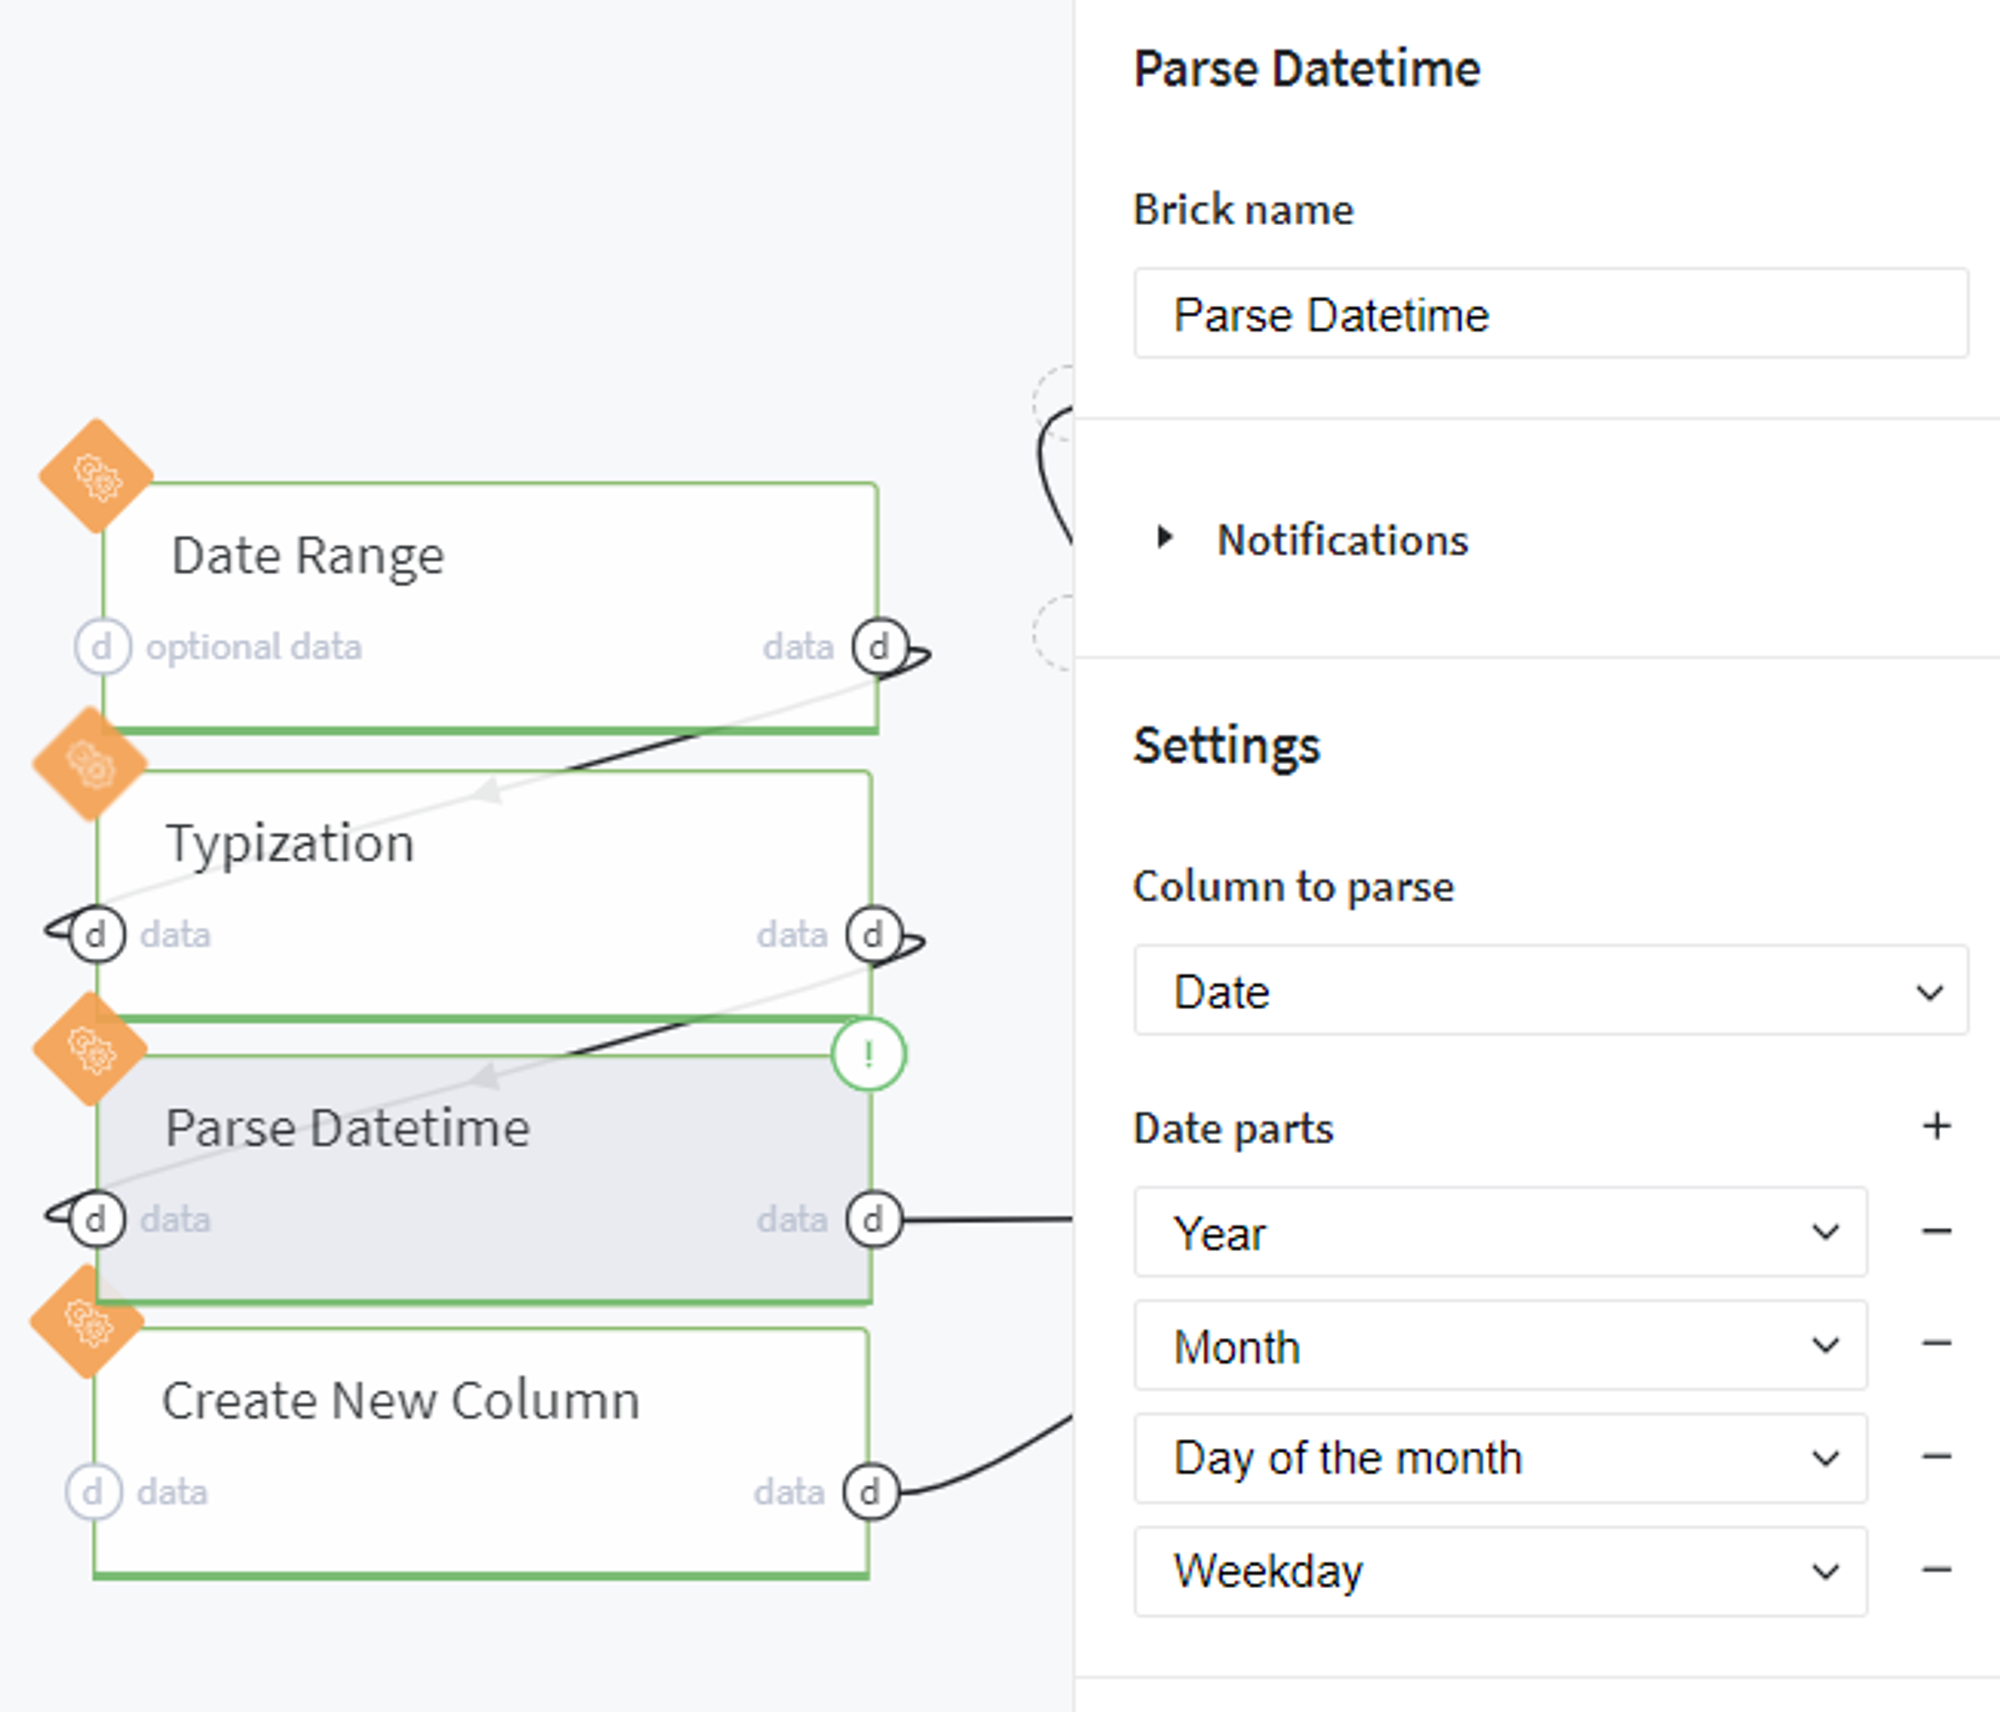
And extract the date parts that are used for the LGBM Regressor model:
After that we create an additional column that includes the IDs of the stores which were presented in our initial dataset and for which we are going to predict the sales:
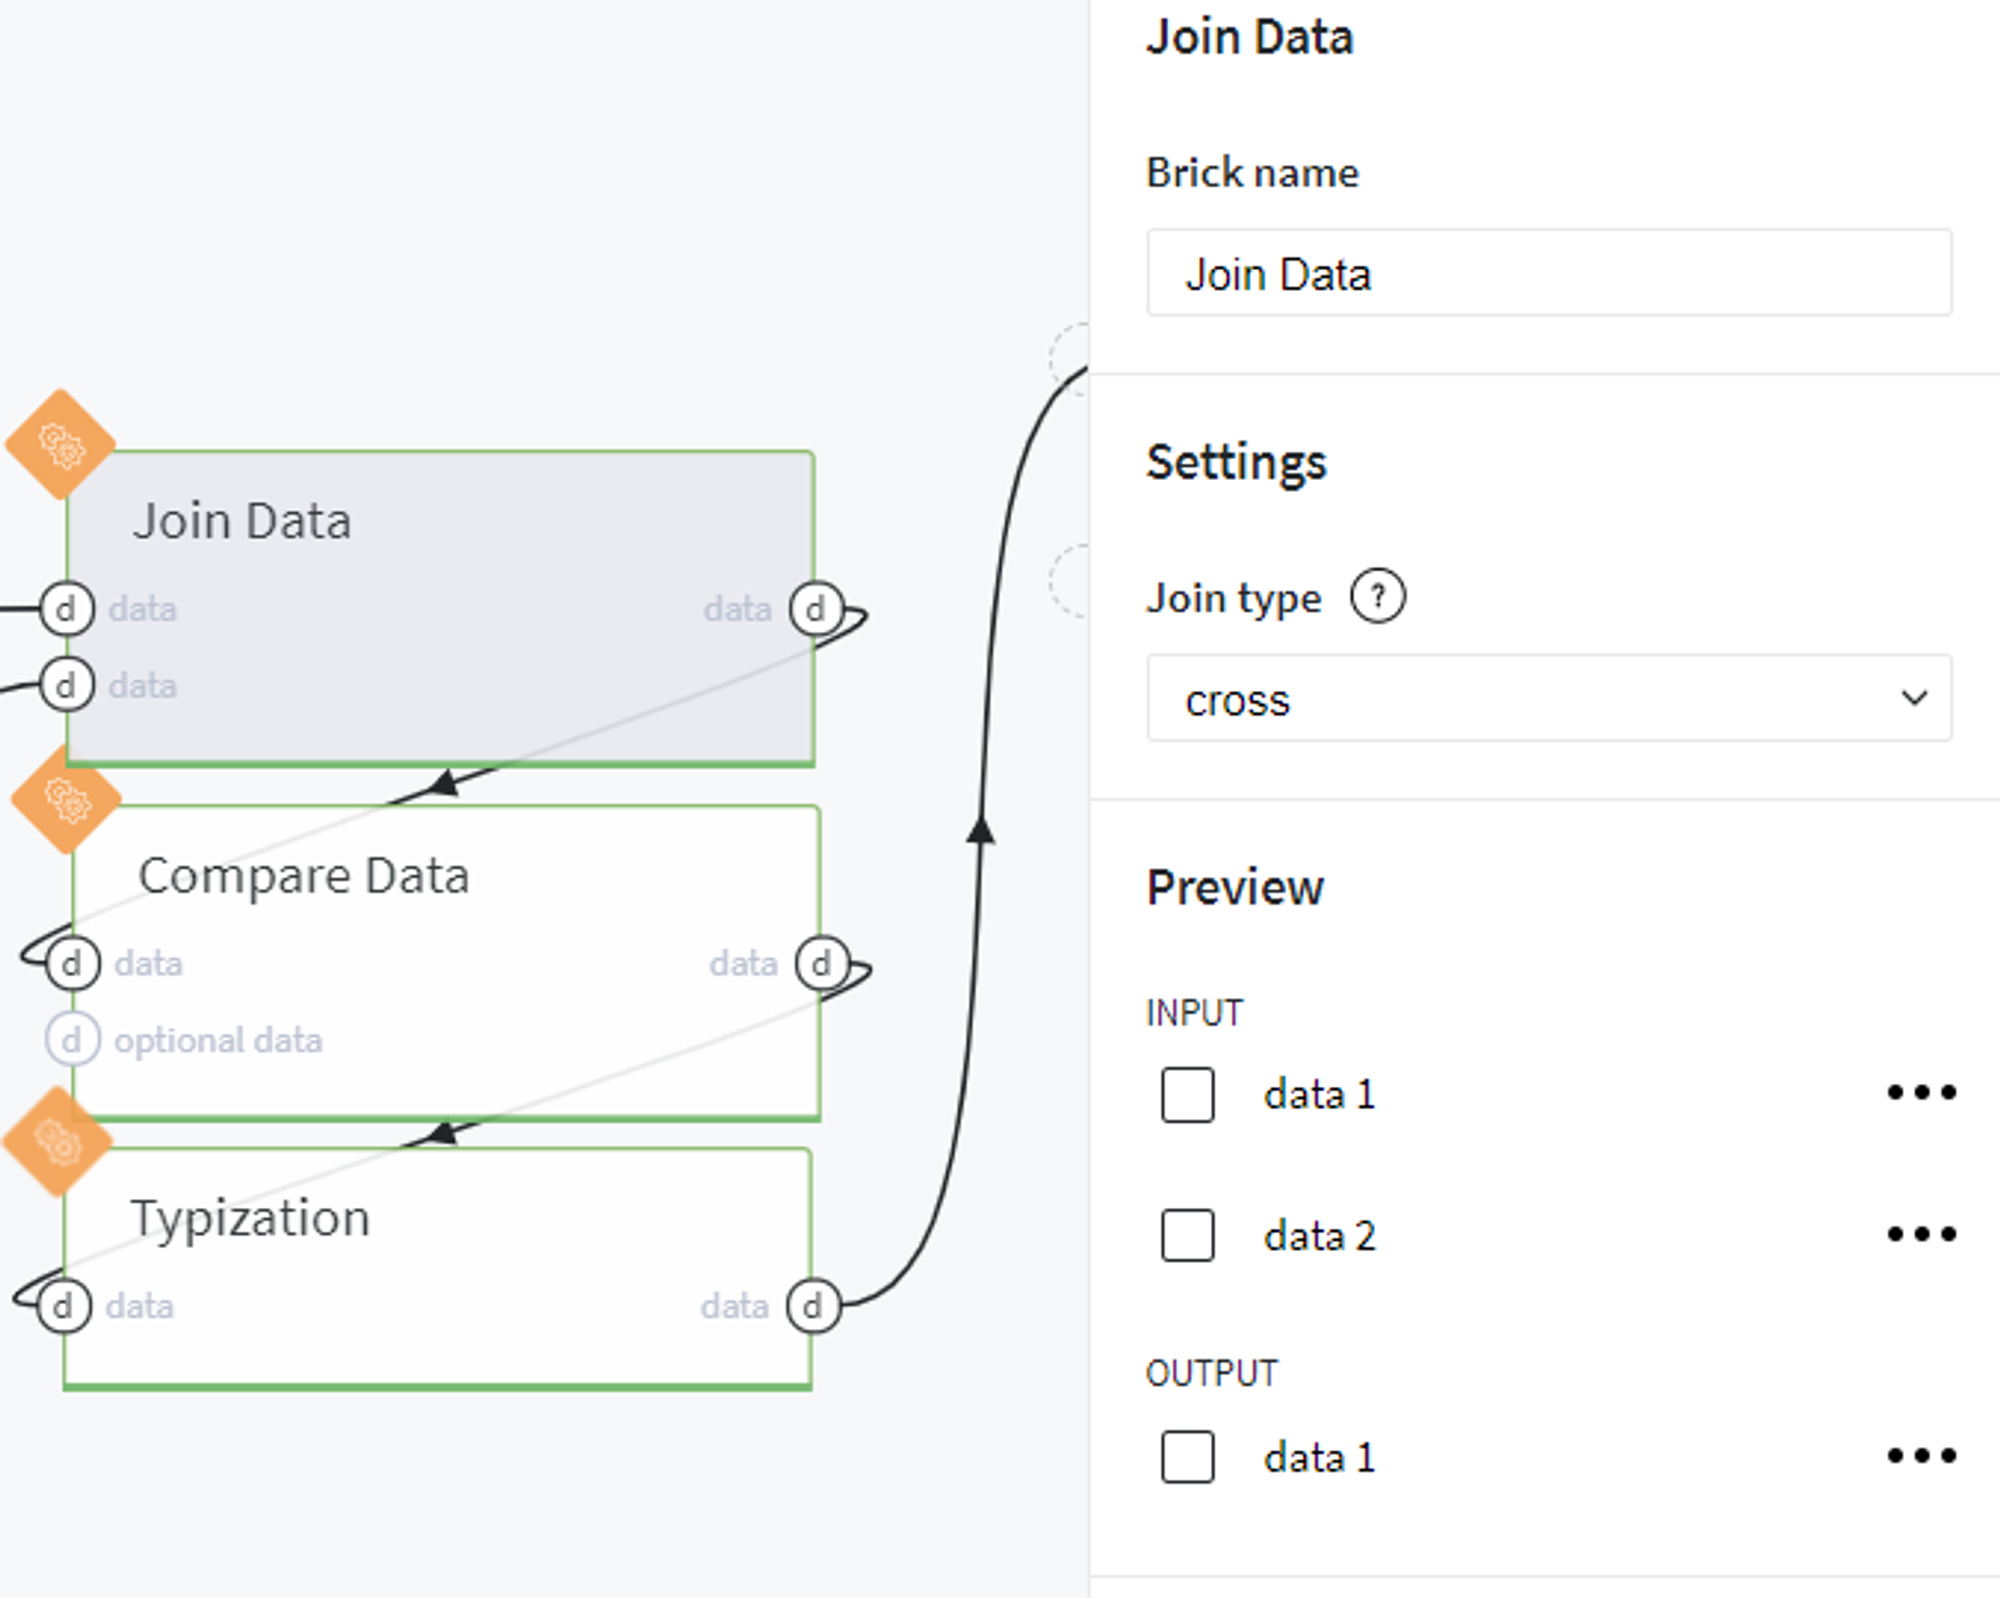
And cross join the column with dates and stores in one dataframe:
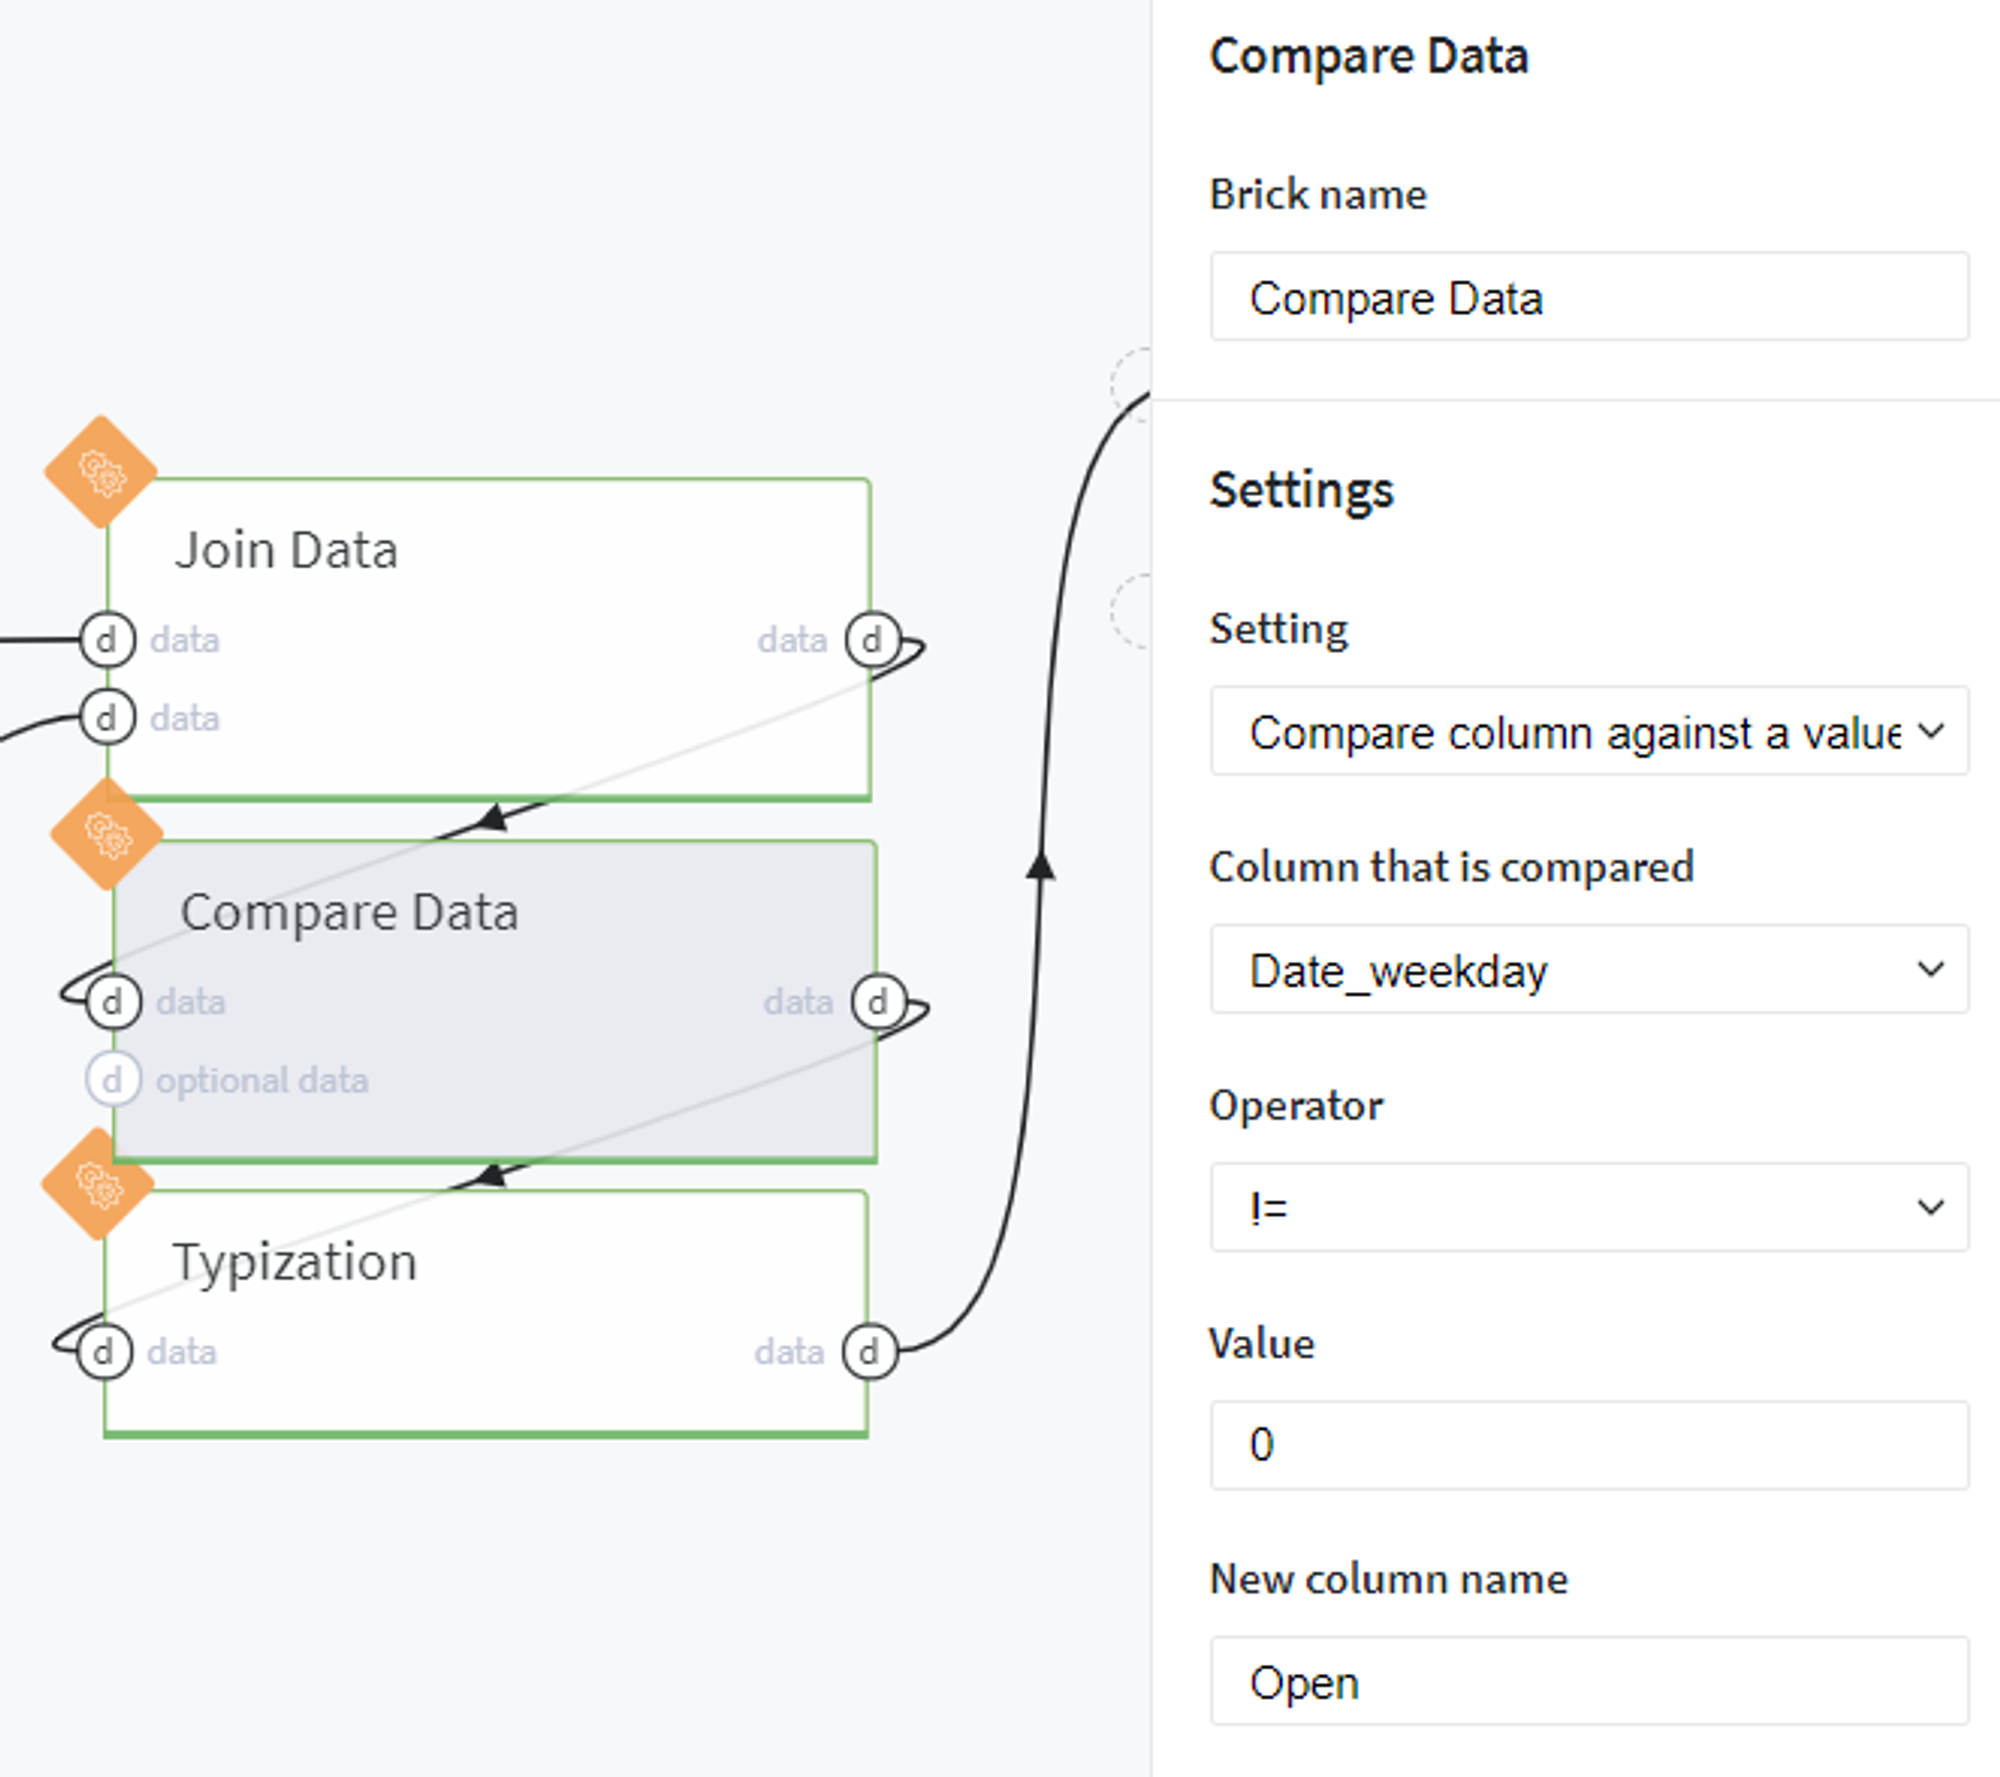
Then we assign the working days for the stores assuming that they are closed on Sunday:
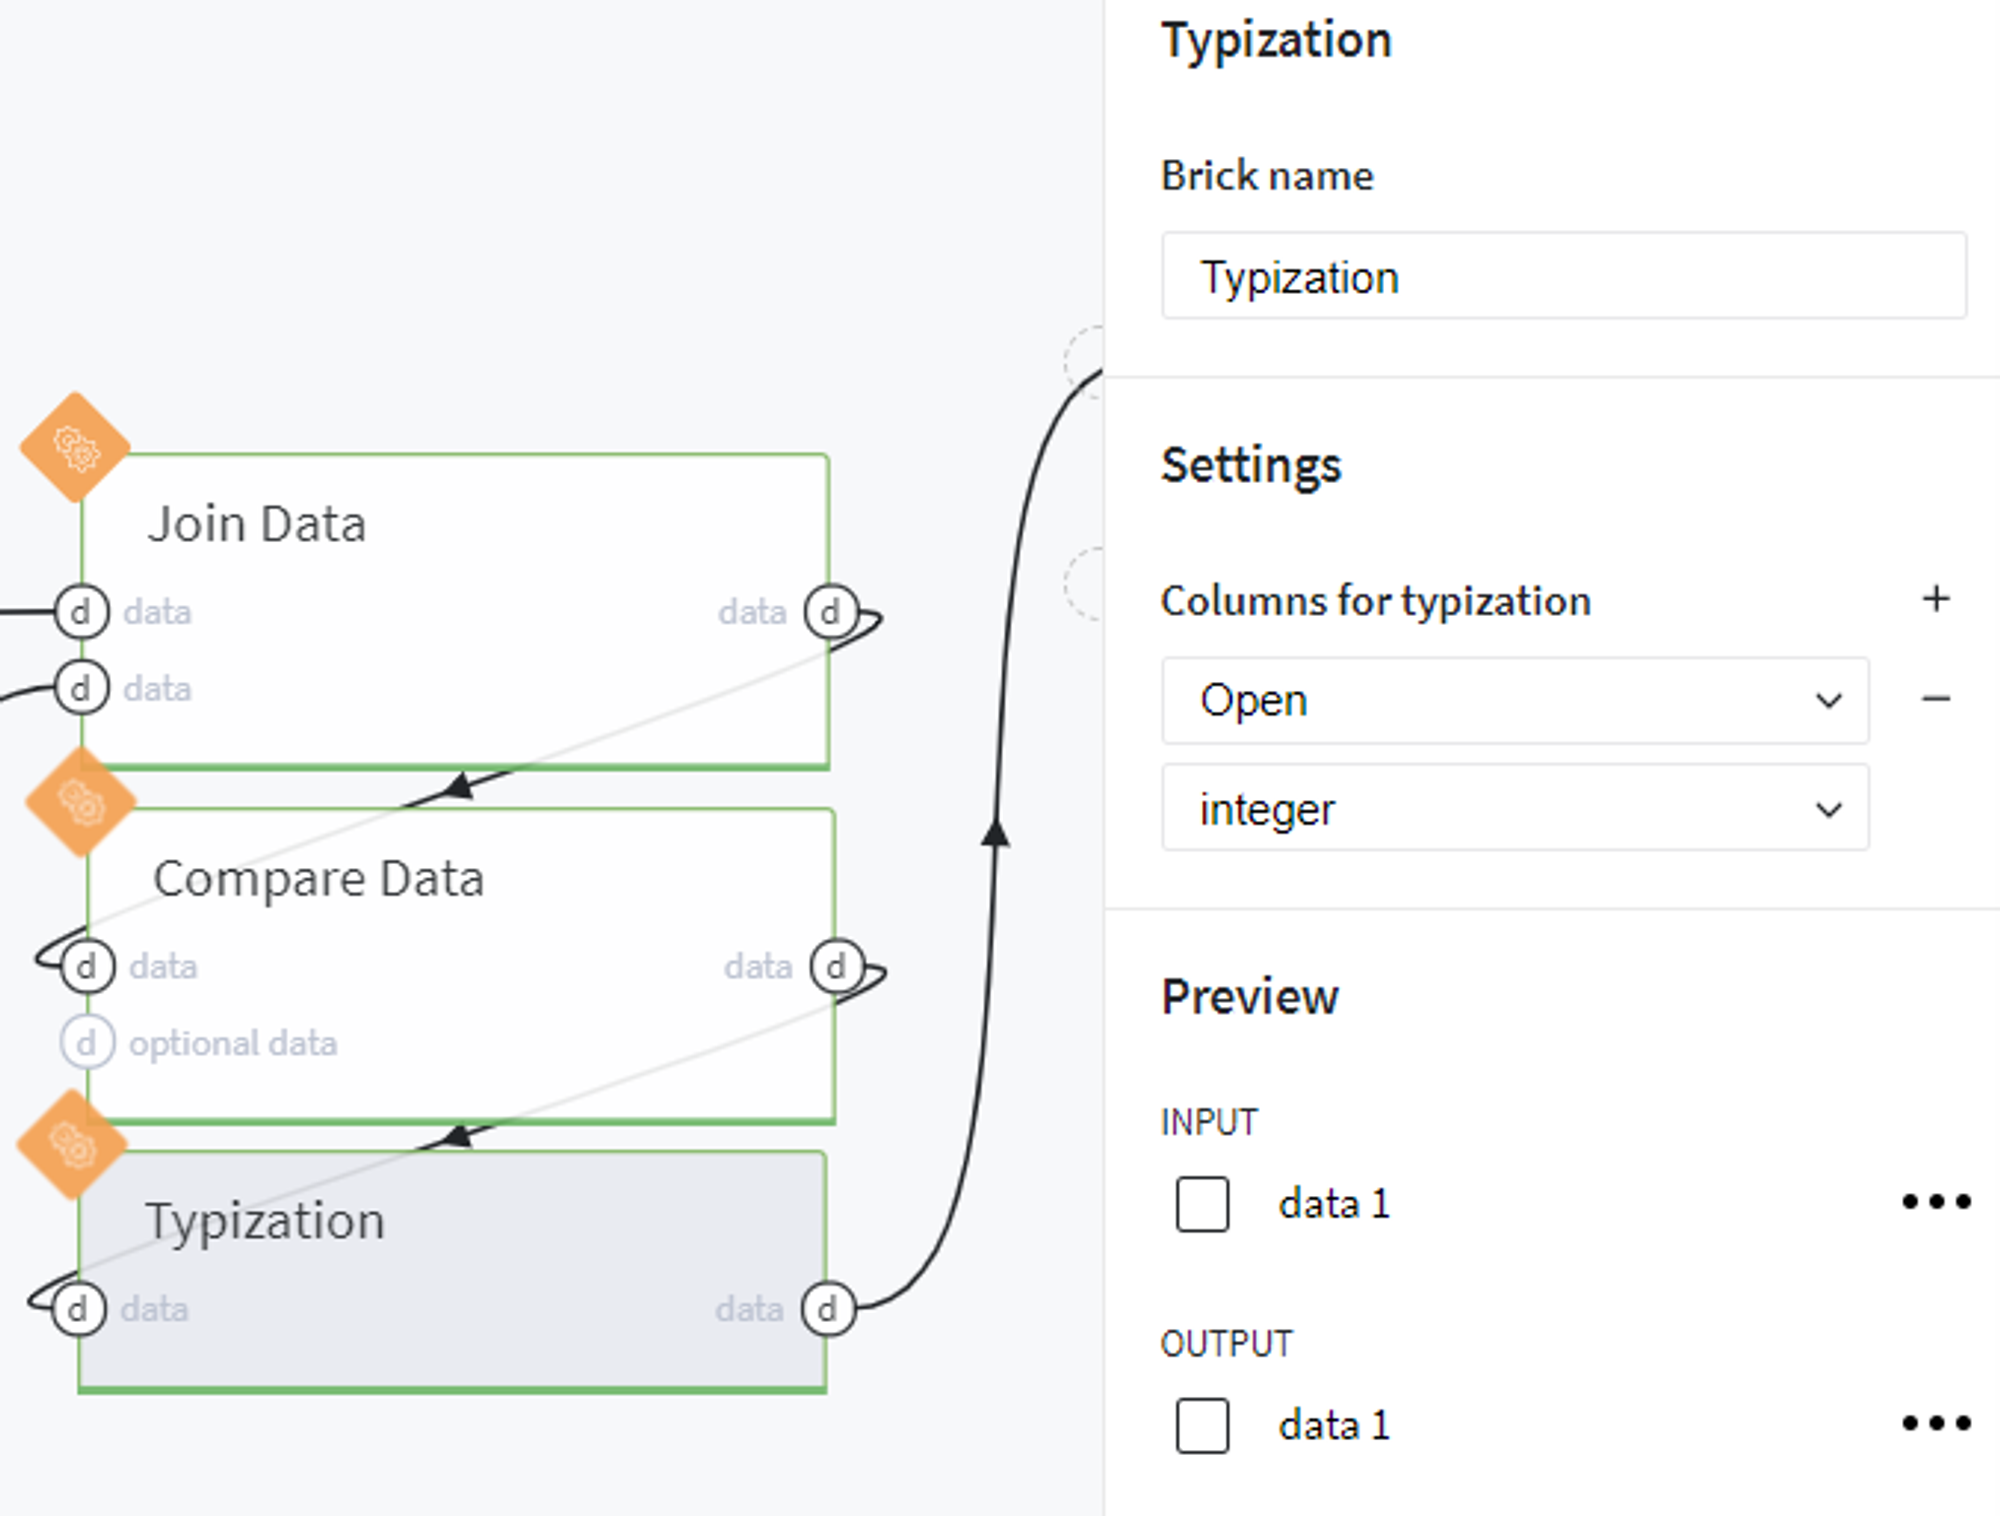
And transform the created column to integer type:
From that, we obtained the ready dataset for prediction with the LGBM Regressor model using the Predict brick.
The results of this prediction can be reviewed in the output data frame with the column predicted_Sales or explored visually using Predictive Dashboard: