Credit scoring represents an evaluation of the bank's customer creditworthiness - how well they can and are willing to pay off their debt. According to the statistics, less than one-half of the banked population is regarded as eligible for lending. That's why the need for smarter credit scoring solutions is evident.
AI credit scoring decisions are based on a lot of data, such as total income, credit history, transaction analysis, work experience, etc. In essence, scoring represents a mathematical model based on statistical methods and accounting for lots of information. As a result, credit scoring using AI provides more sensitive, individualized credit score assessments based on an array of additional real-time factors, giving access to finance to more people with income potential.
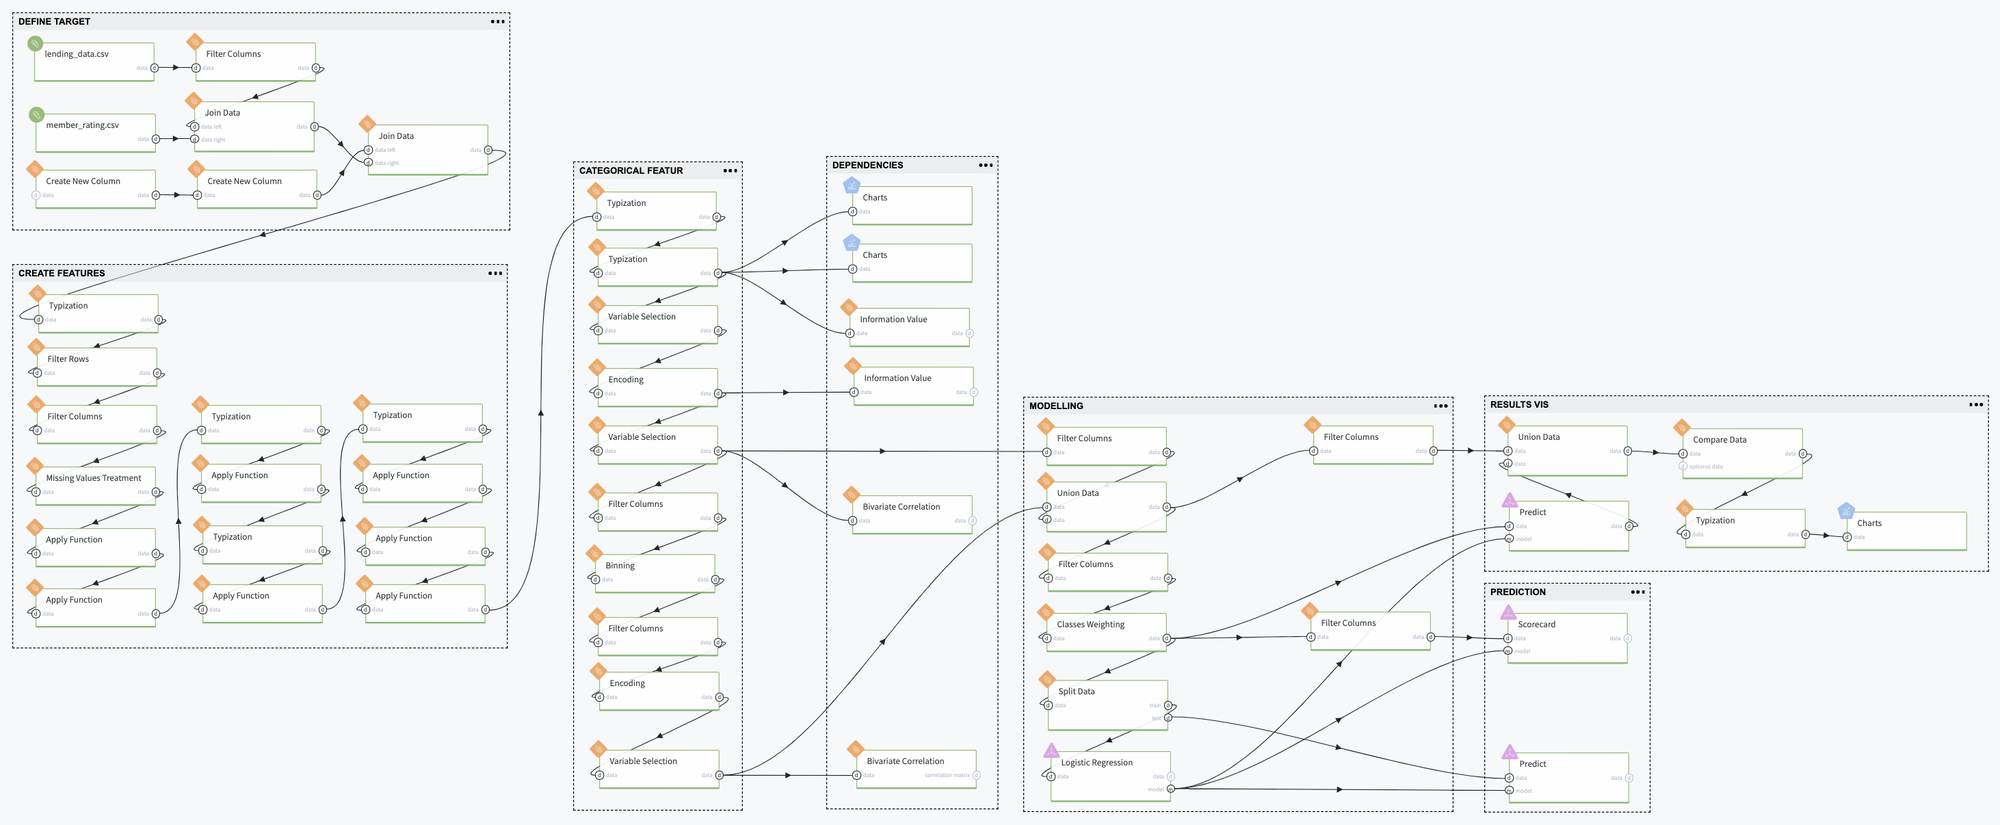
Here we demonstrate the credit scoring assessment in the Datrics platform, based on open sources' data.
Problem Statement
Create the Machine Learning model to evaluate the Credit Default Risk and build the ScoreCard for the new Customers' creditworthy assessment.
Dataset
A sampling of Loan Club public dataset, which contains 19894 records with bank's customer information - demographic data, financial data provided for the loan request, loan details, credit history, and the current payment status.
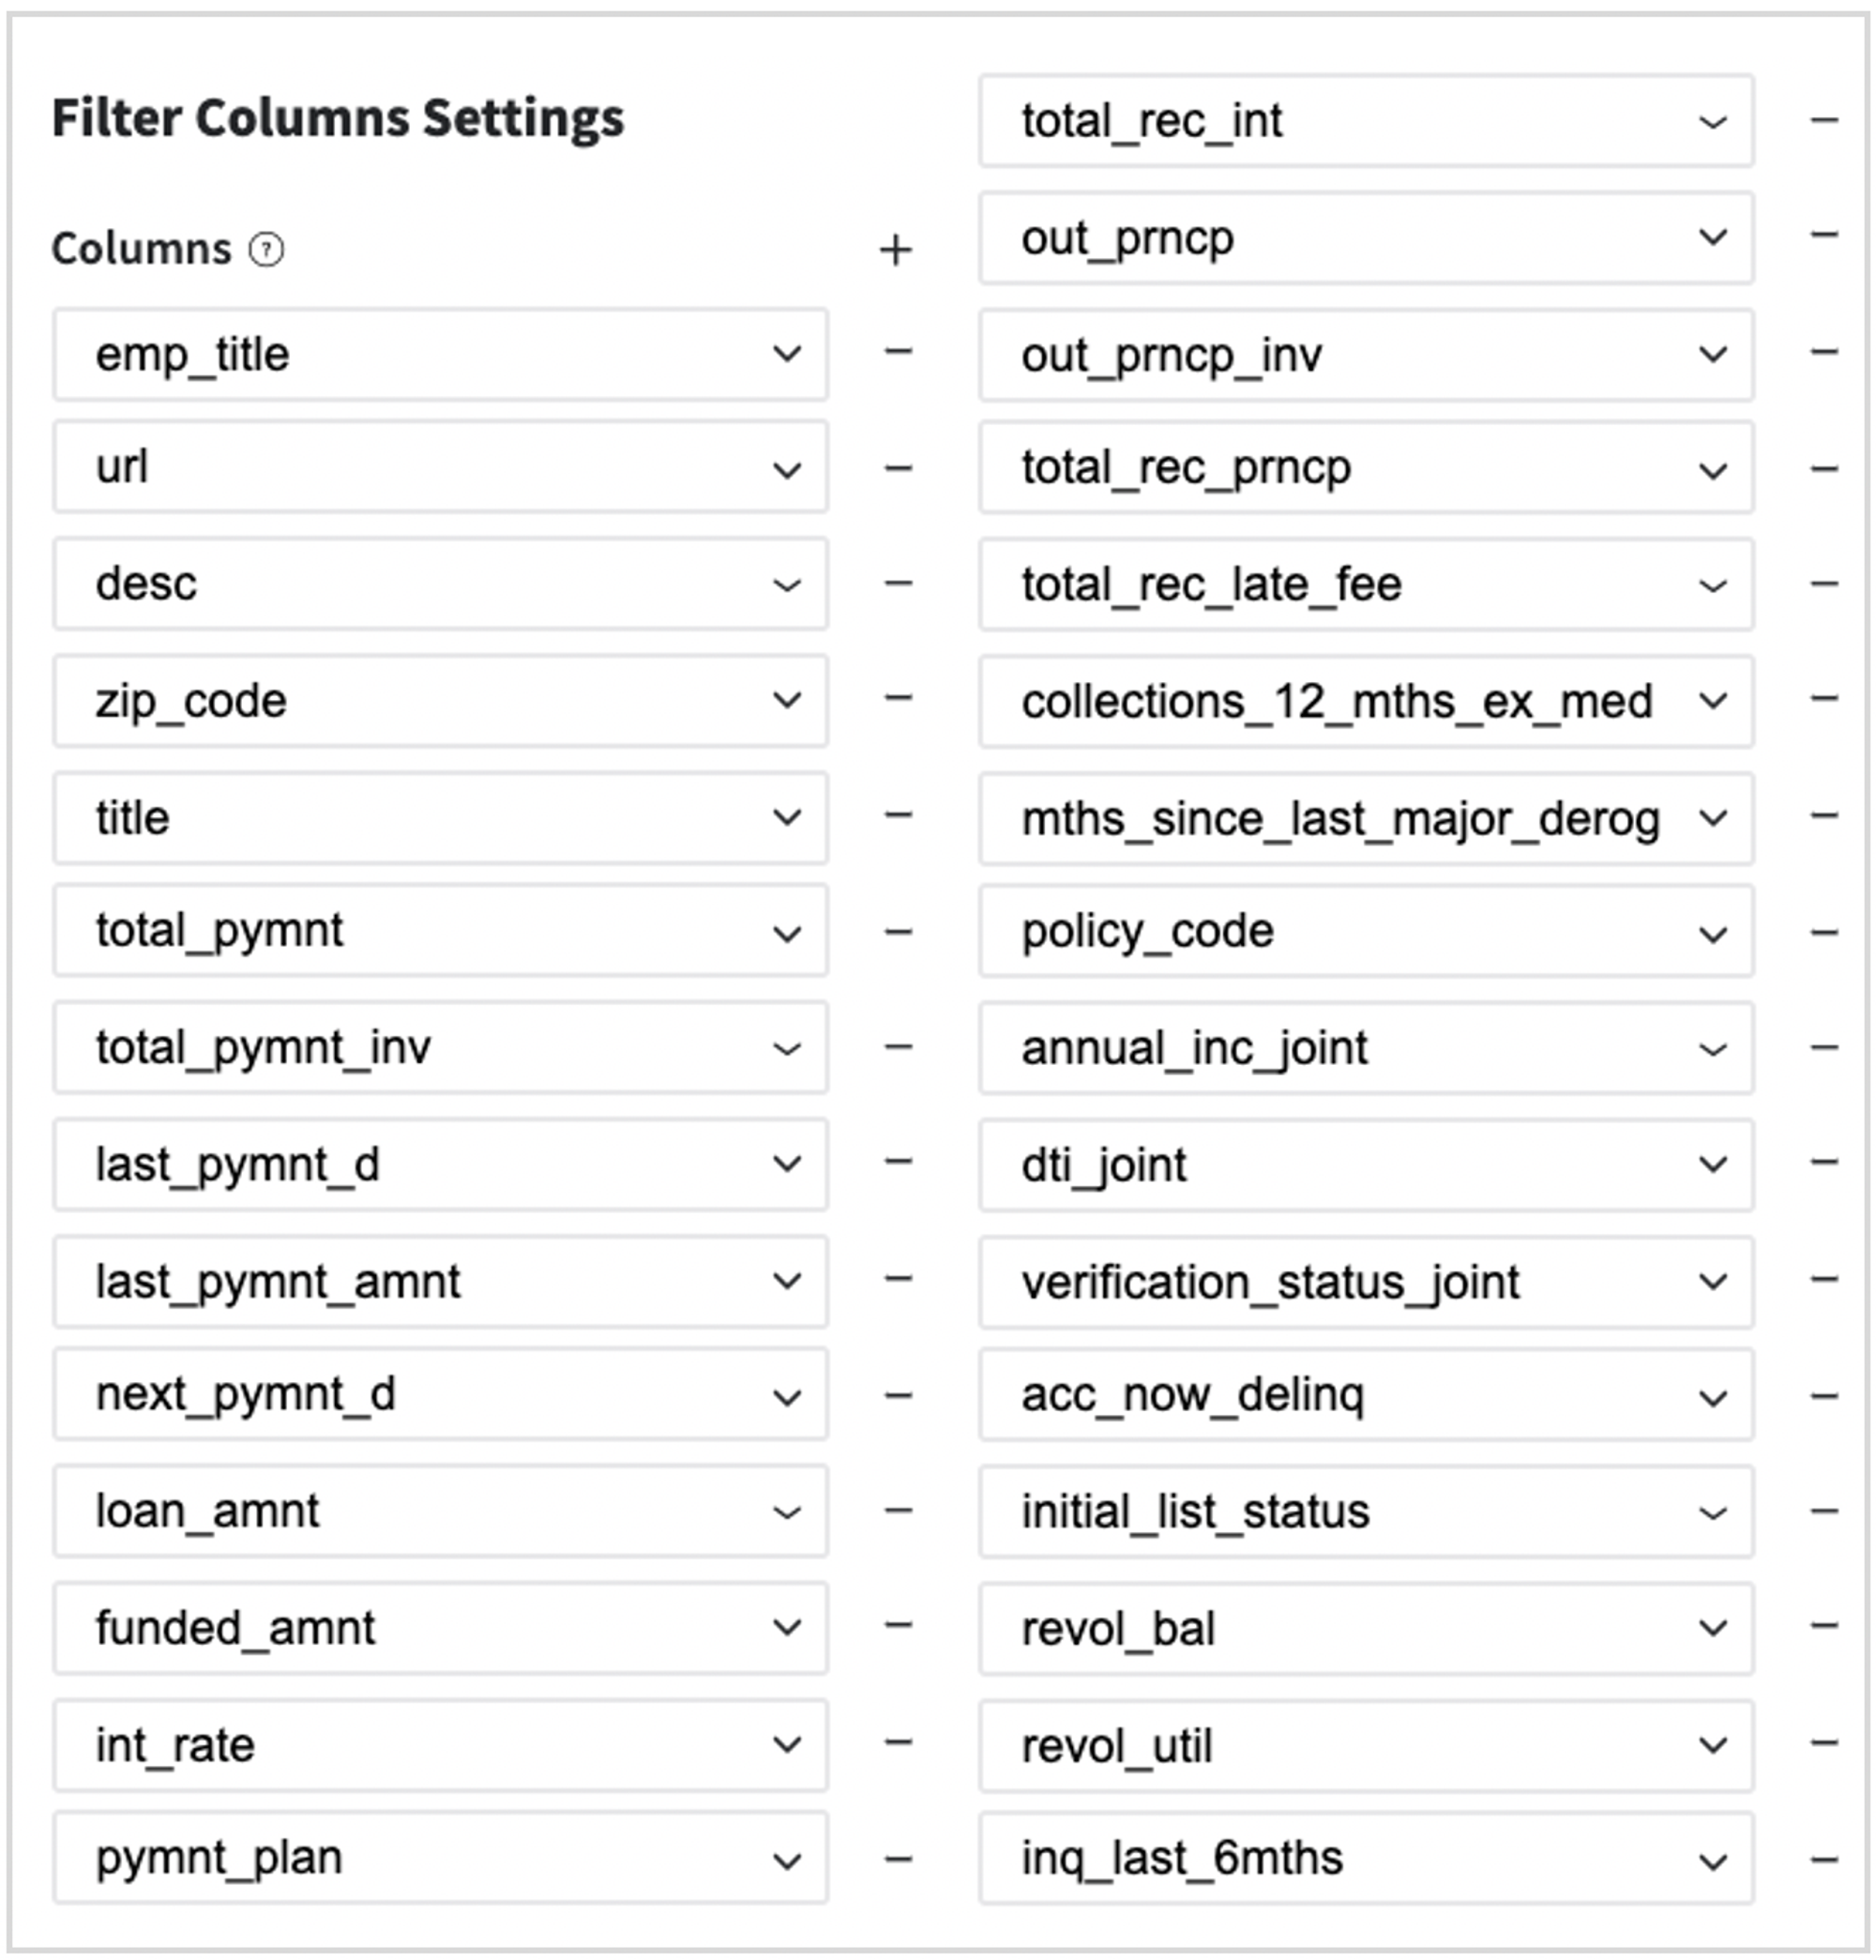
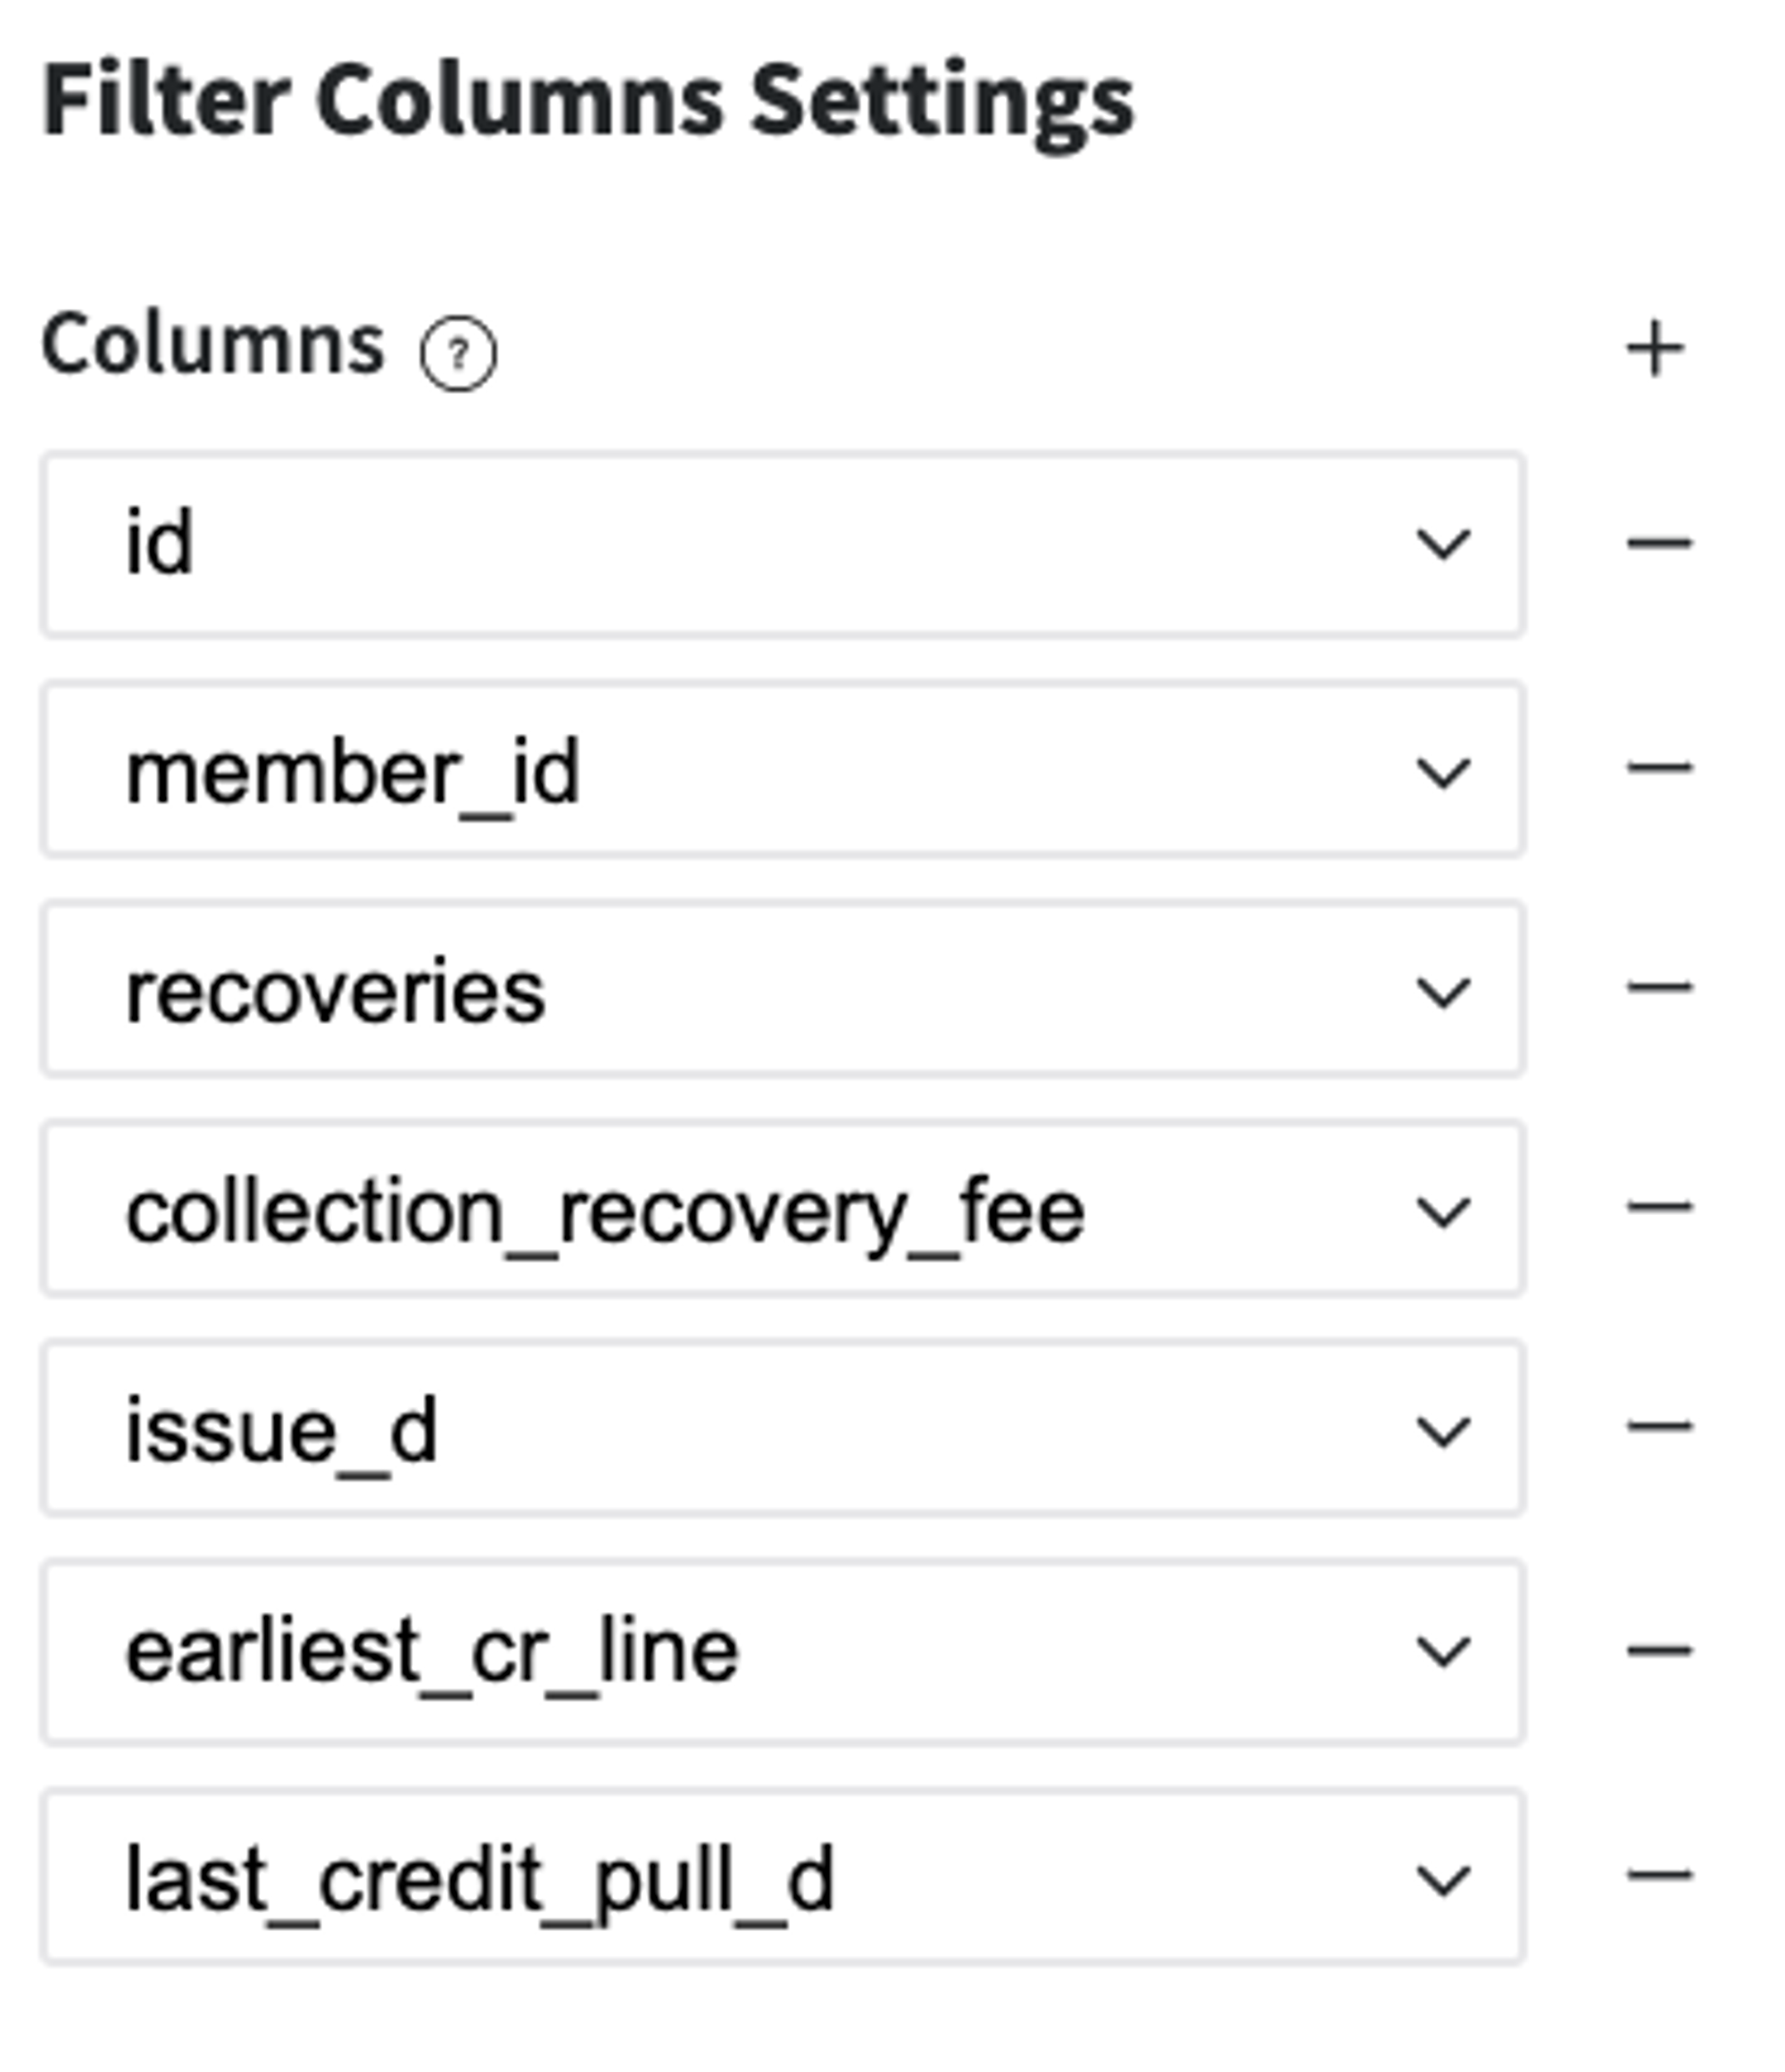
Remove forward-looking features - information that is related to the current loan's payment statistics and we do not have it before the credit providing:
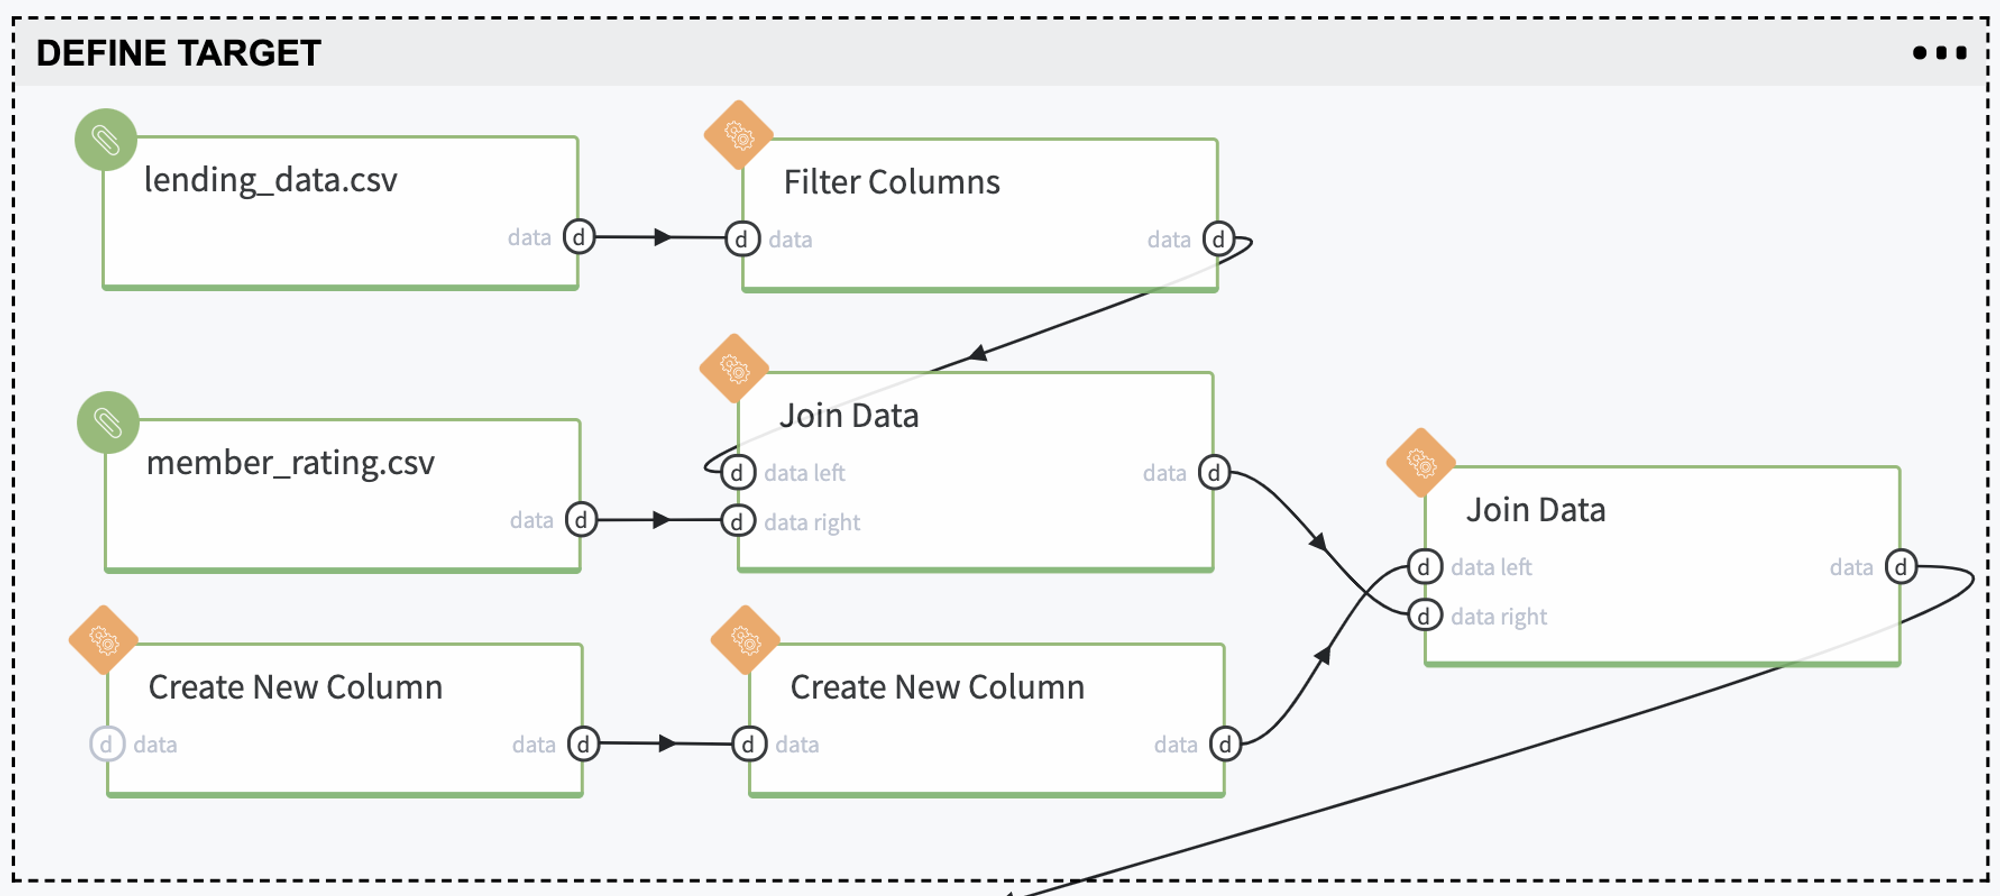
2. Upload Lending Club (lending_data.csv), including Fair Isaac Corporation scores (member_raiting.csv)
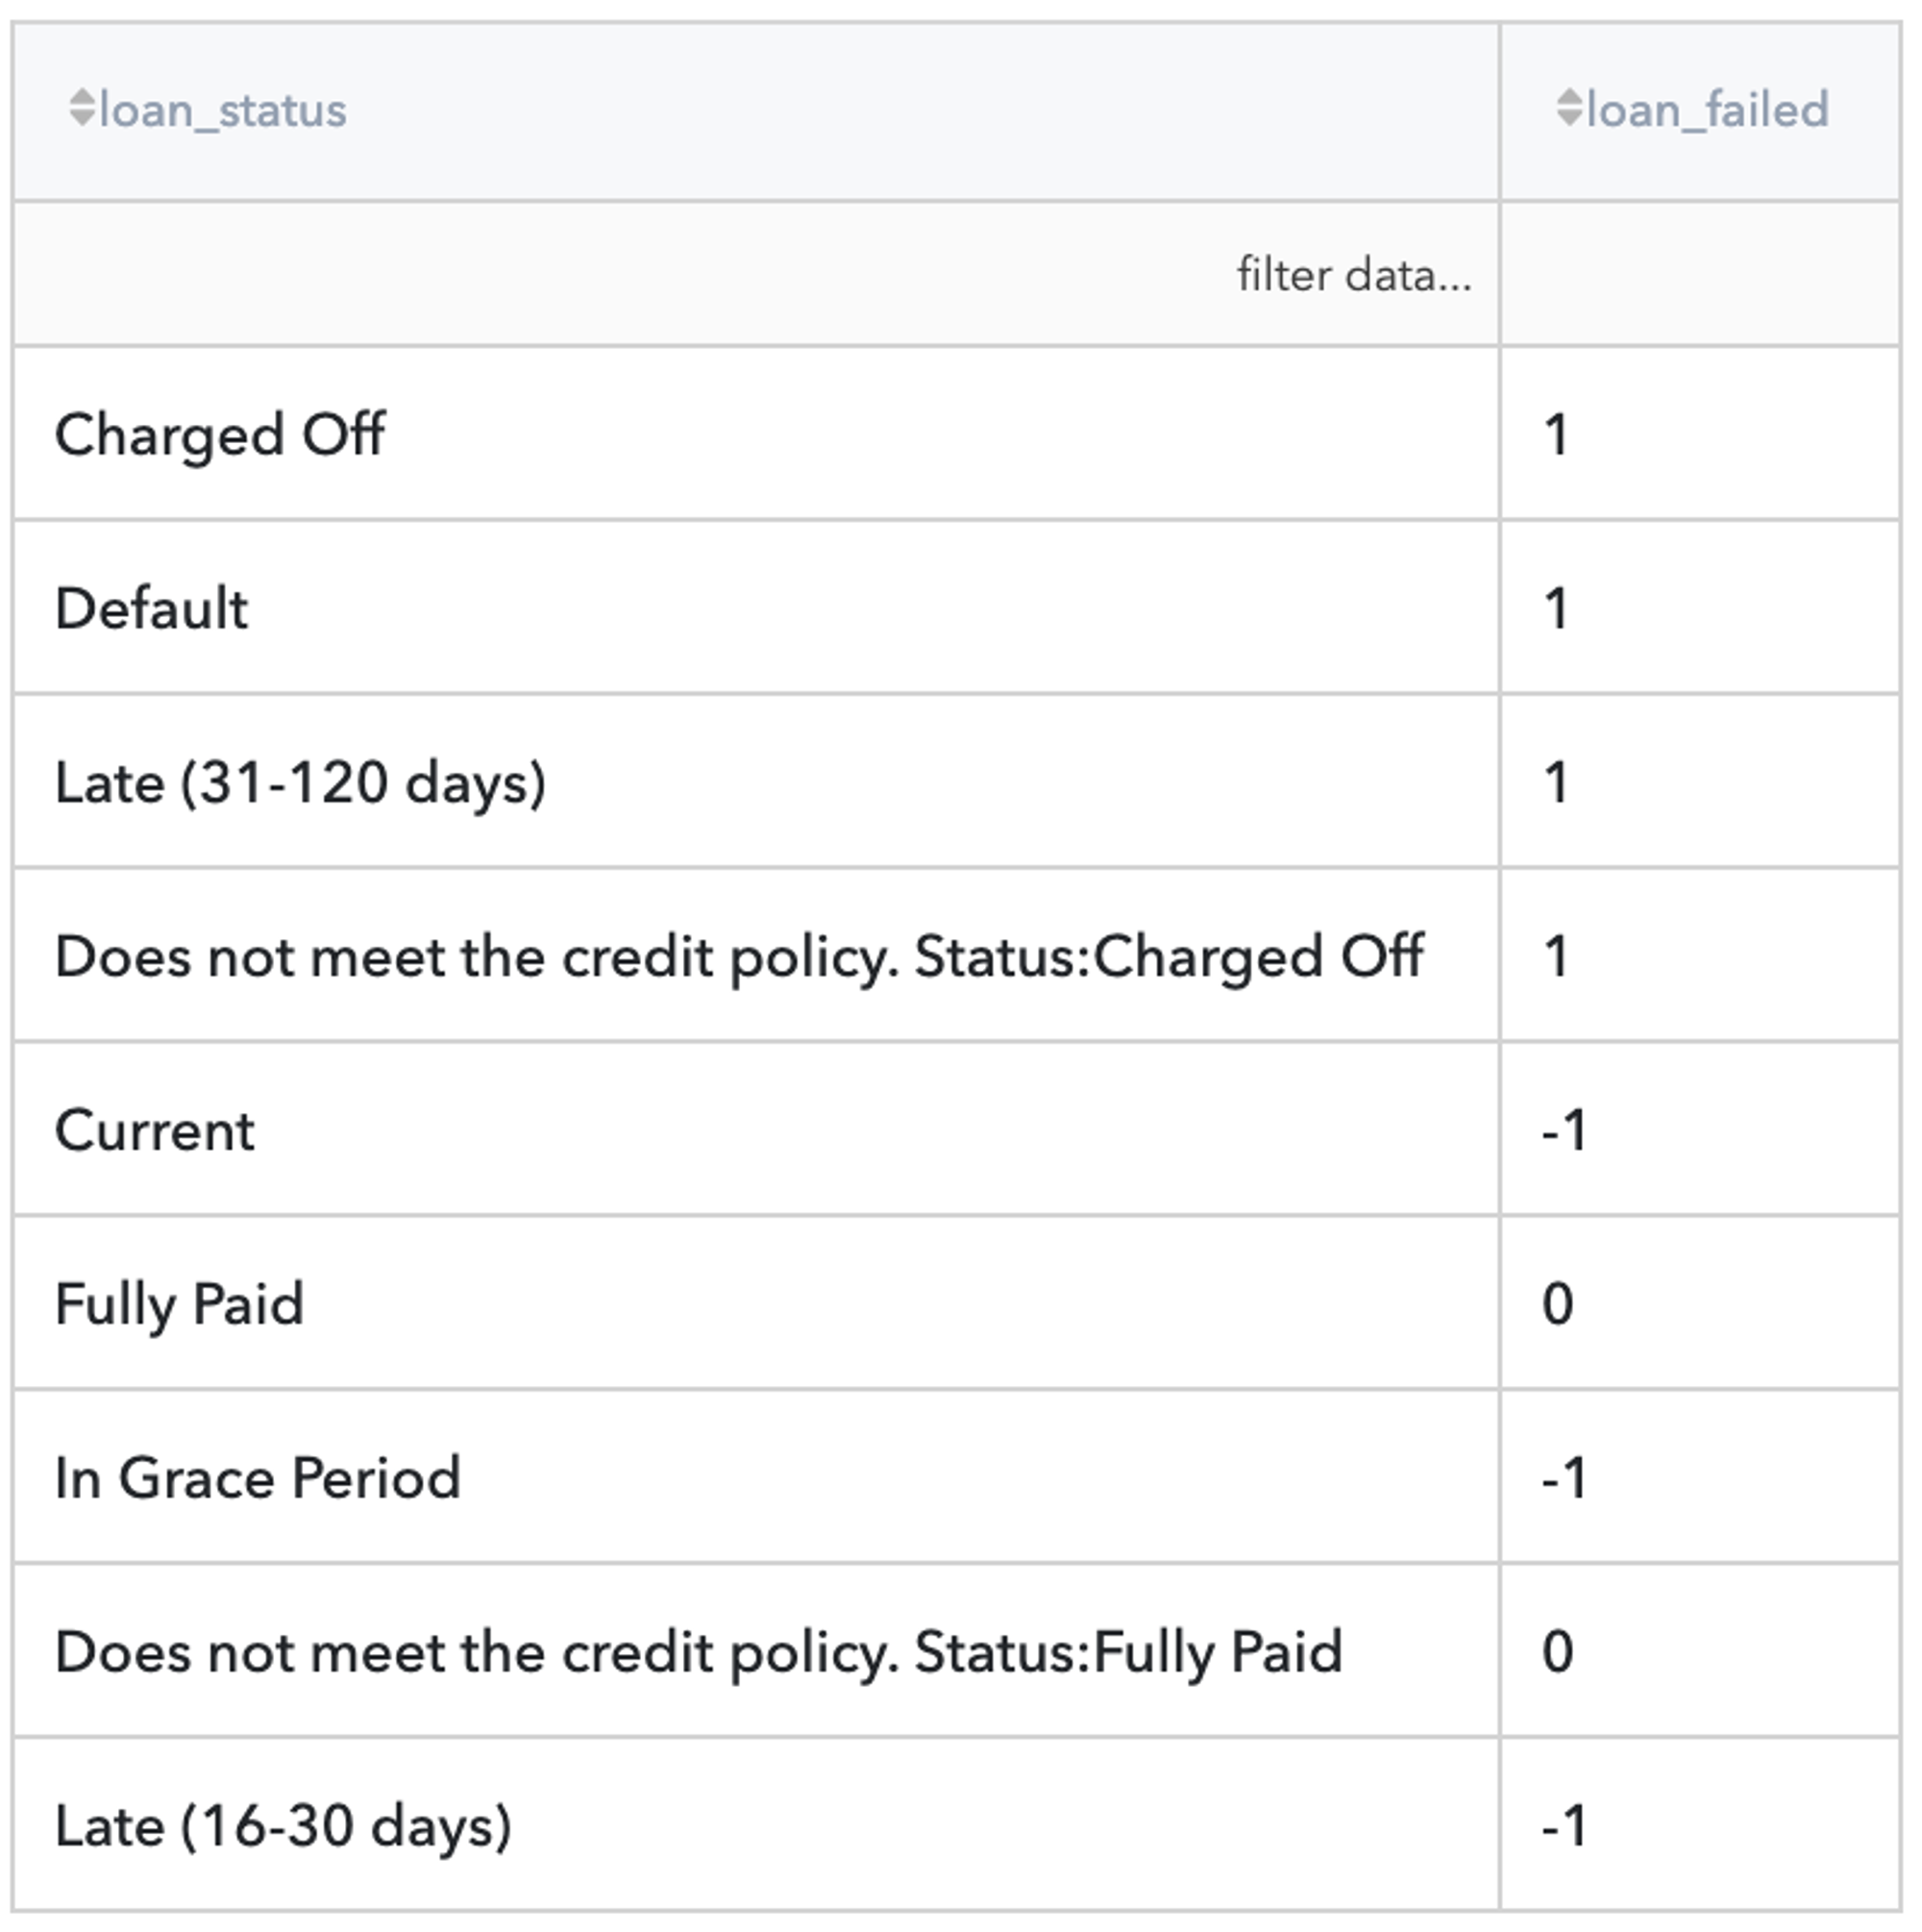
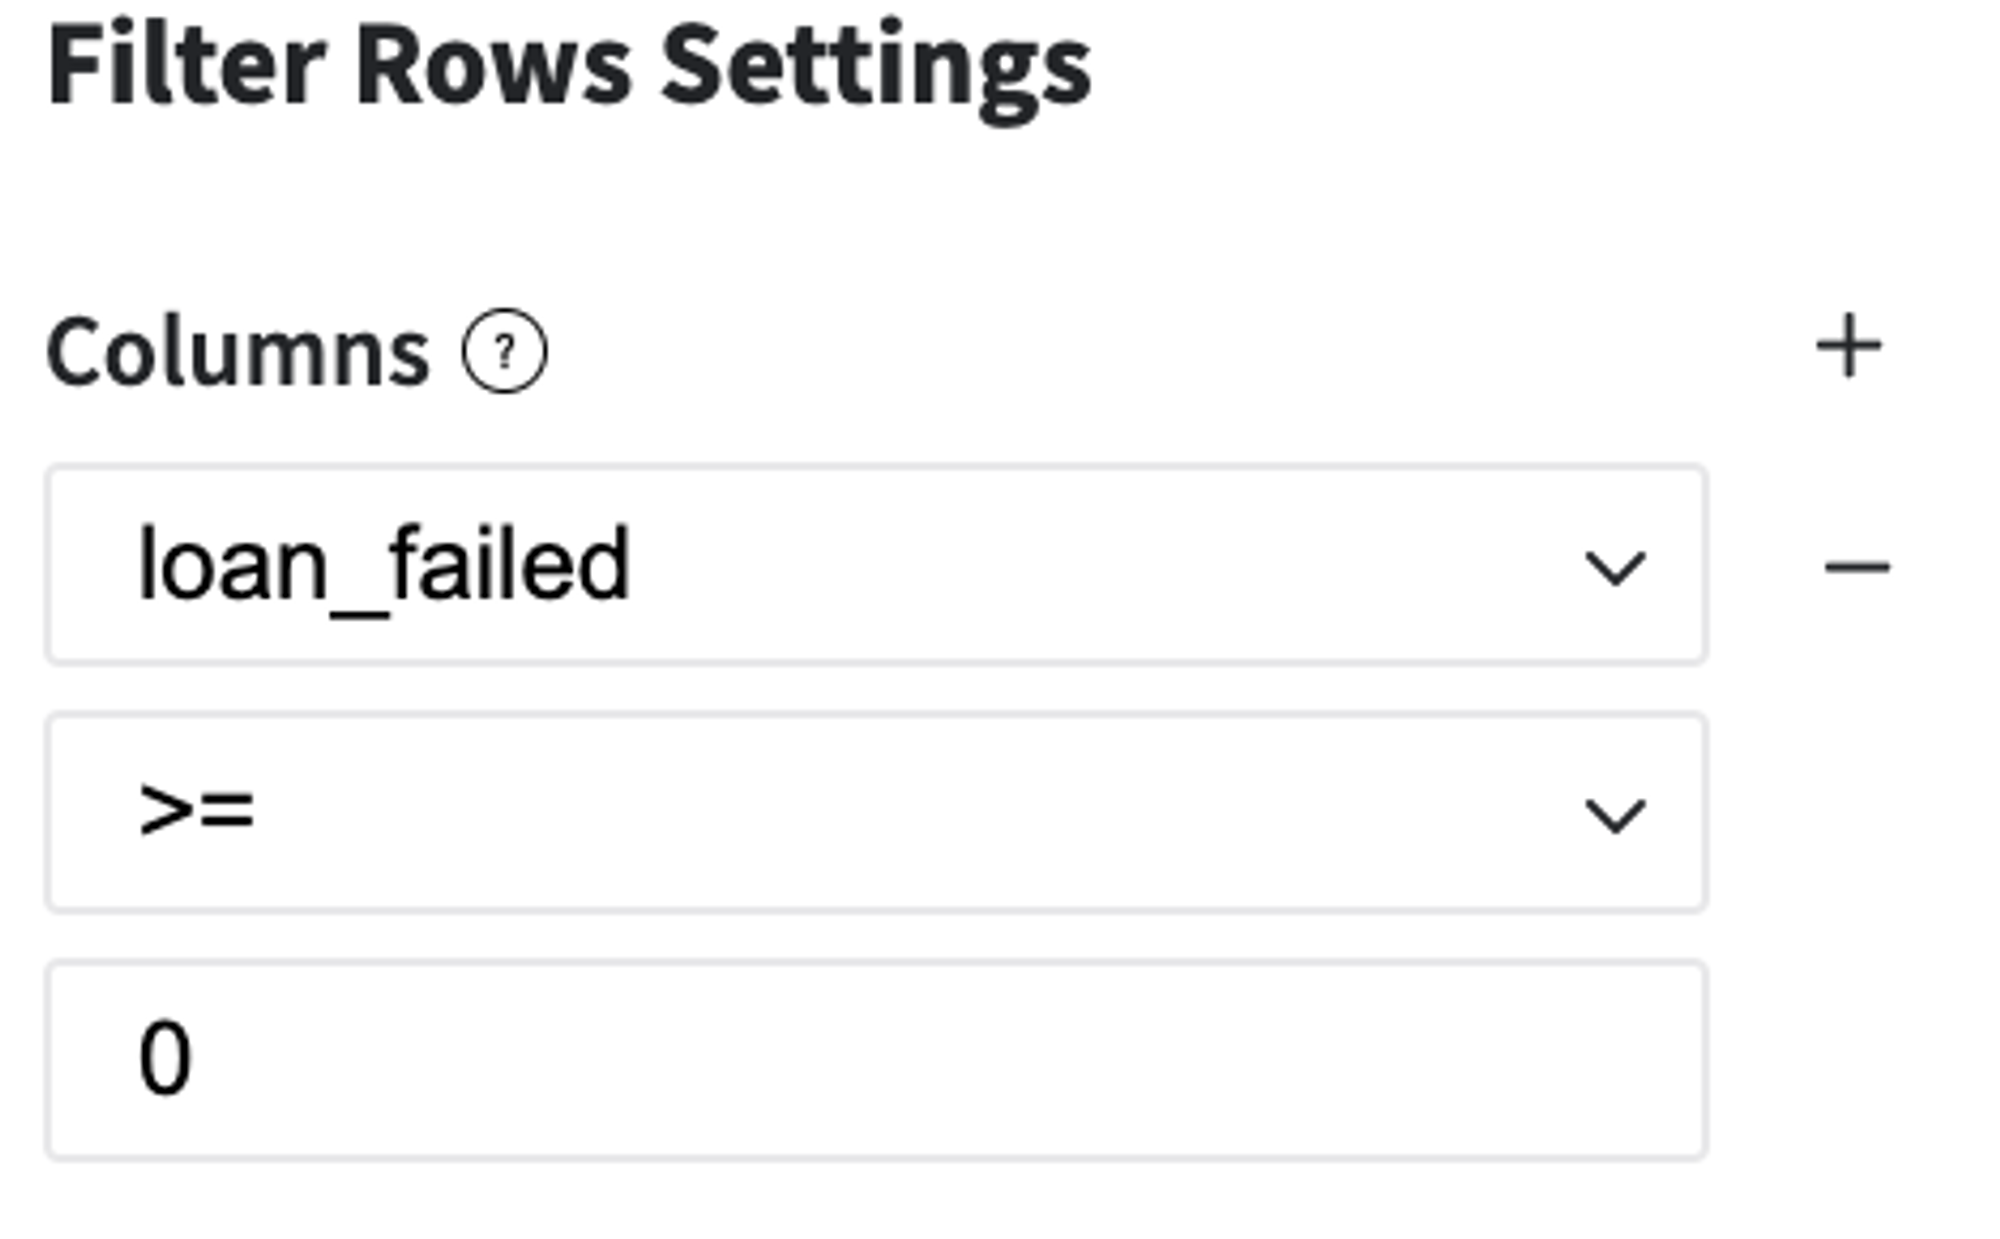
3. Define the Binary Target Variable: loan_failed:
Users that have the status "Current","Late (13-30 days)" or "In Grace Period" are considered as open cases (cases with uncertain results) and will be excluded from the analysis
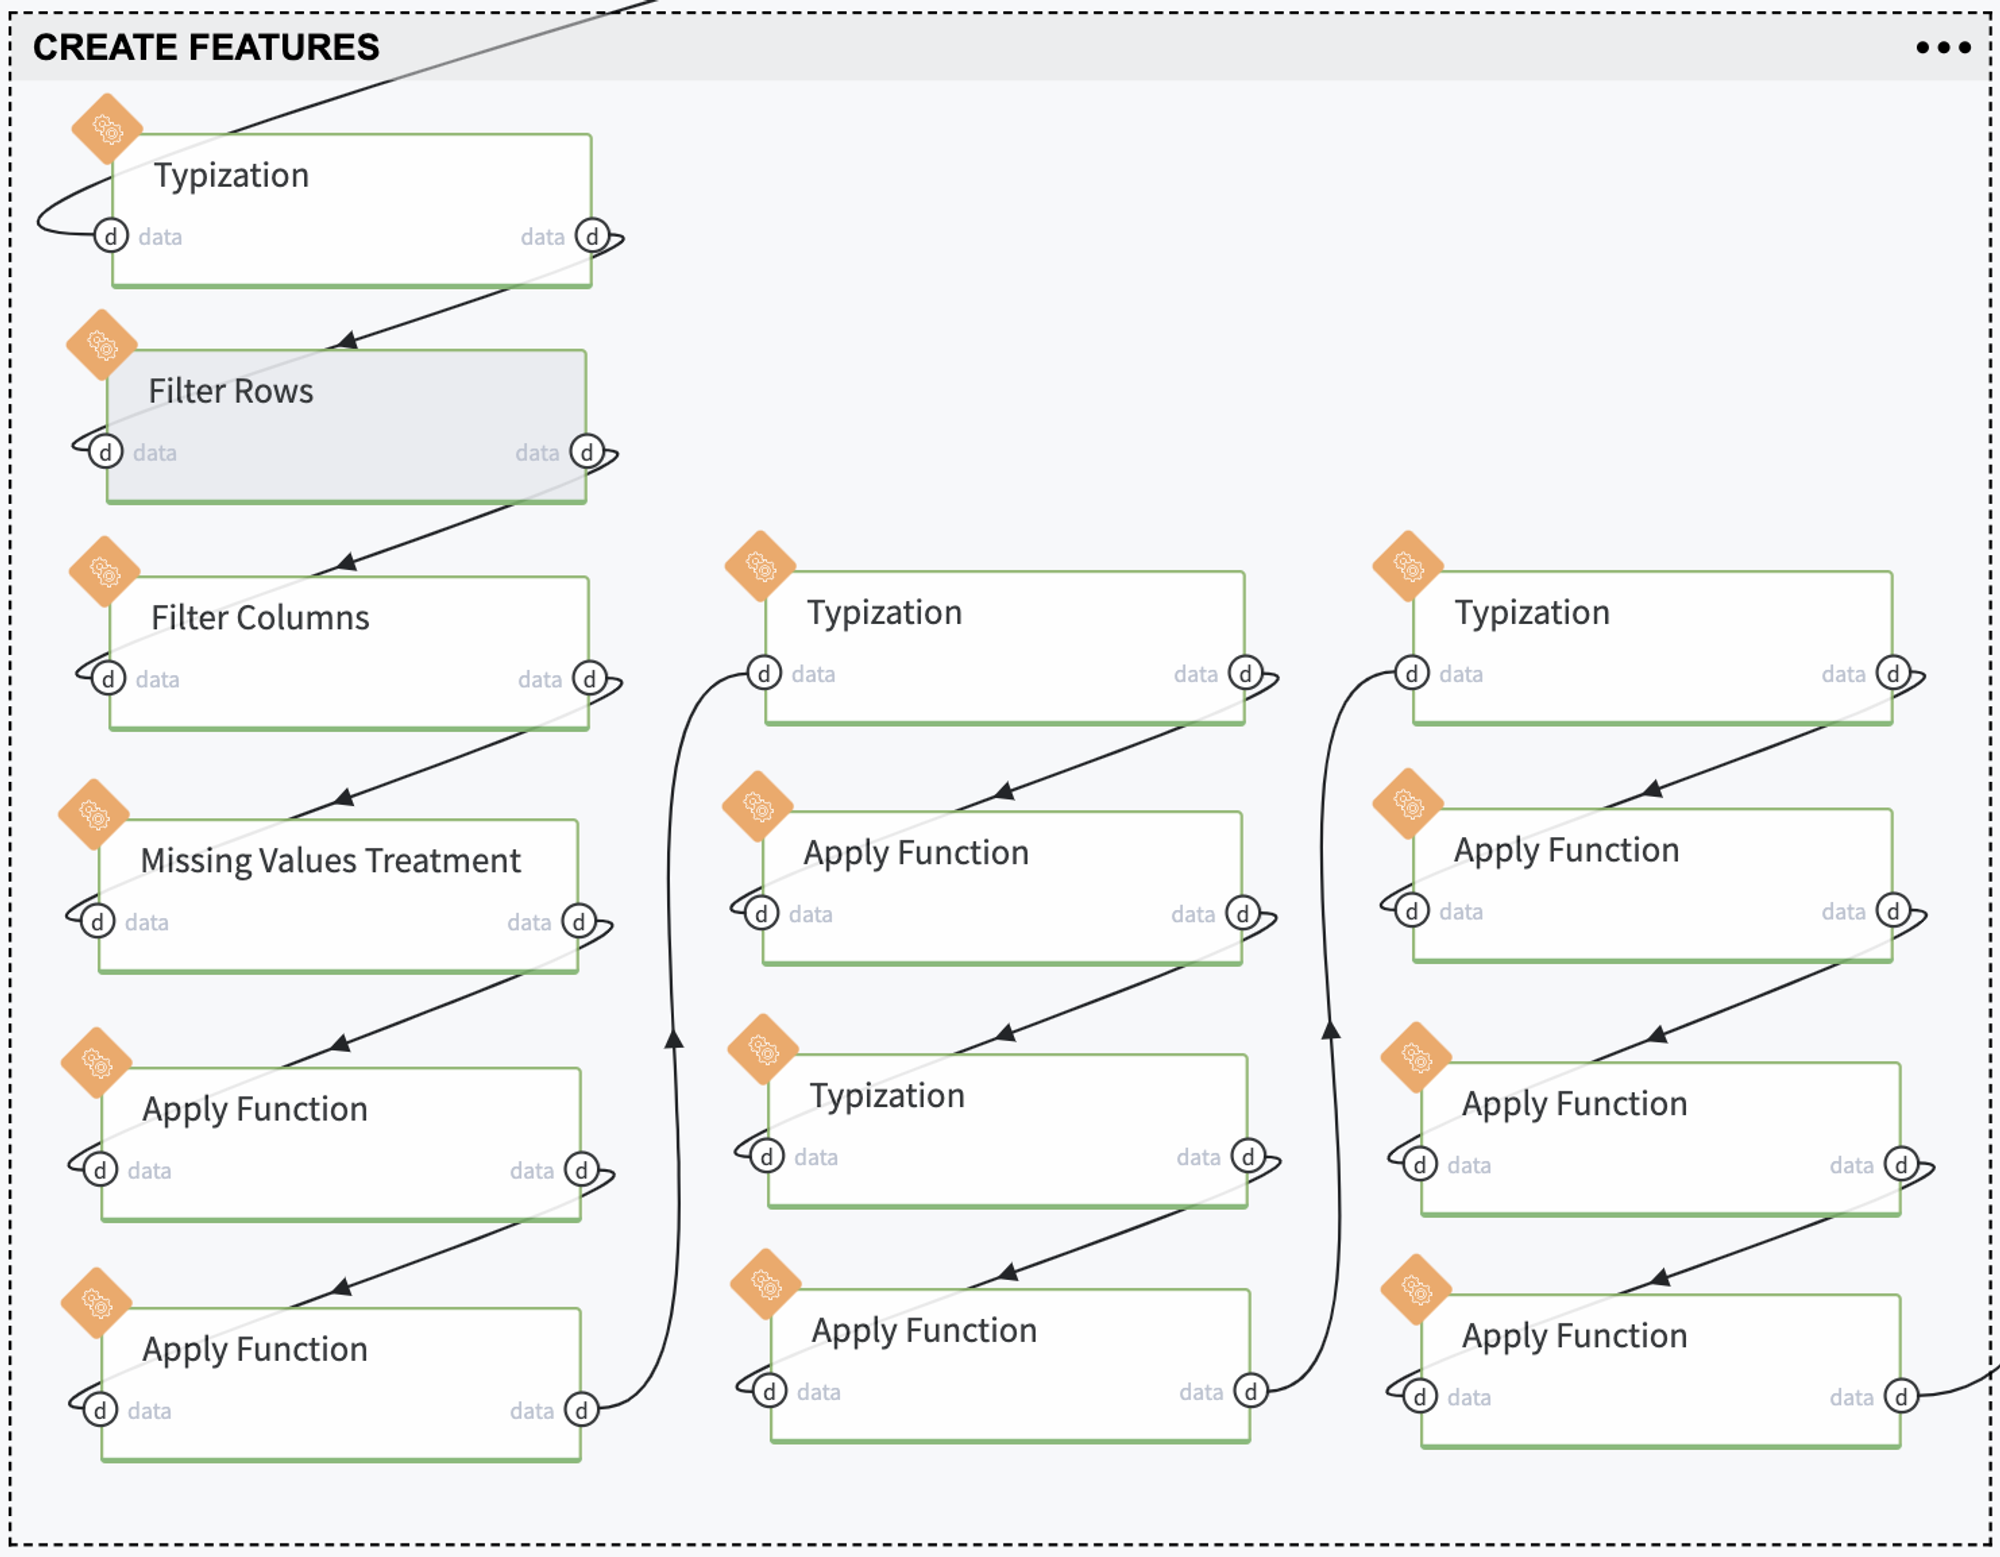
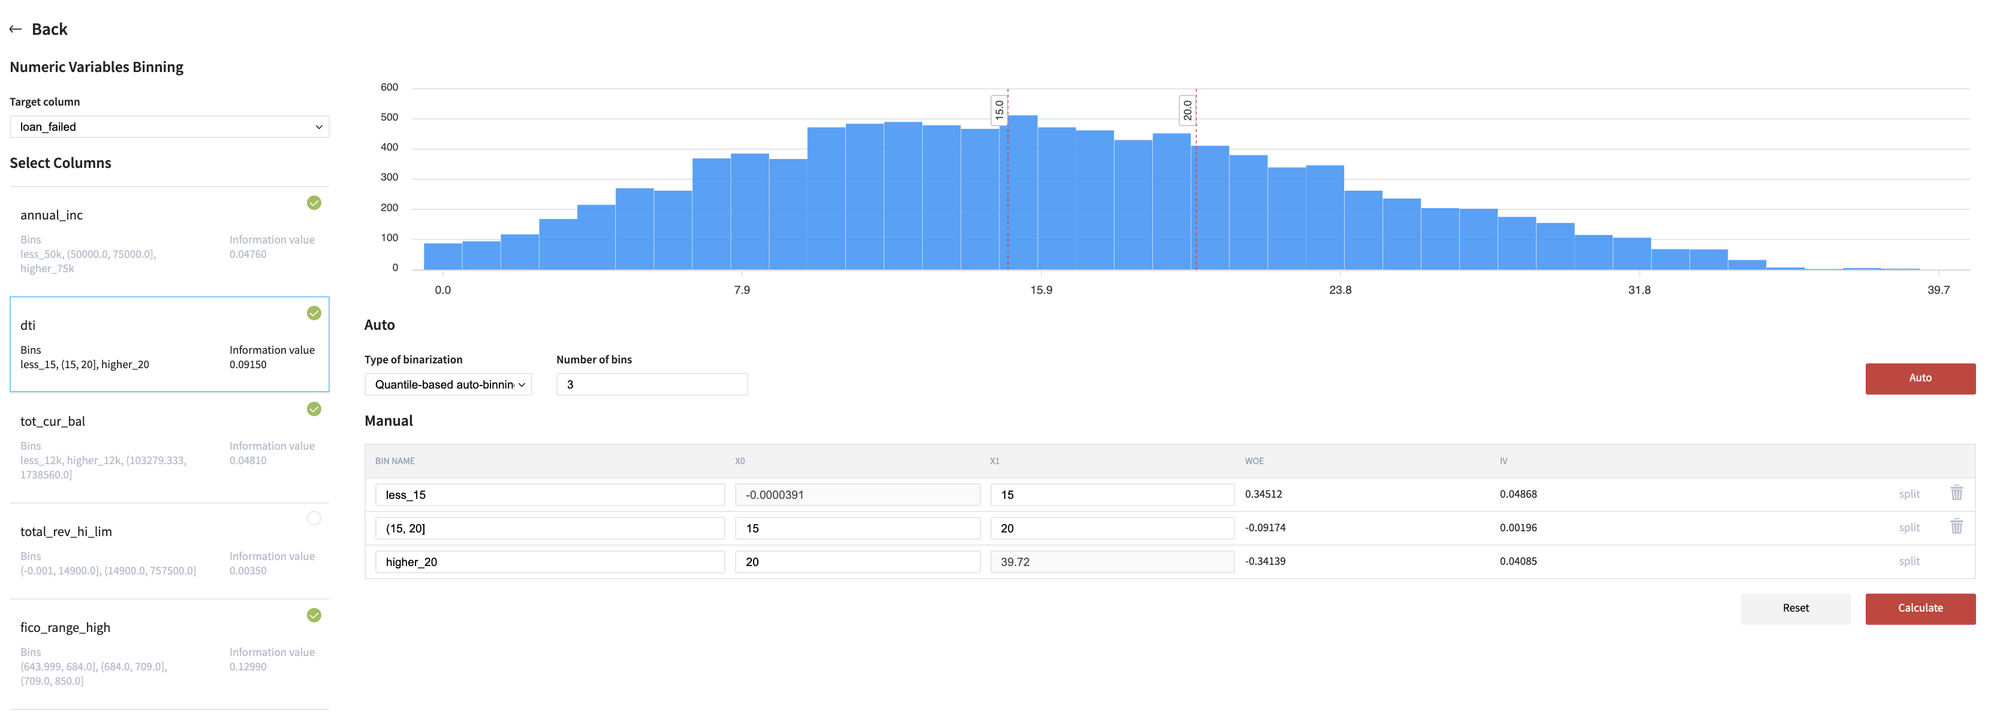
We apply the Binning procedure to transform the numerical variable as the categorical one and then as a binary vector. We need to get this kind of representation for the ScoreCards creation.
Each feature is divided into three categories via Quantile-based auto-binning, and the less informative ones should be removed to avoid the multicollinearity problem. The feature fico_range_low was excluded as the feature with an extremely high correlation with fico_range_high, features total_rev_hi_lim, fico_range_low, installment and open_acc were not transformed to the categorical view as features with non-informative bins.
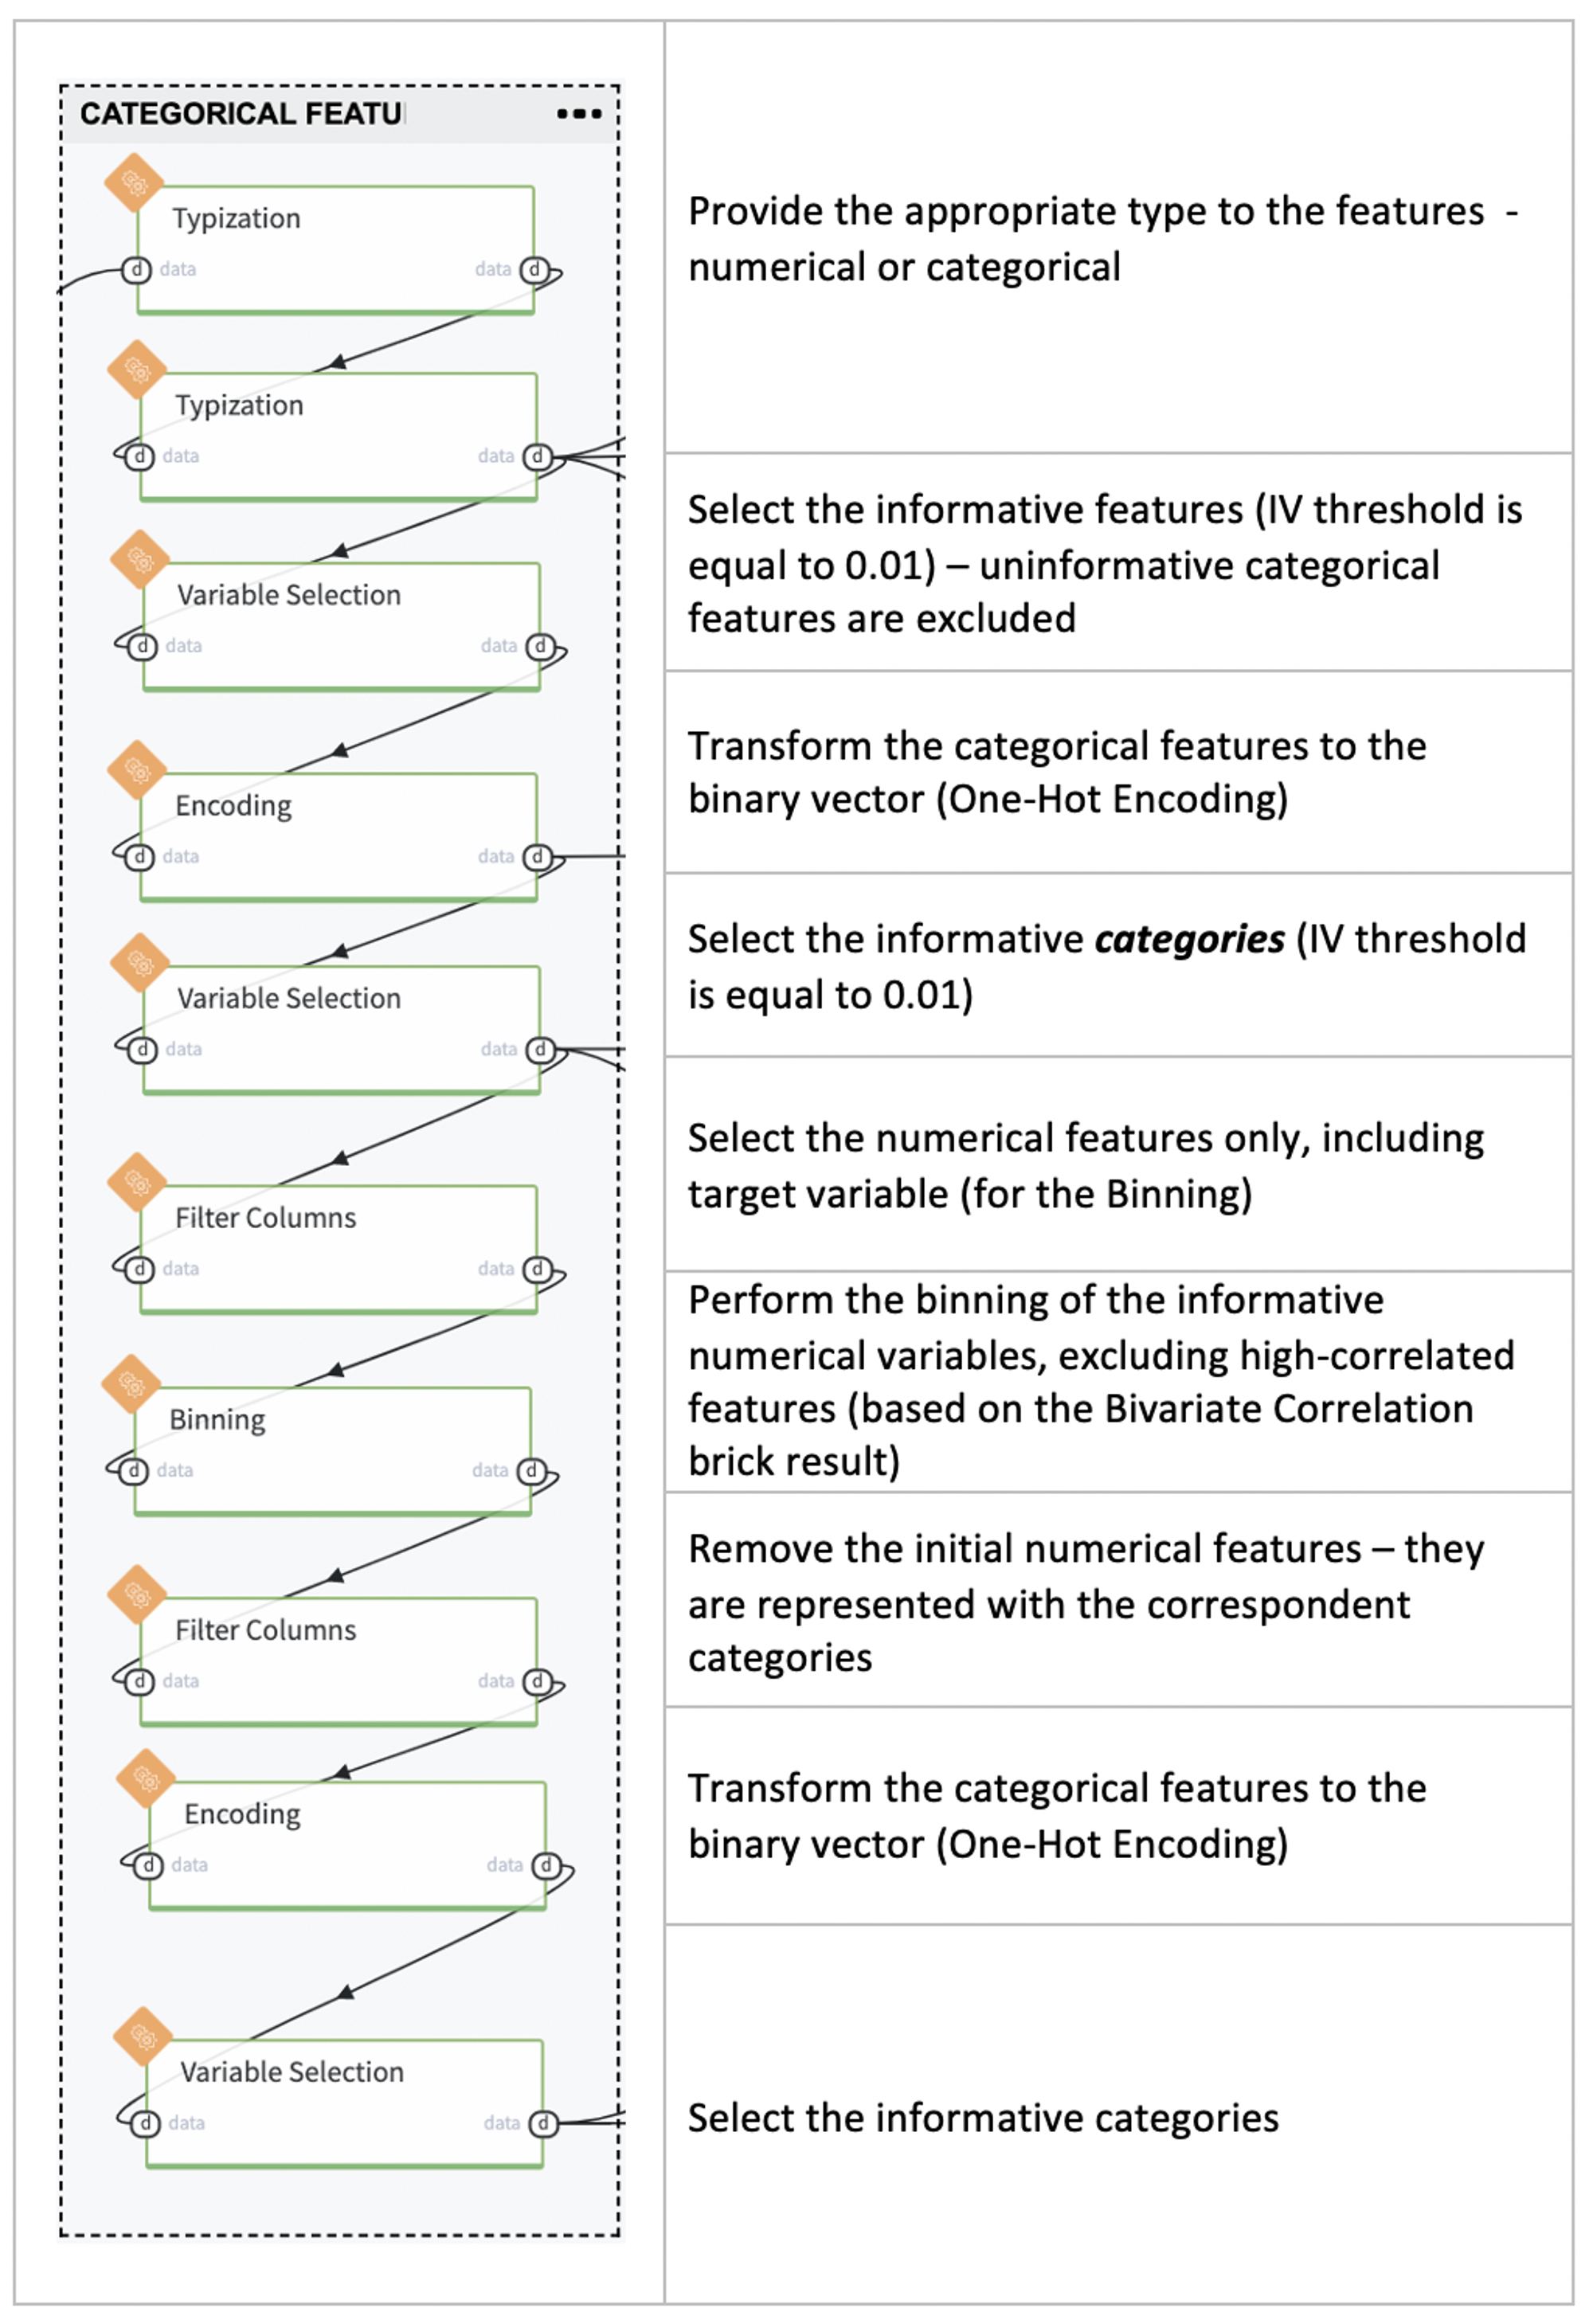
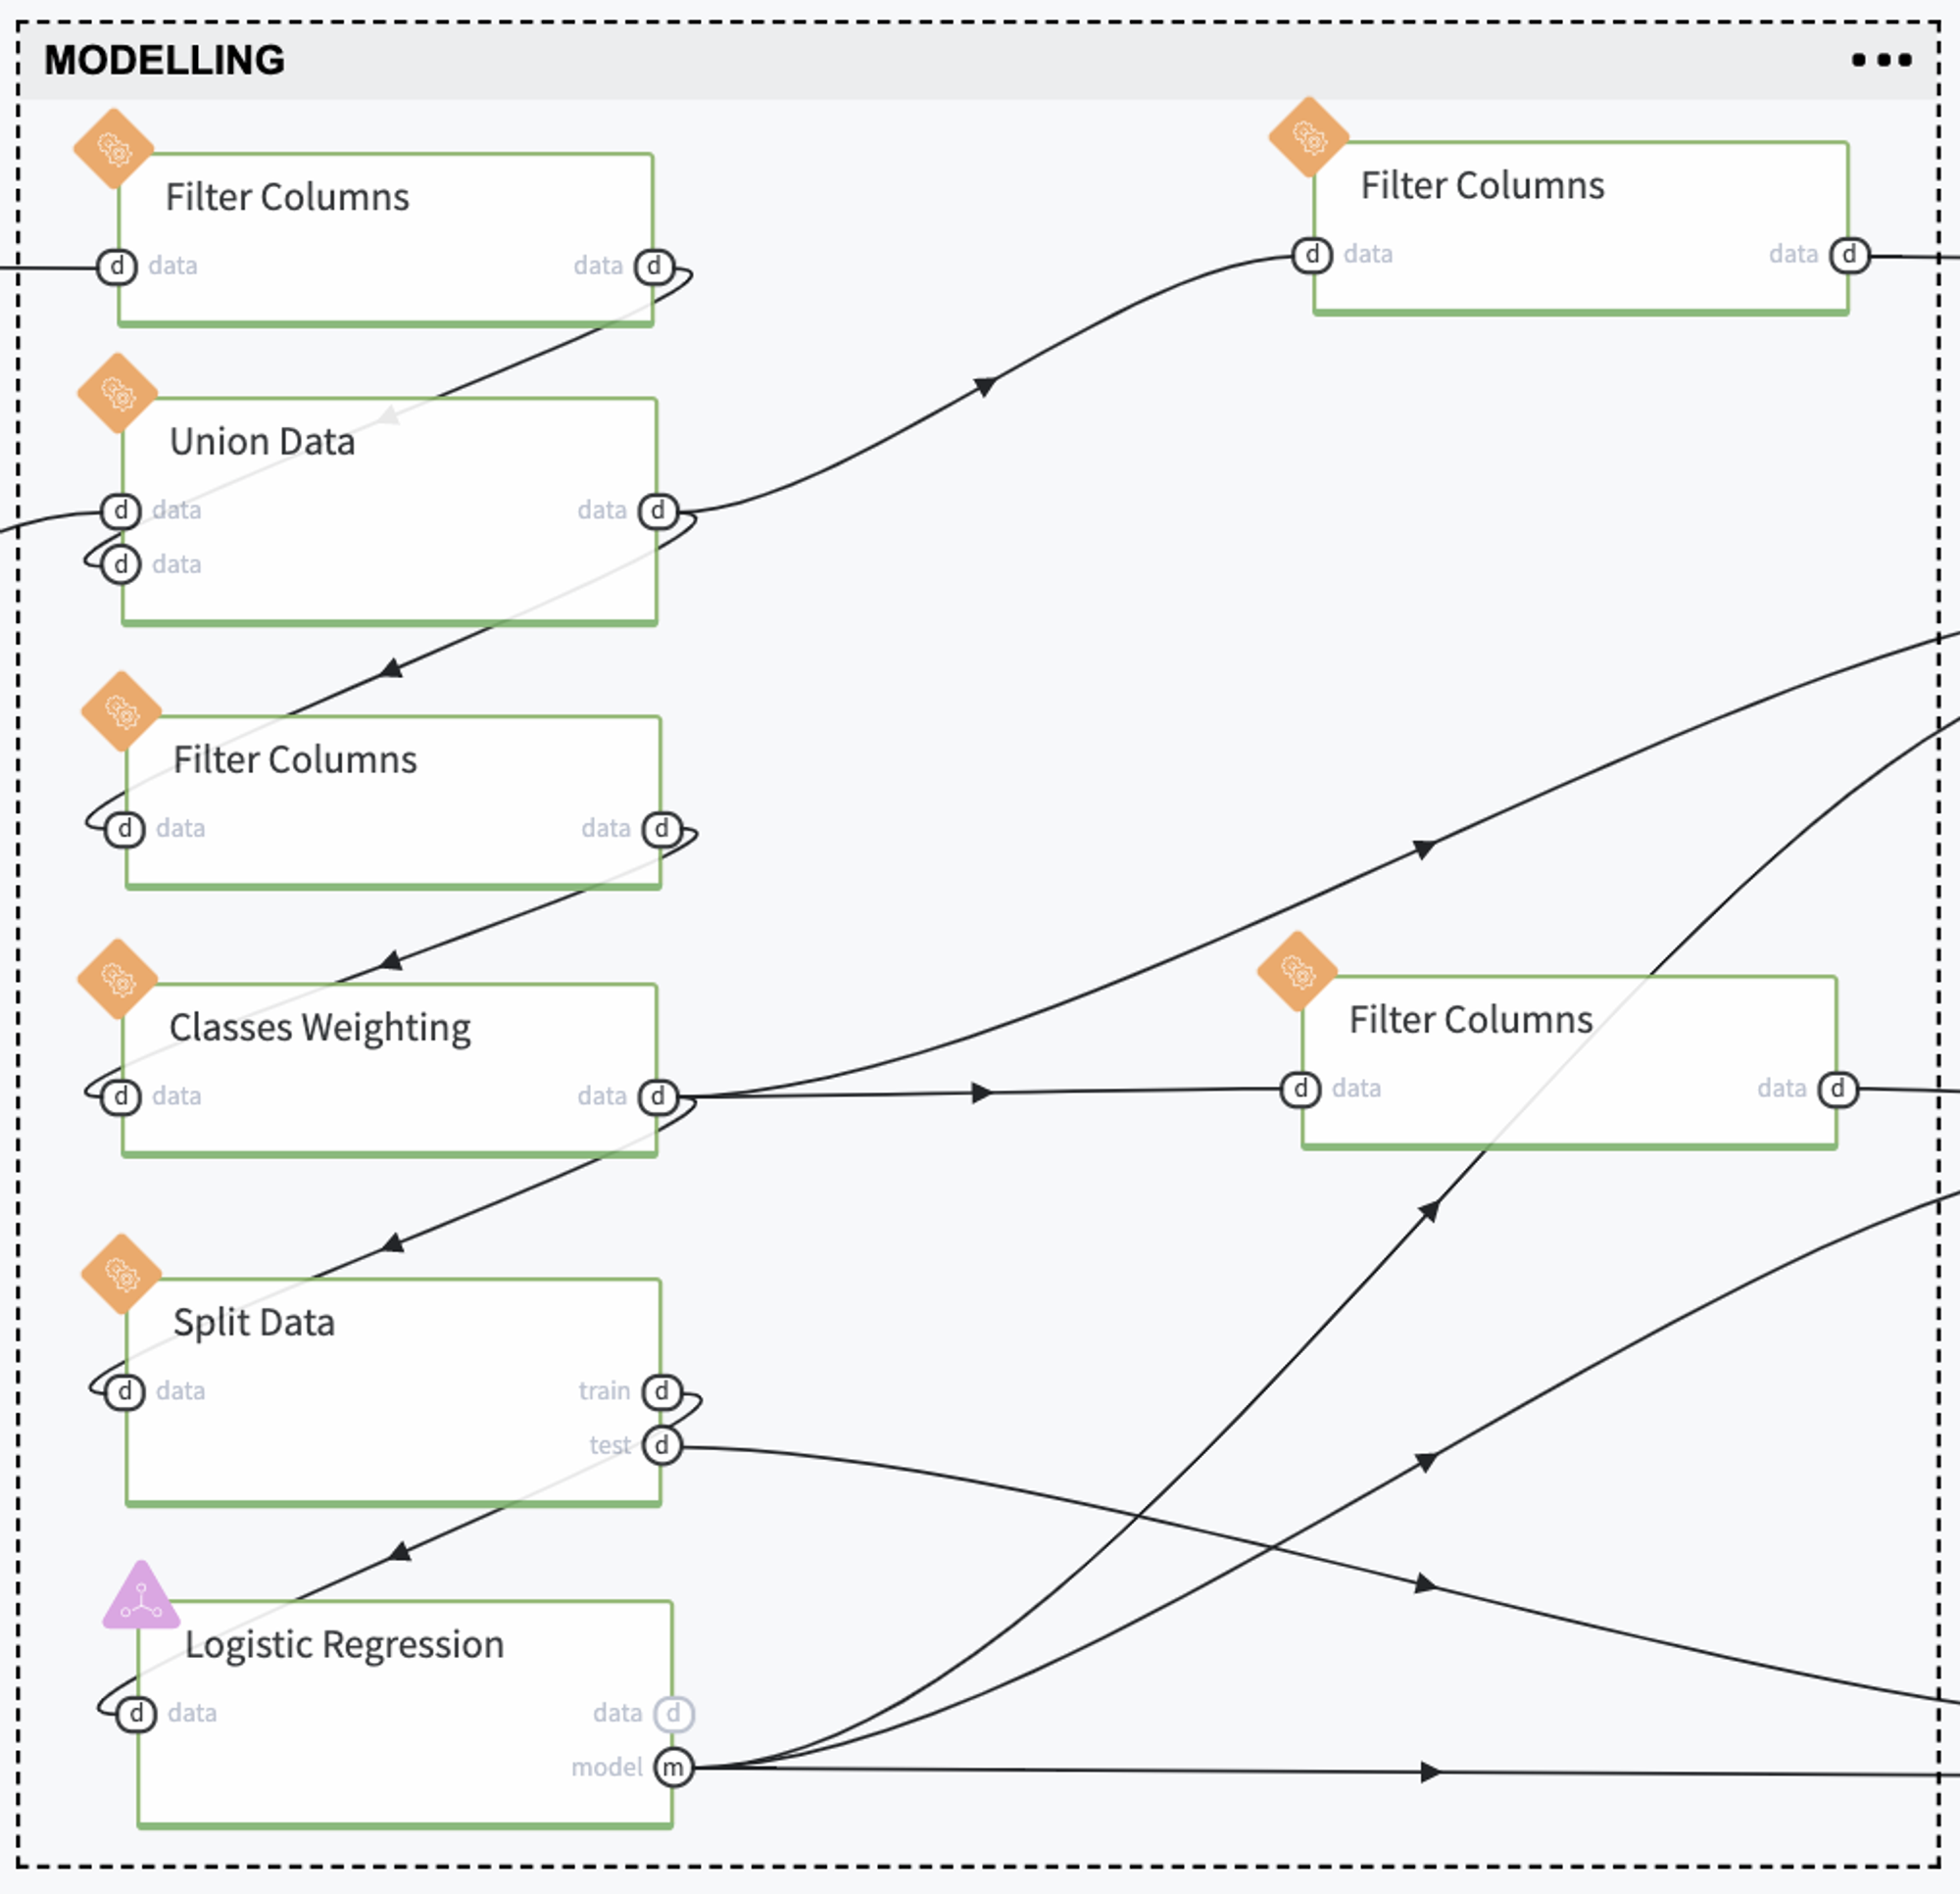
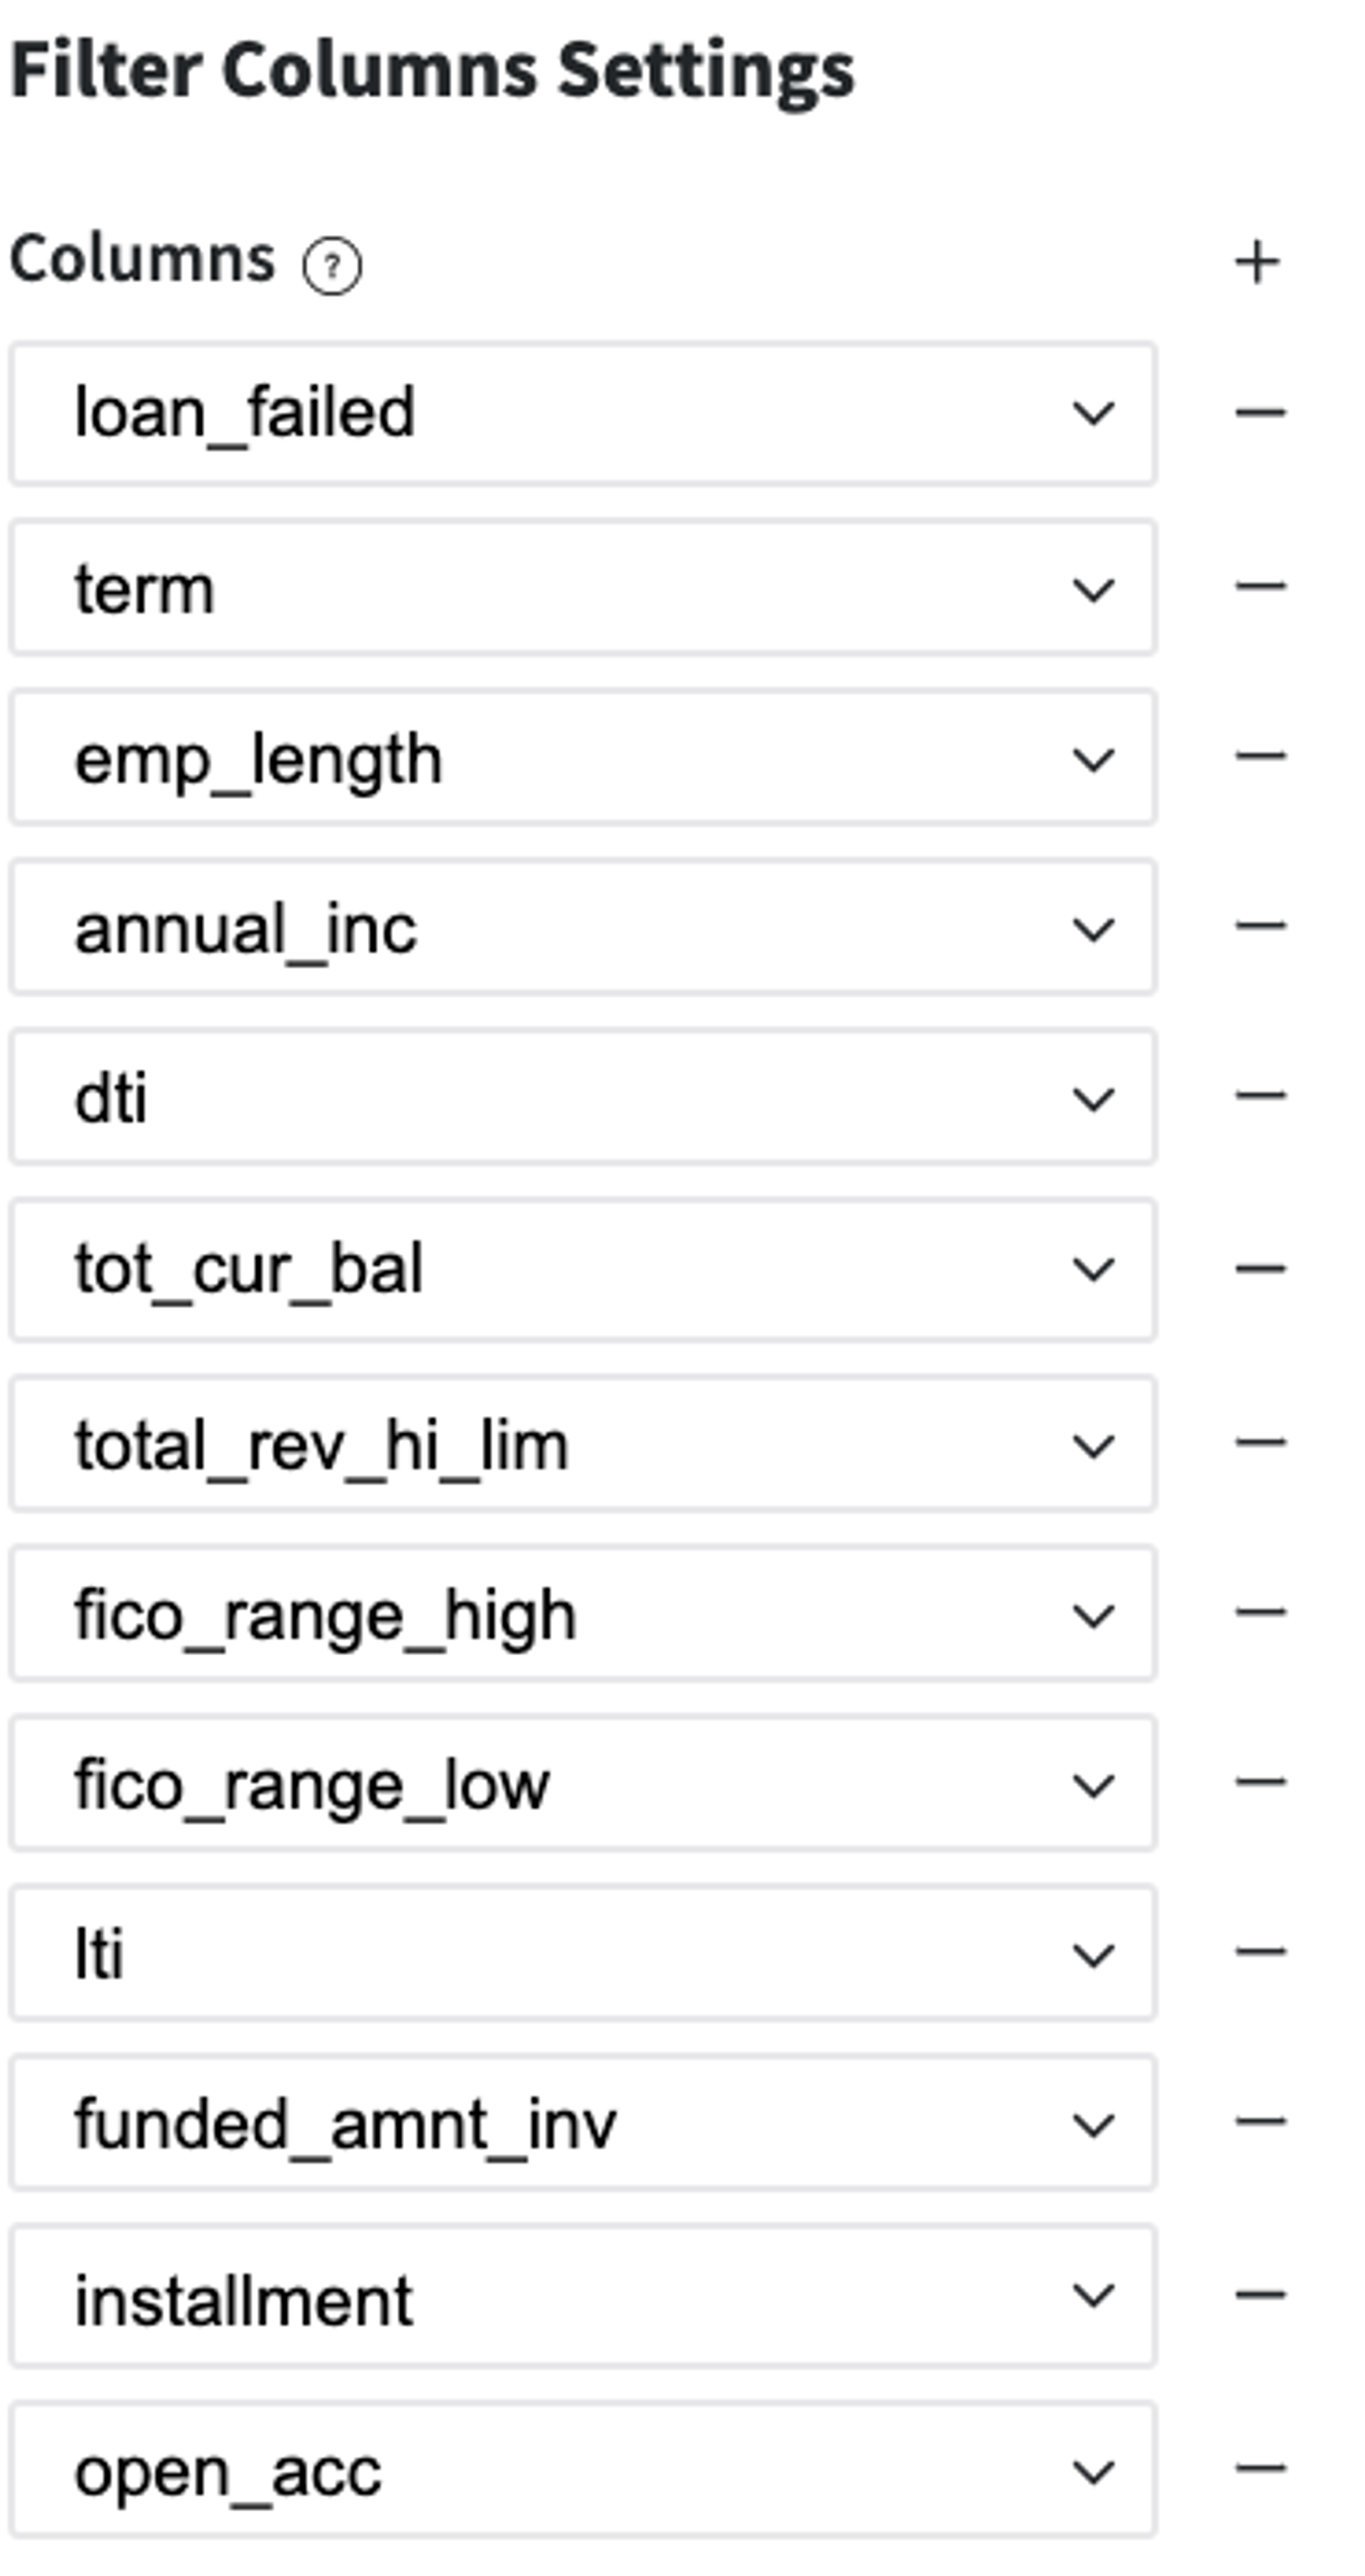
Select the categorical features only - these features were removed before the Binning stage.
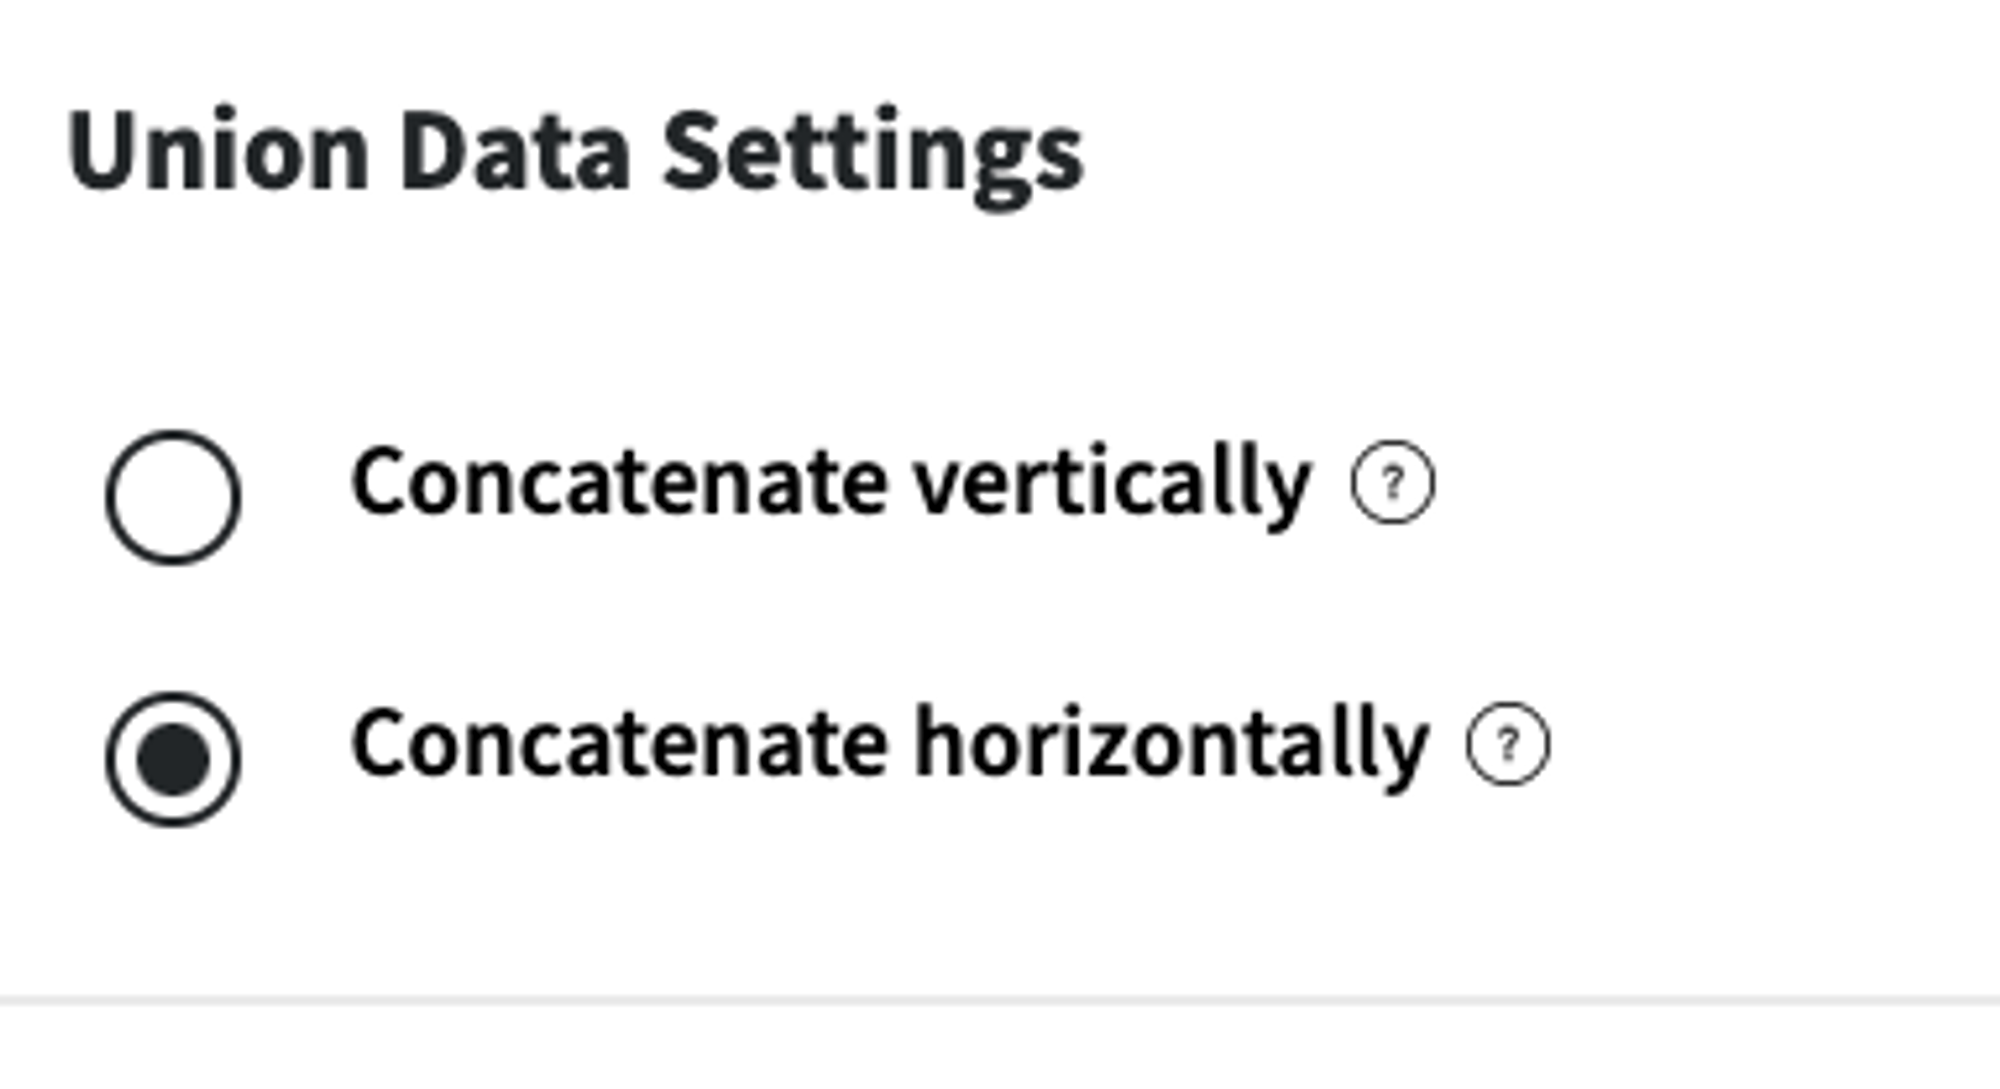
2. Union the categorical features with the informative binning categories
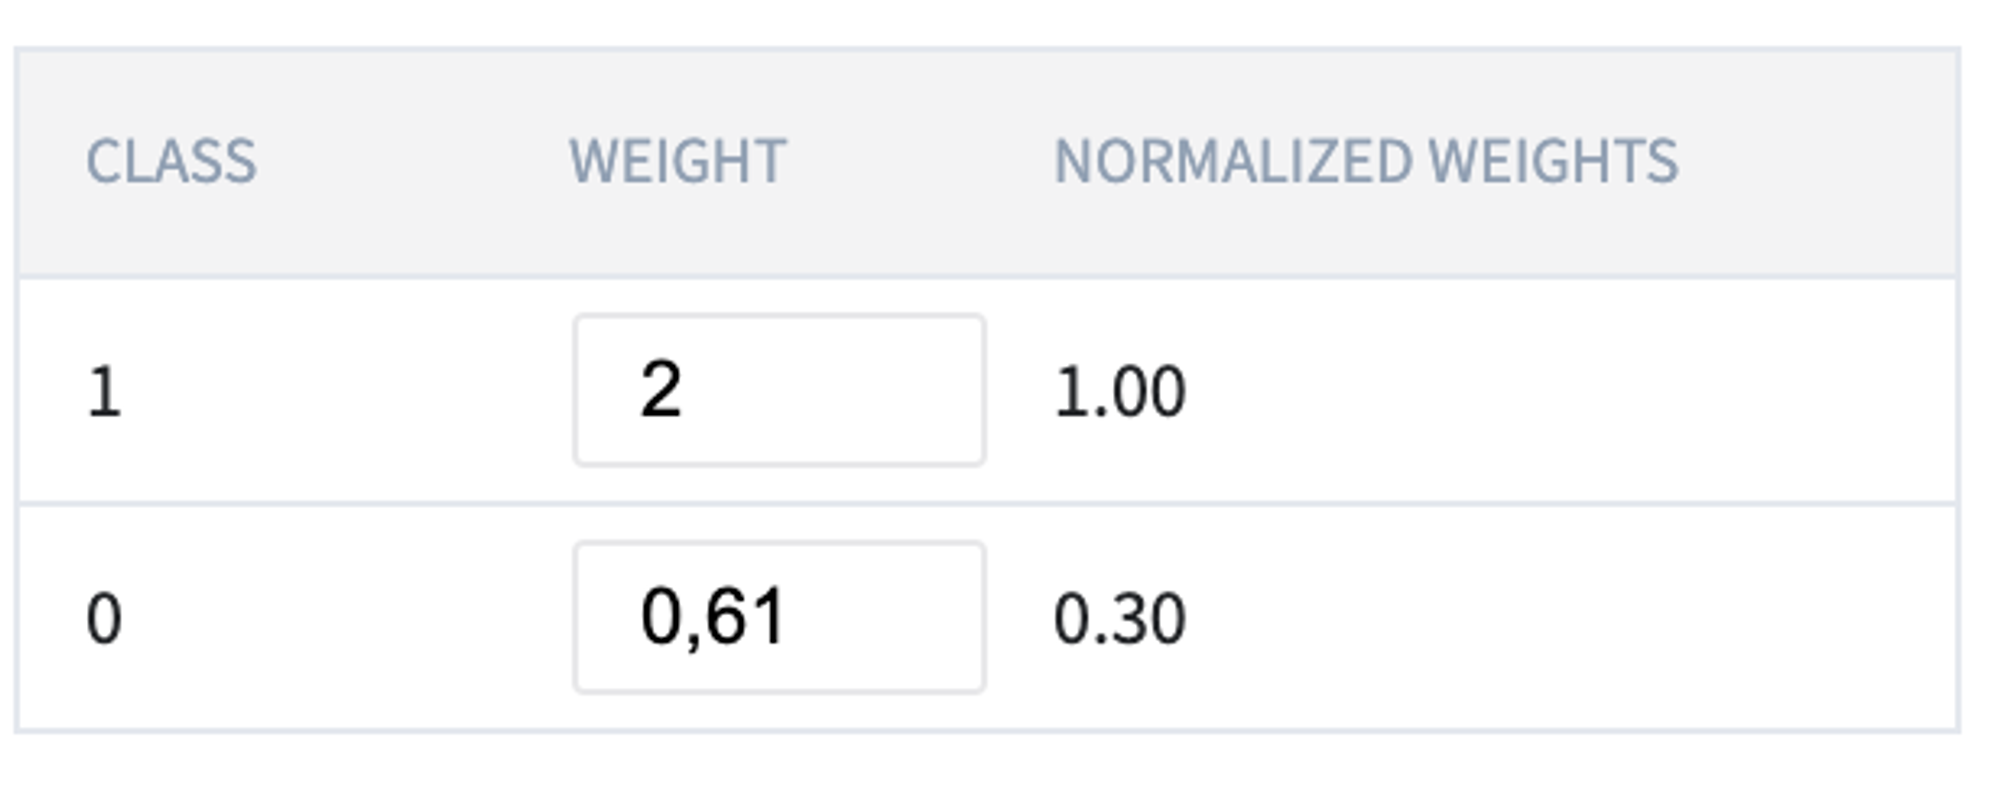
3. Assign the weights to the classes for the slowing the imbalanced classes problem
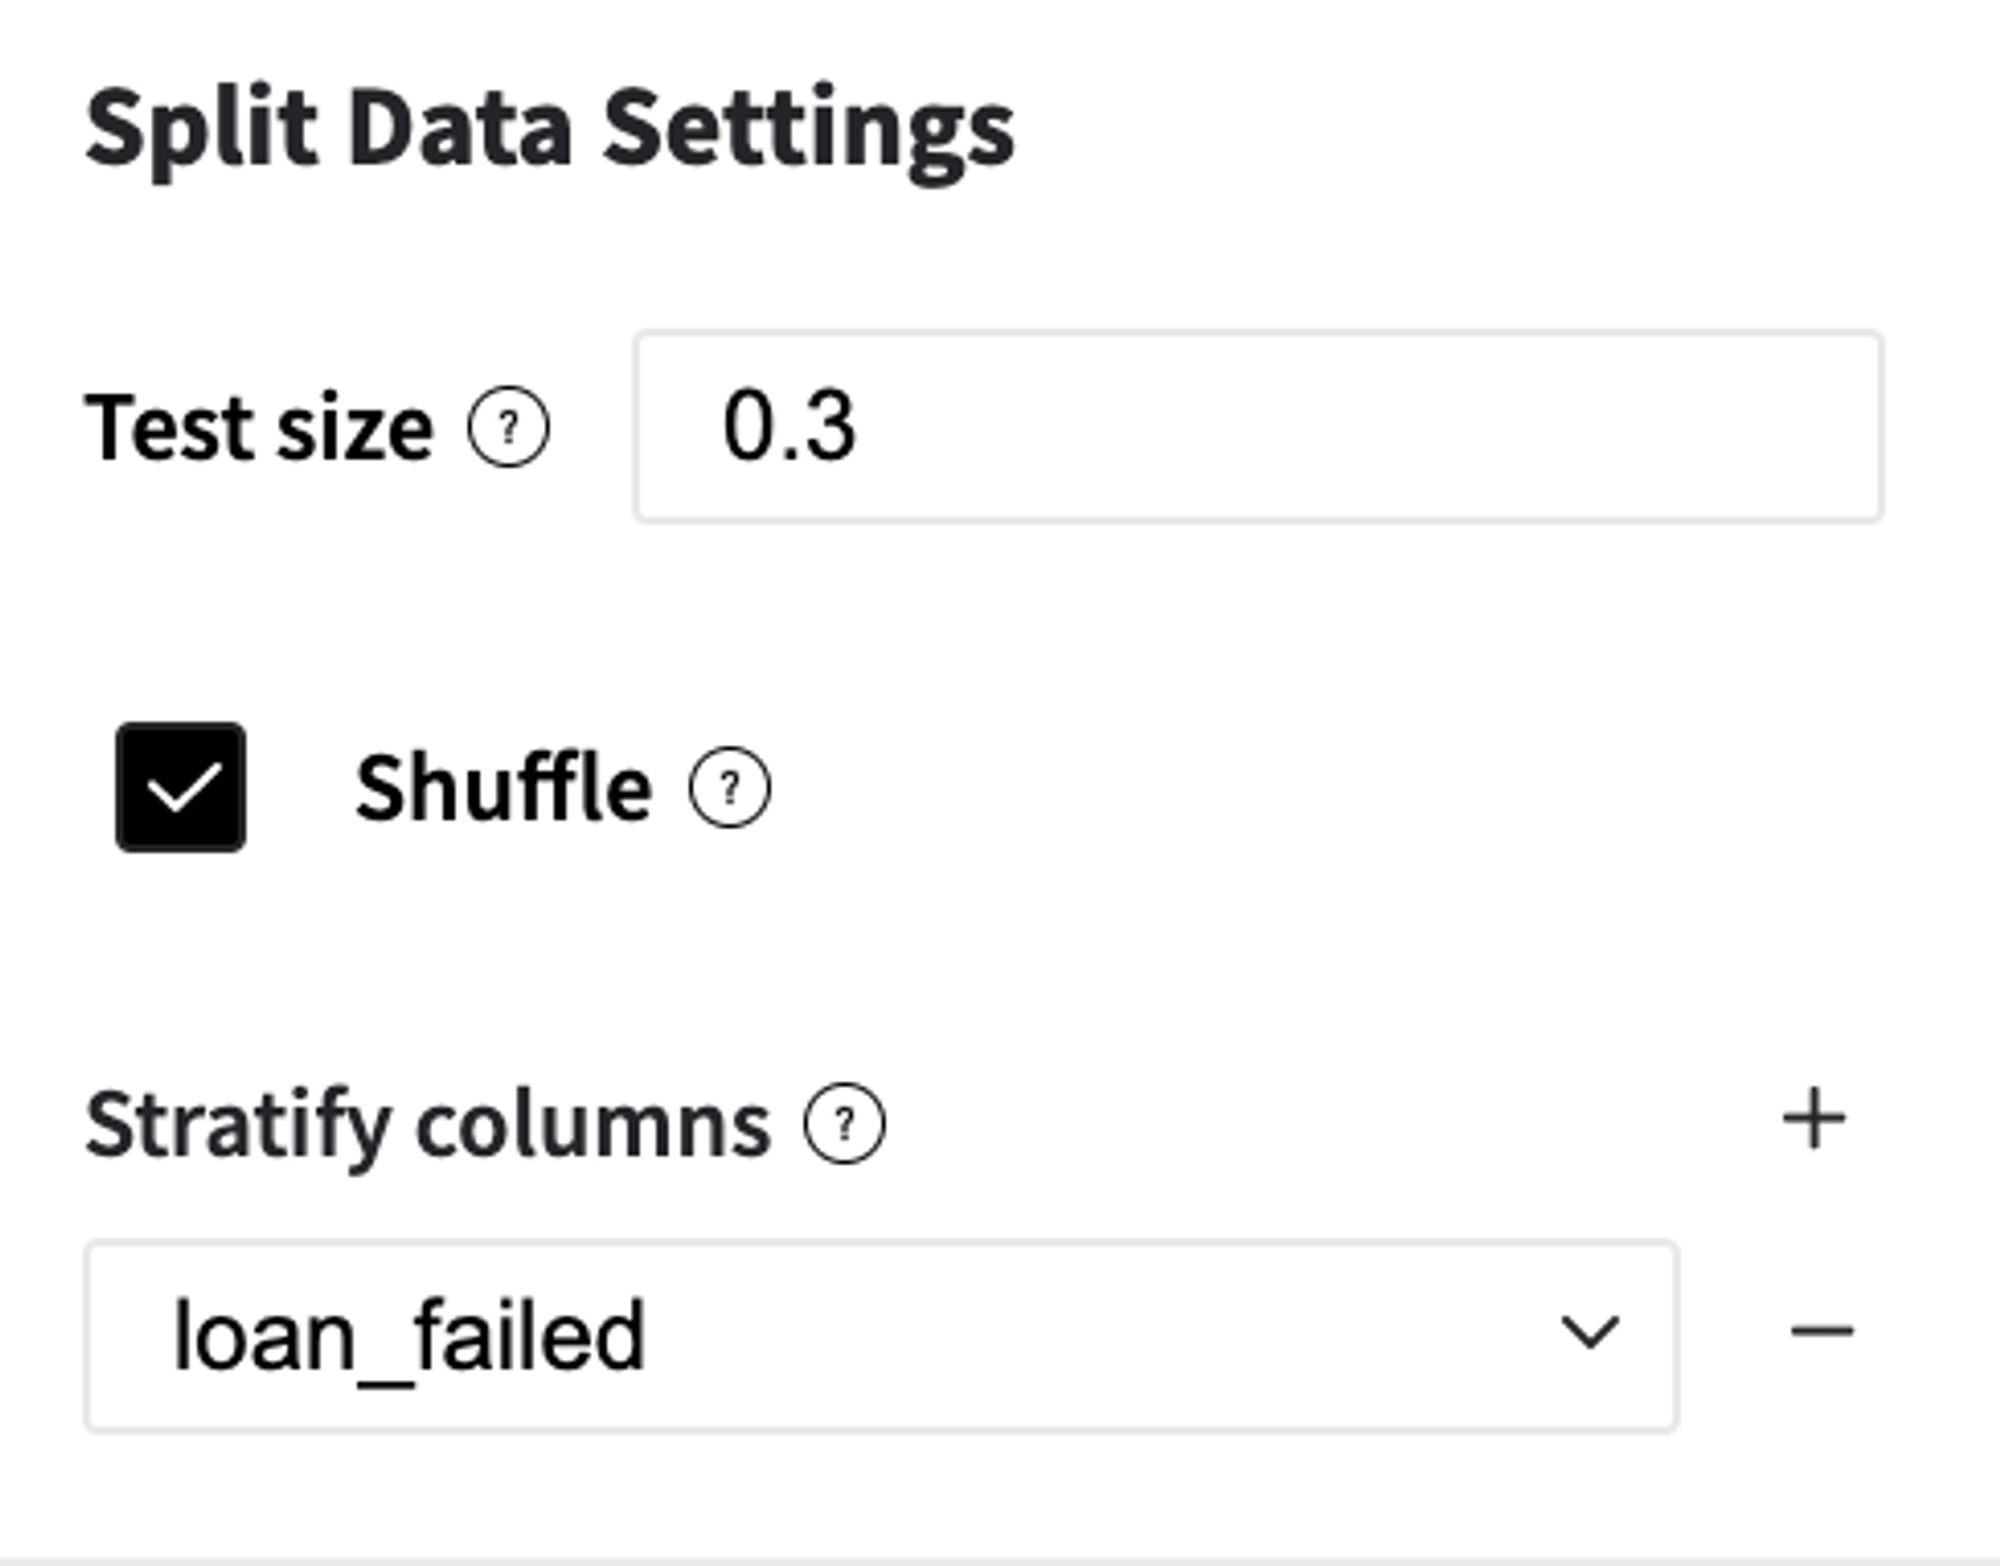
4. Split the dataset into two subsamples with stratification, train, and test, for the model training and validation.
5. Train the Default Risk Assessment model (Logistic Regression) with the previously defined classes weights
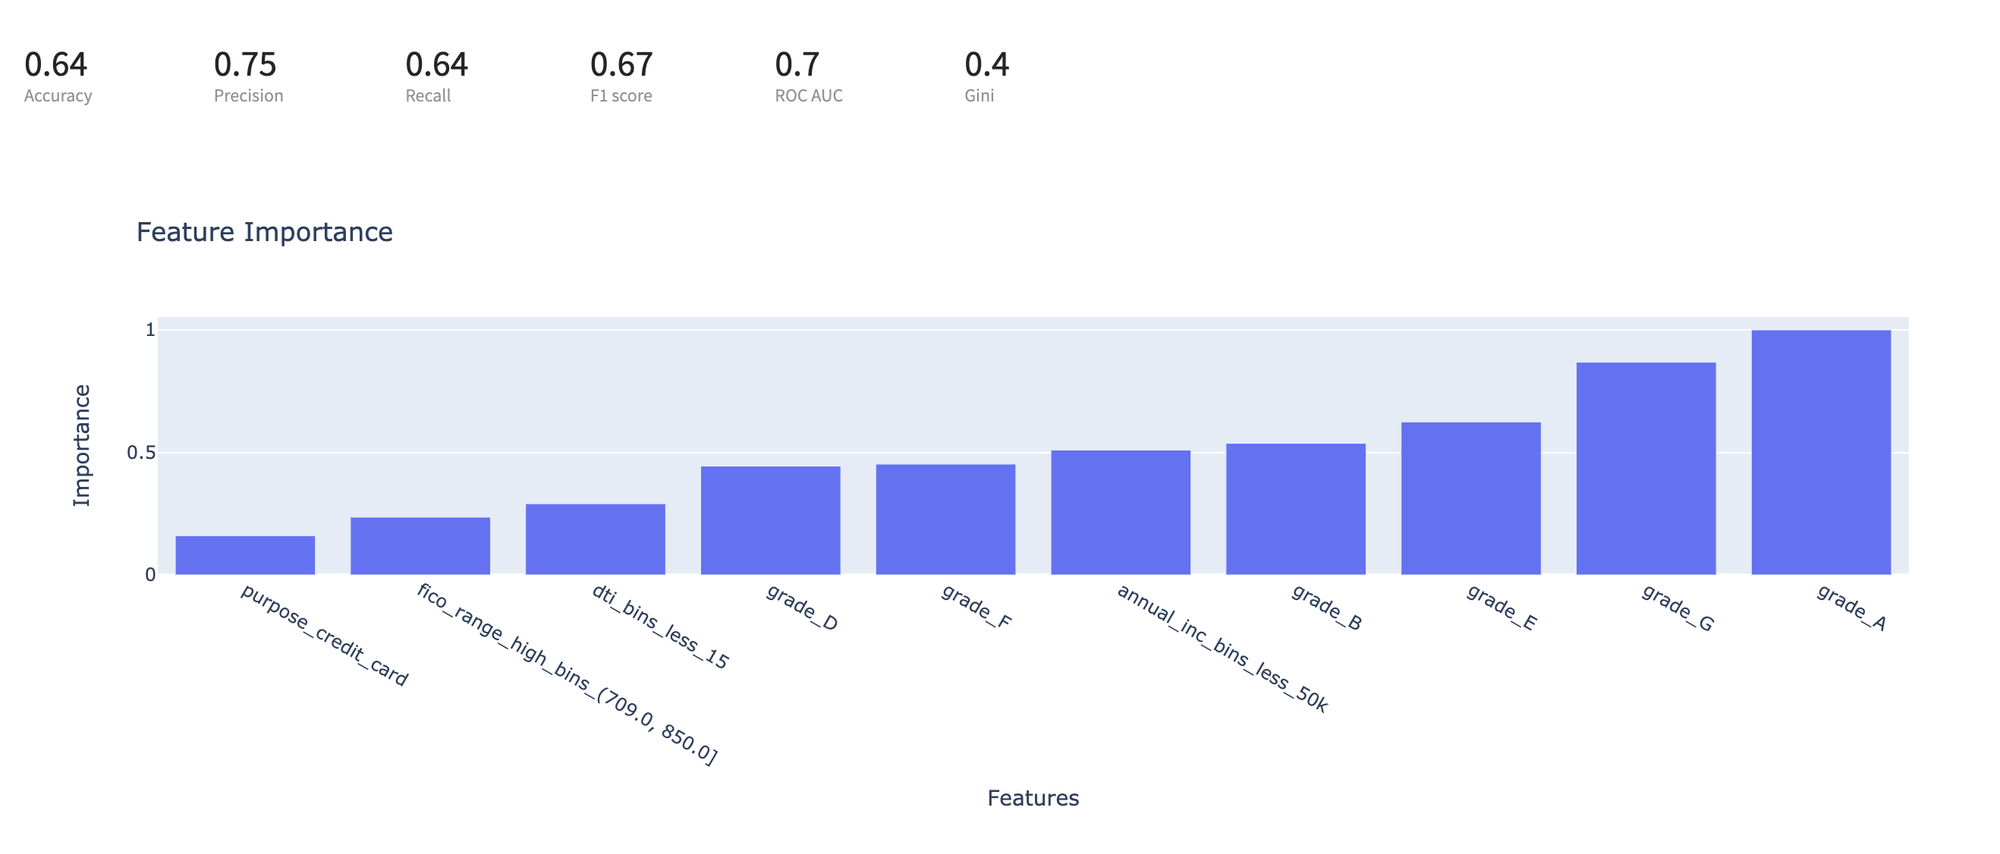
Model Perfomance
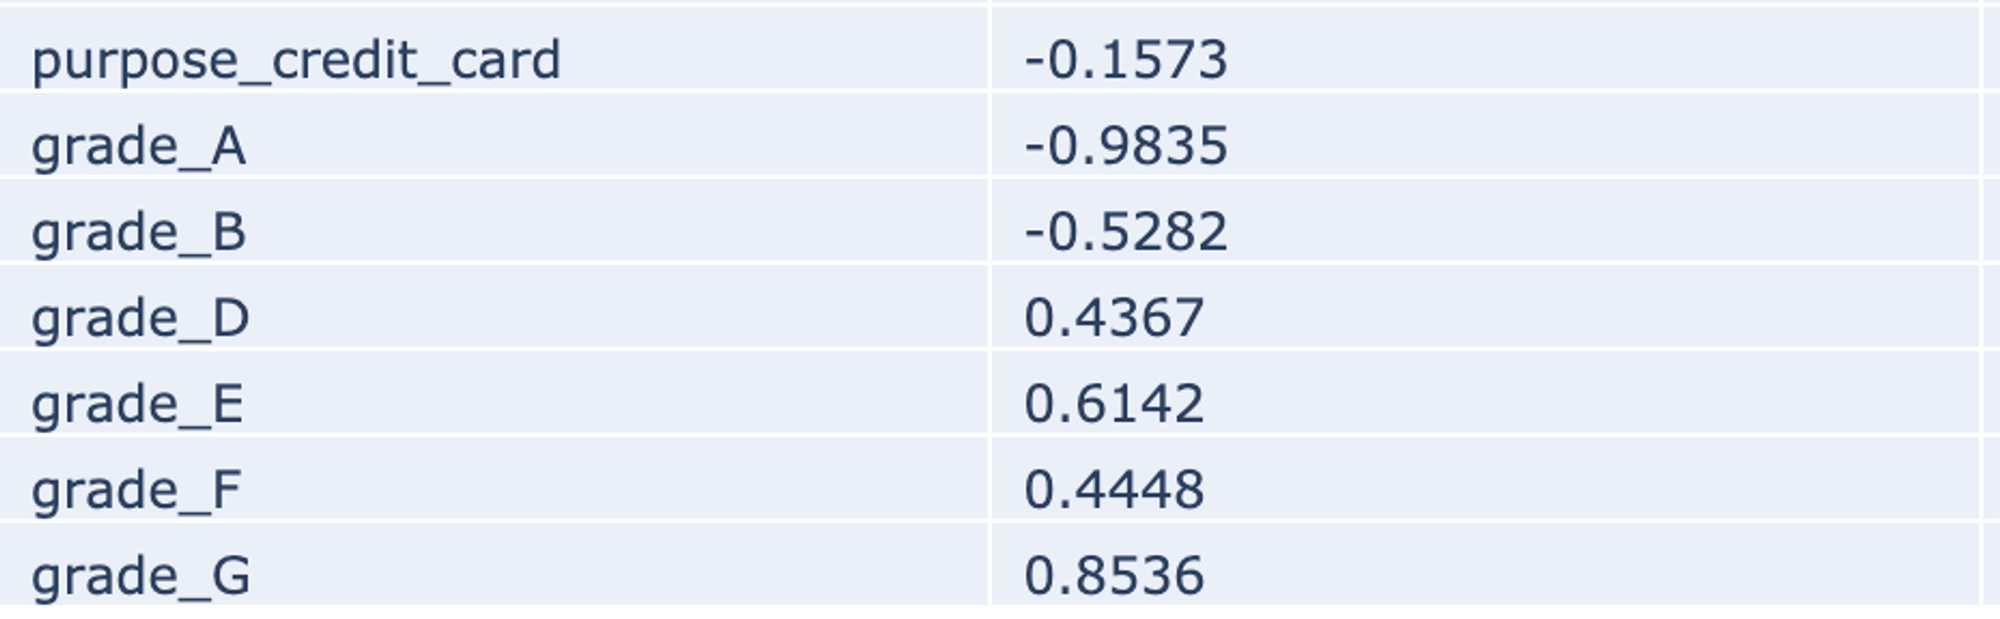
The trained model demonstrates good predictive abilities - Area Under Curve is equal to 0.7 with high Precision and sufficient Recall. The most important features are Grade, Annual Income, DTI rate, FICO rate, and Credit Purpose. Annual Income has a strong negative influence on the Rist Default - the higher Income, the less risk, and the credit purpose - credit card. The influence of the Assigned Grade has an expected behavior.
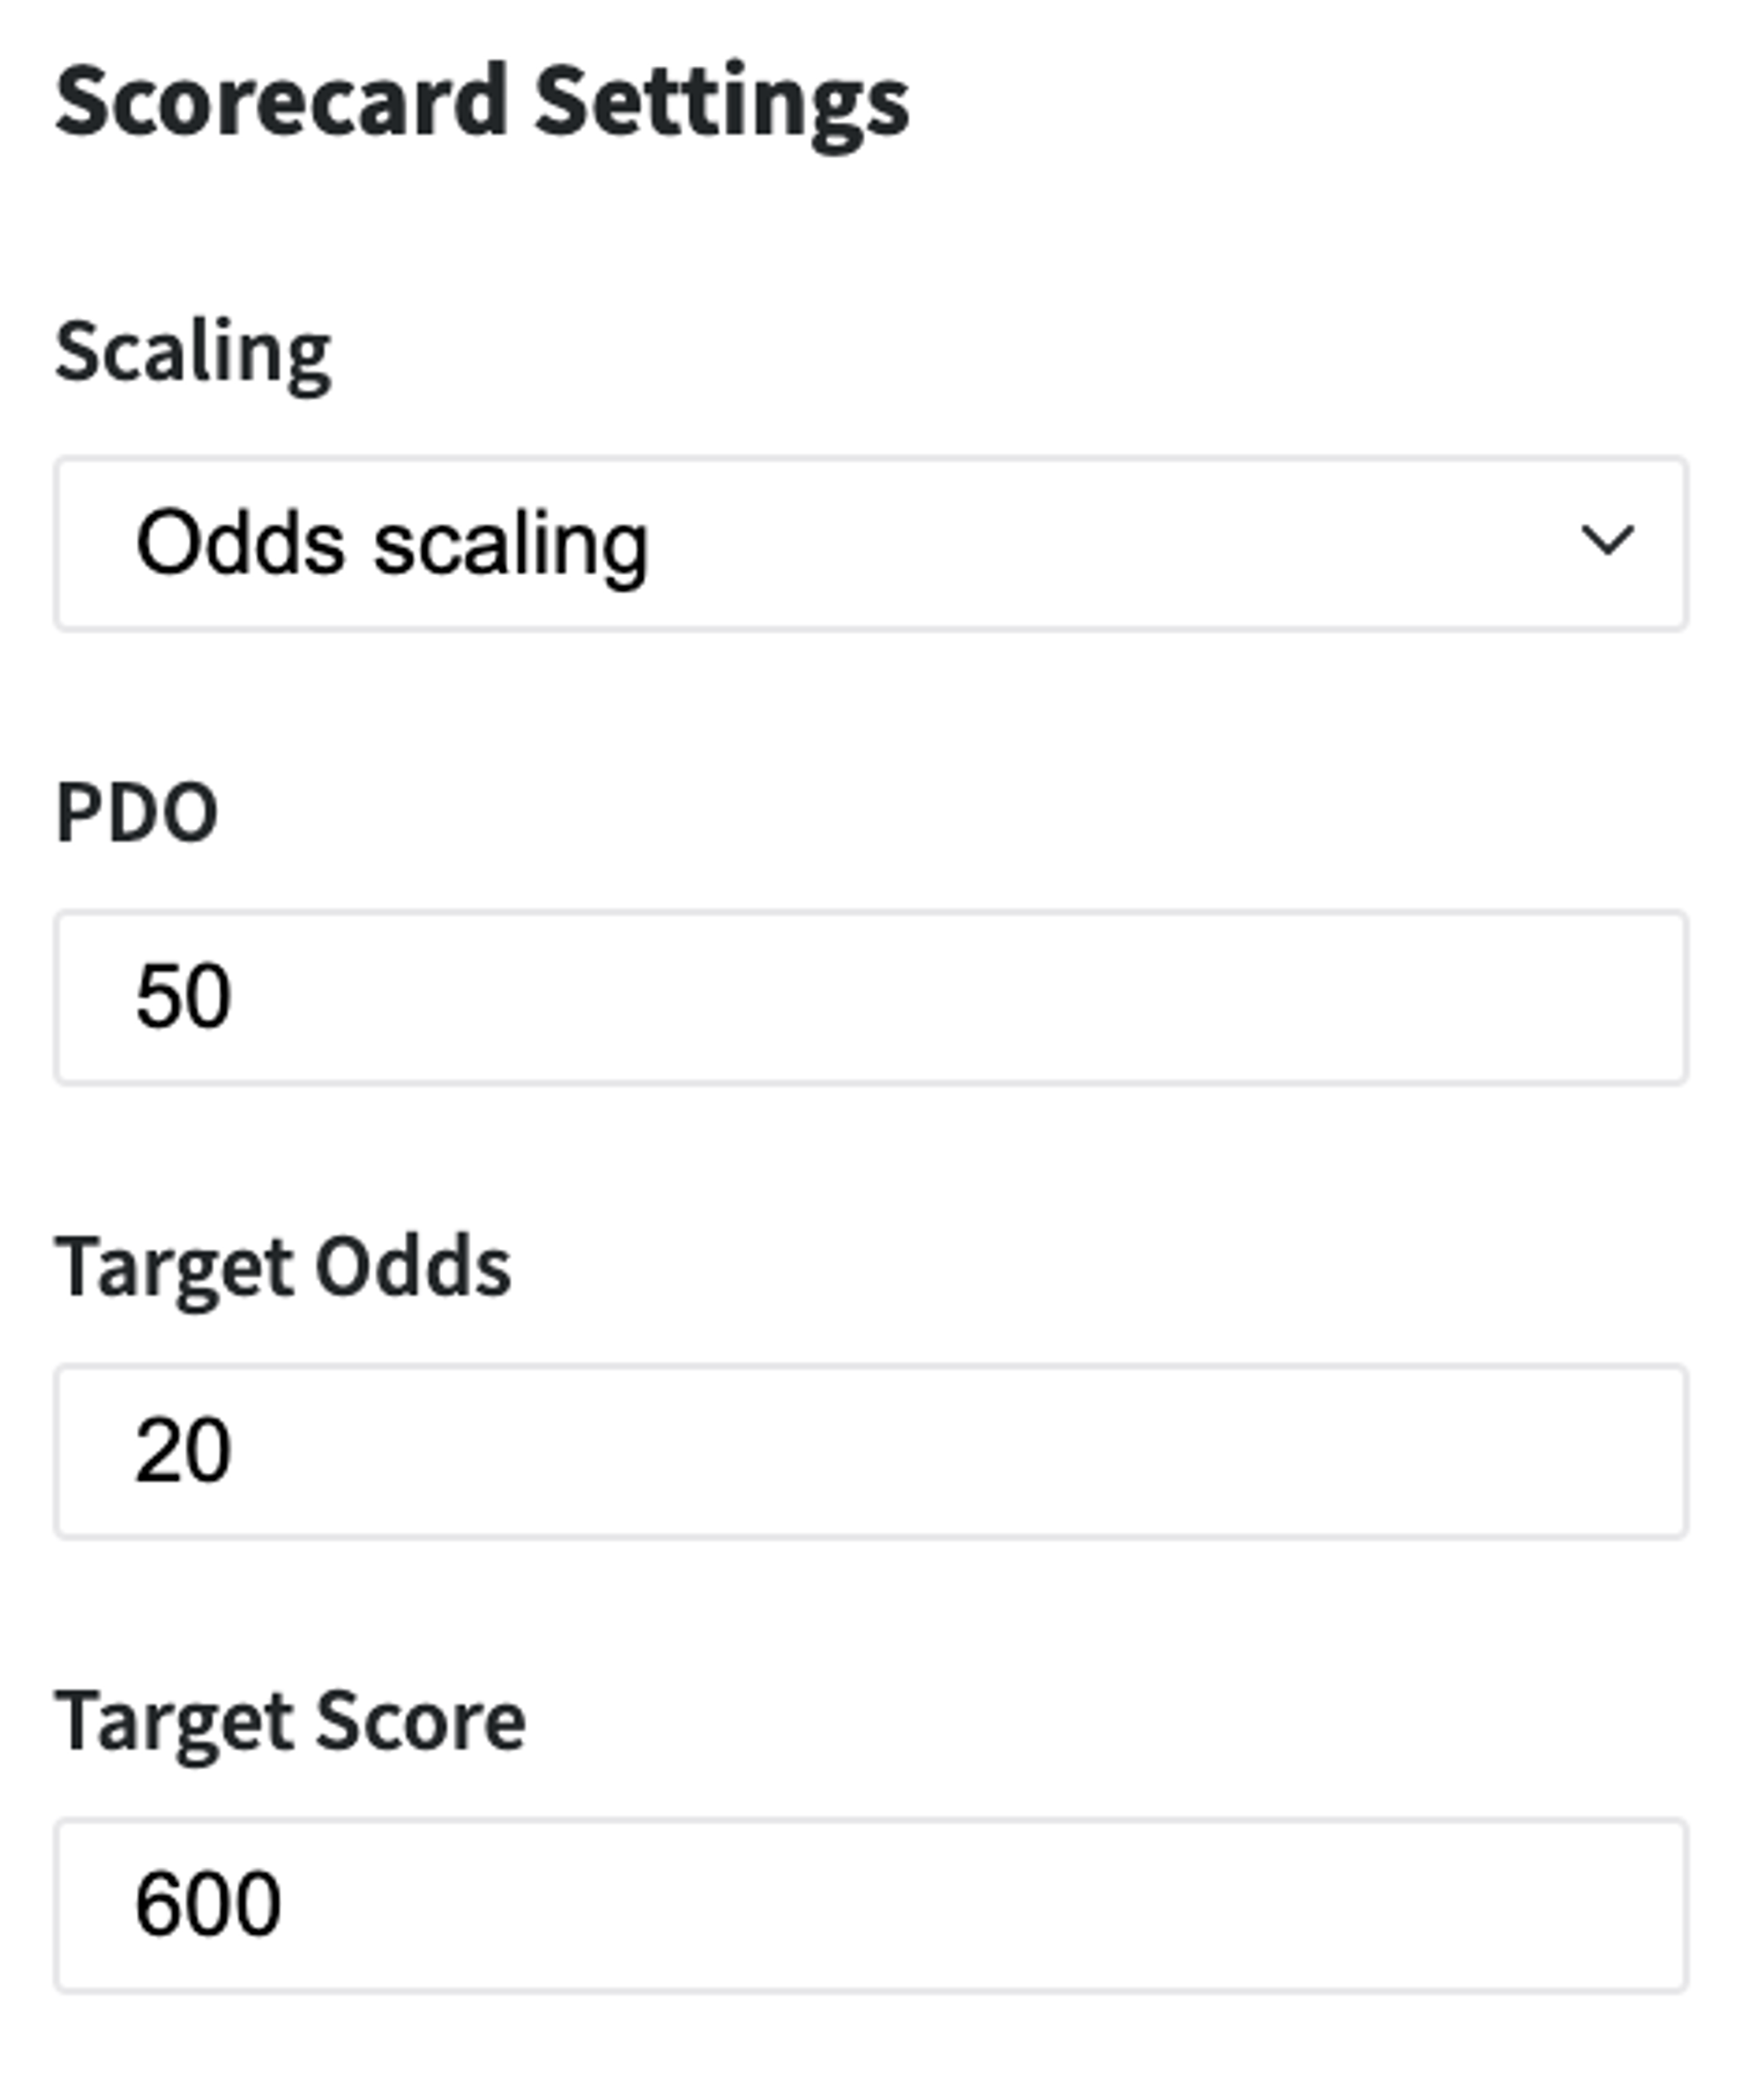
The trained model can be applied to the novel data - for the assessment of the Credit Default risk for the new Customers. Moreover, we may transform it to the Scorecards that provide a clear understanding of the different factors' contribution to the final Credit Score. In our case, we transformed the coefficients of the Logistic Regression to the factors' scores via Odds Scaling:
where, pdo - Points to Double the Odds, Target Score of 600 to mean a 20 to 1 odds (Target Odds) of good customer to bad, and an increase of 50 means a doubling odds
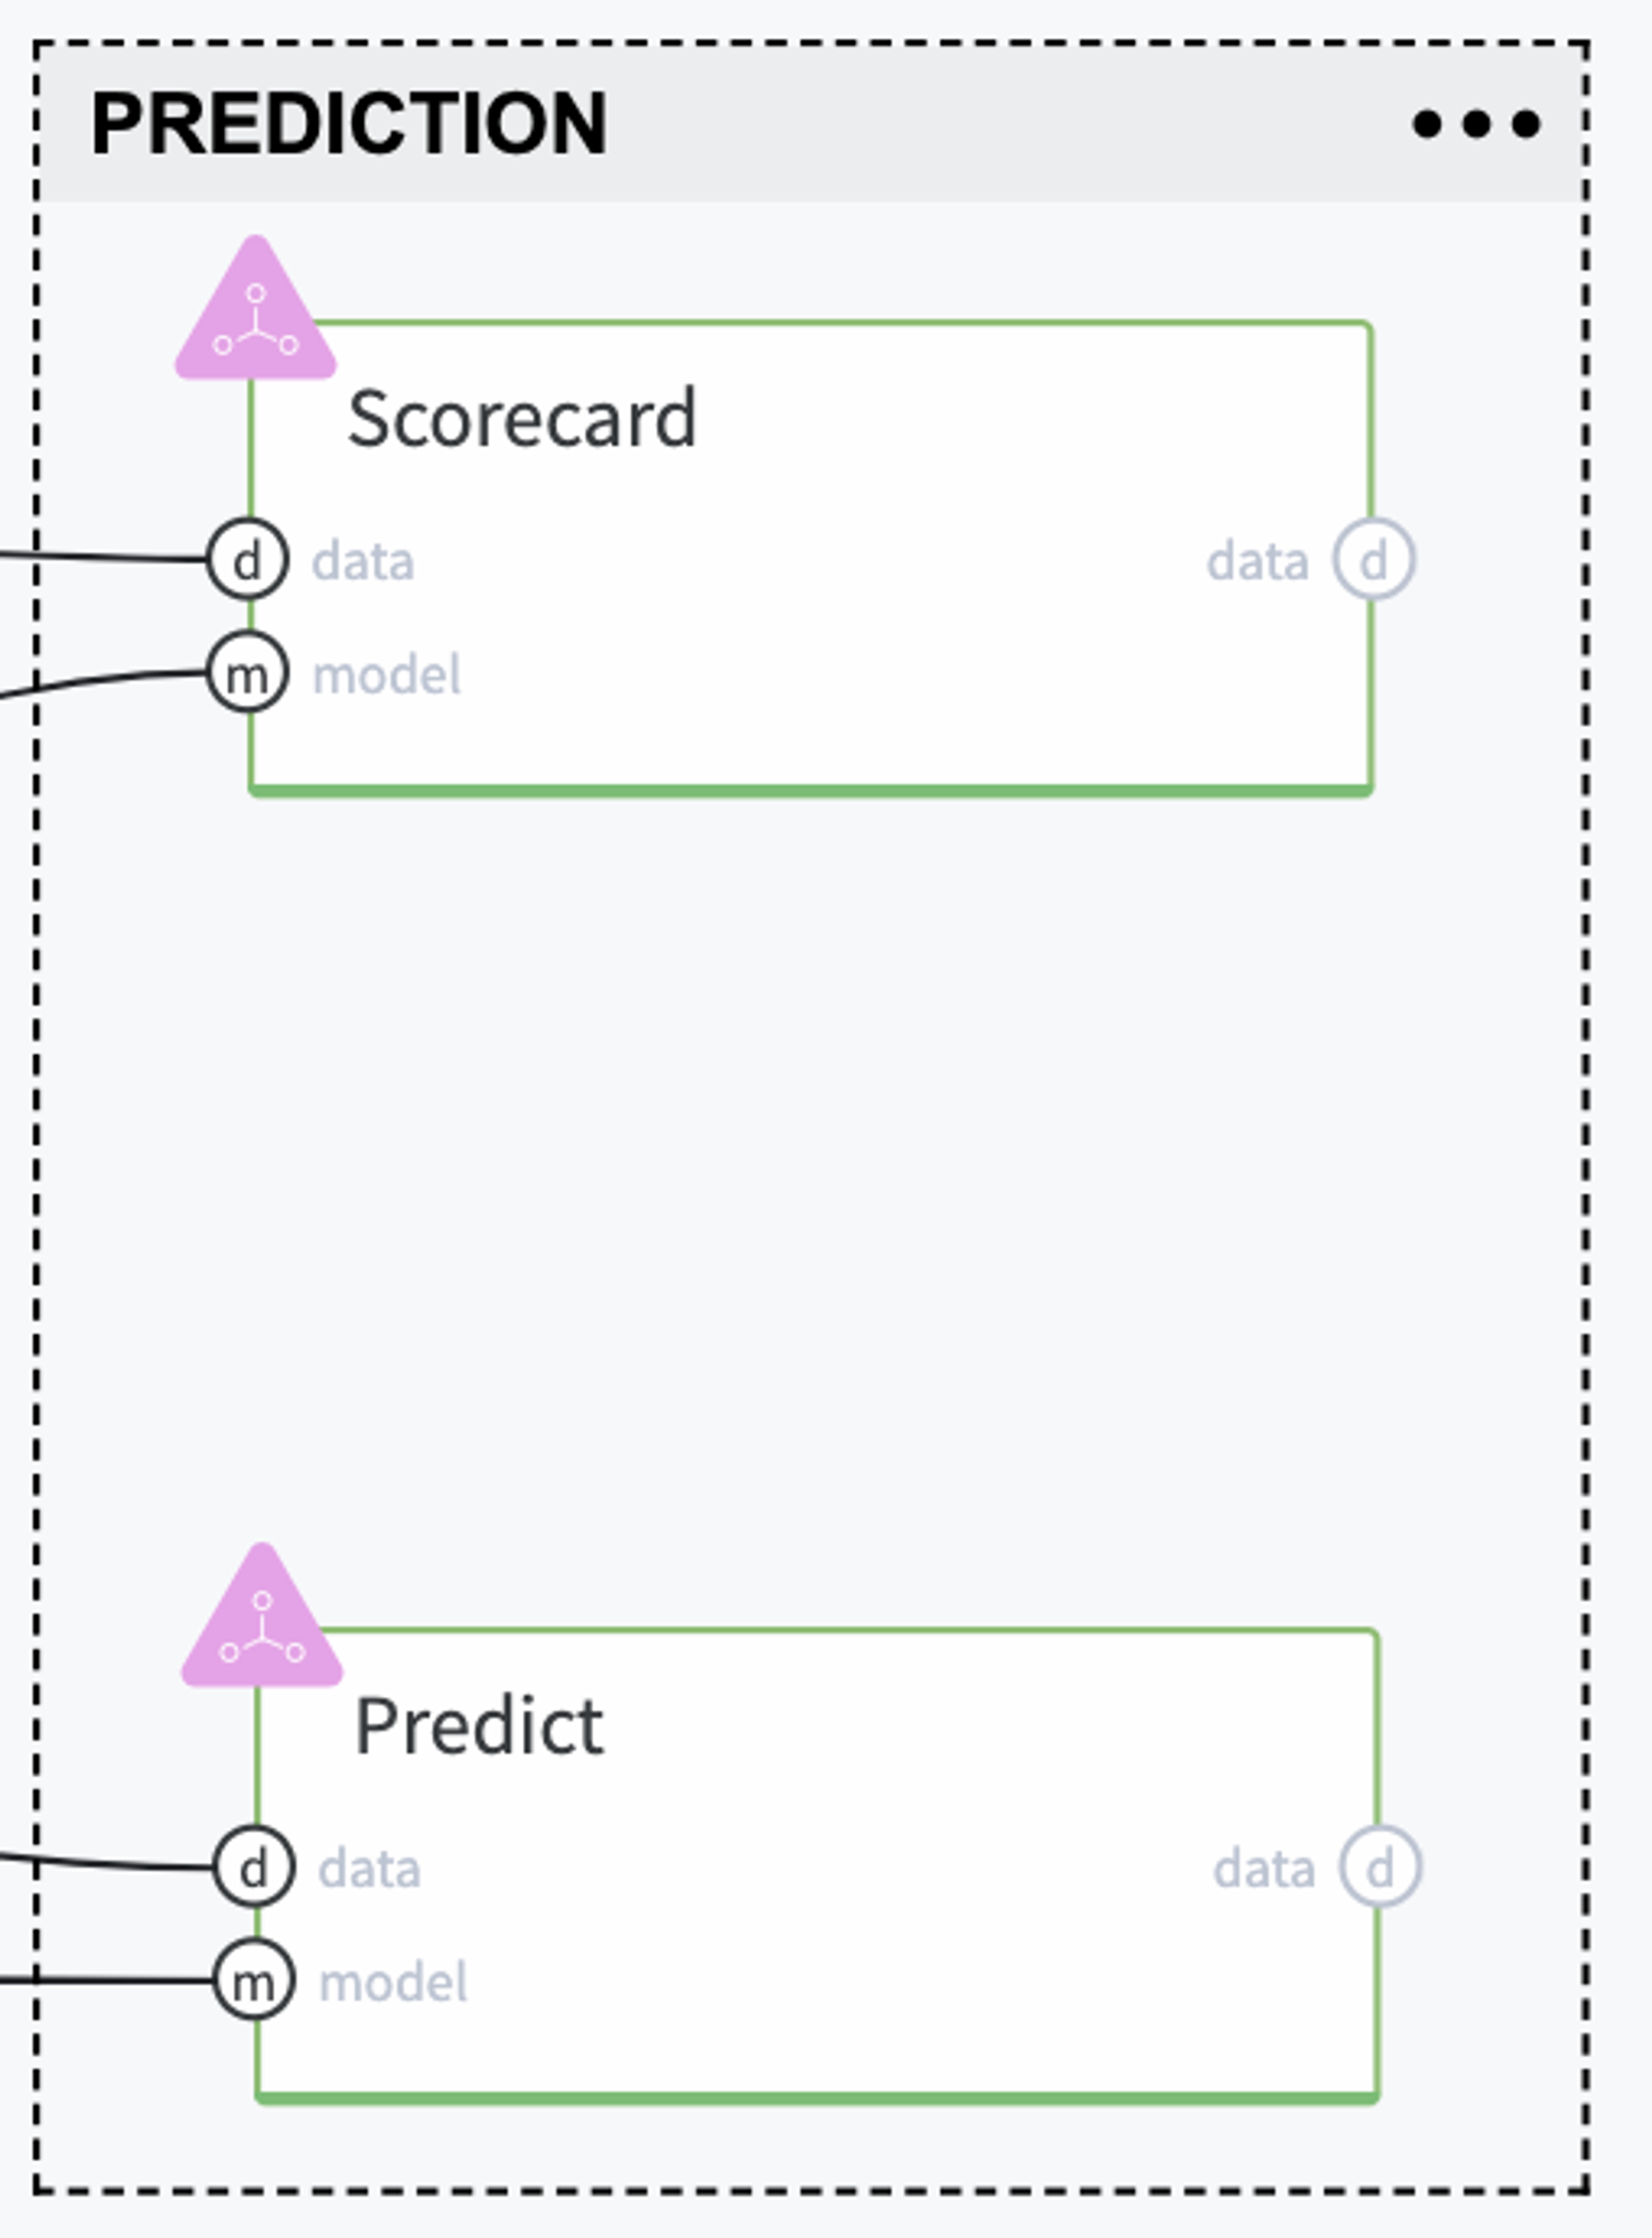
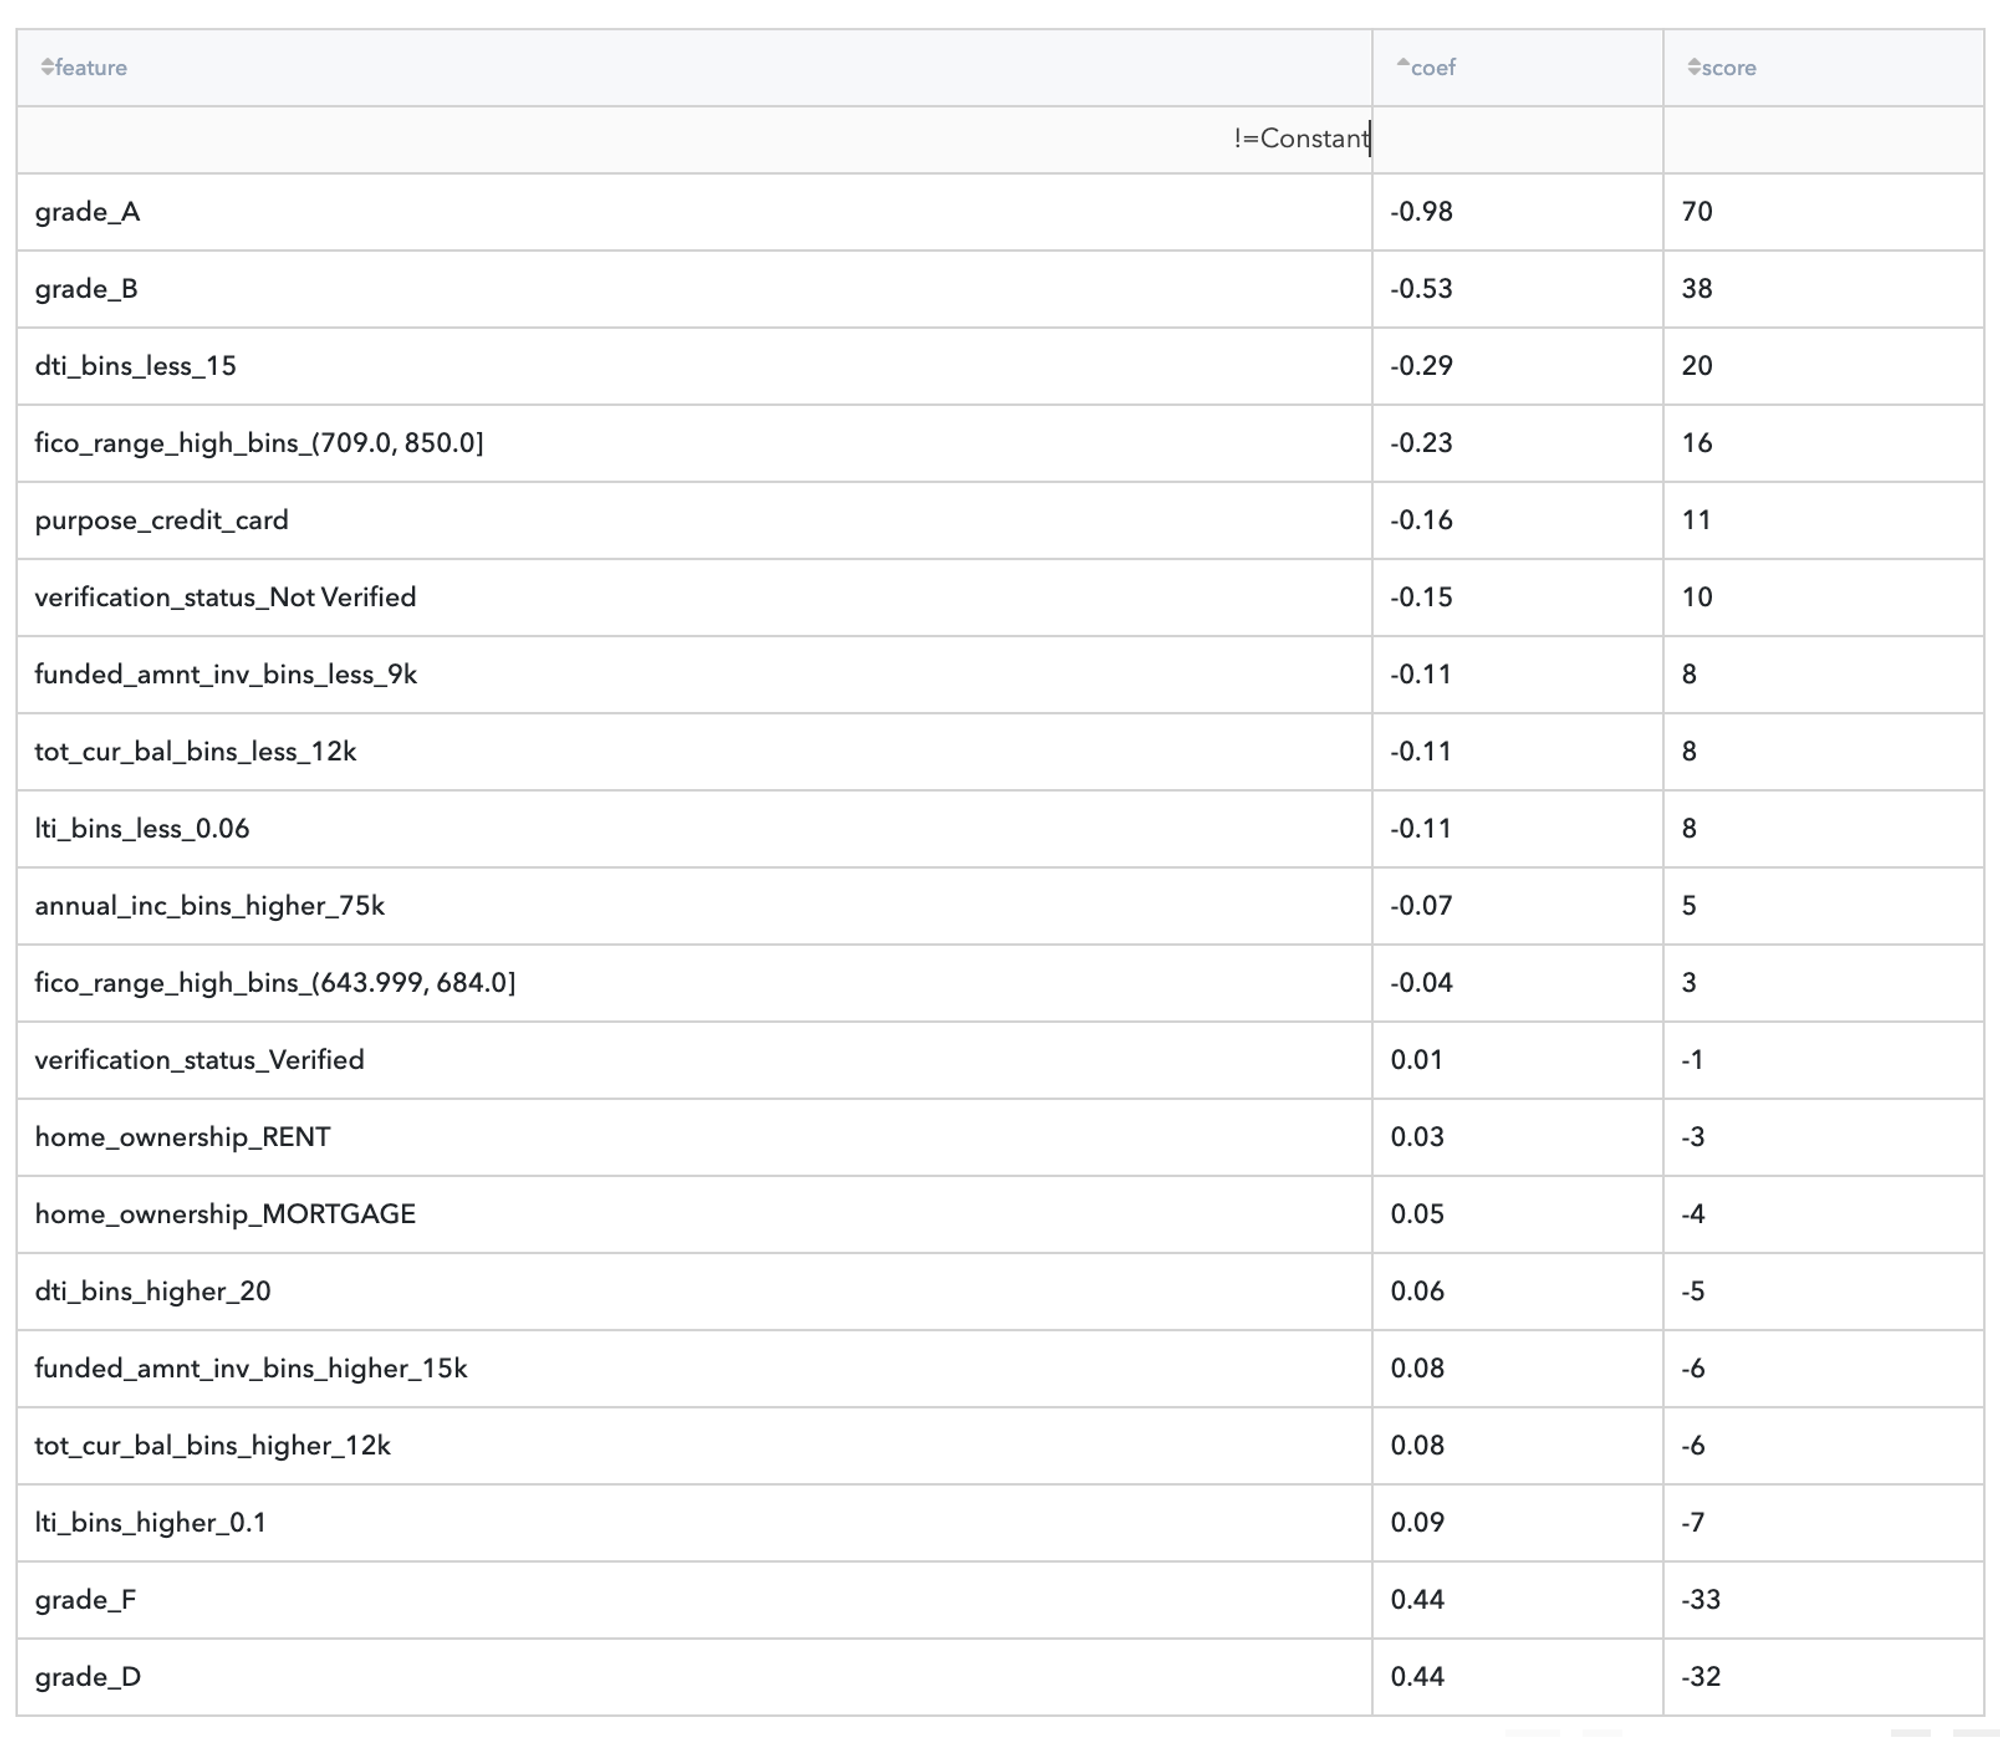
The final Scorecard looks like:
Scores are opposite to LogReg coefficients, because of the opposite purpose of the assessment - the LogReg model asses the Credit Default Risk, but the ScoreCard - the creditworthy.
Visualizations
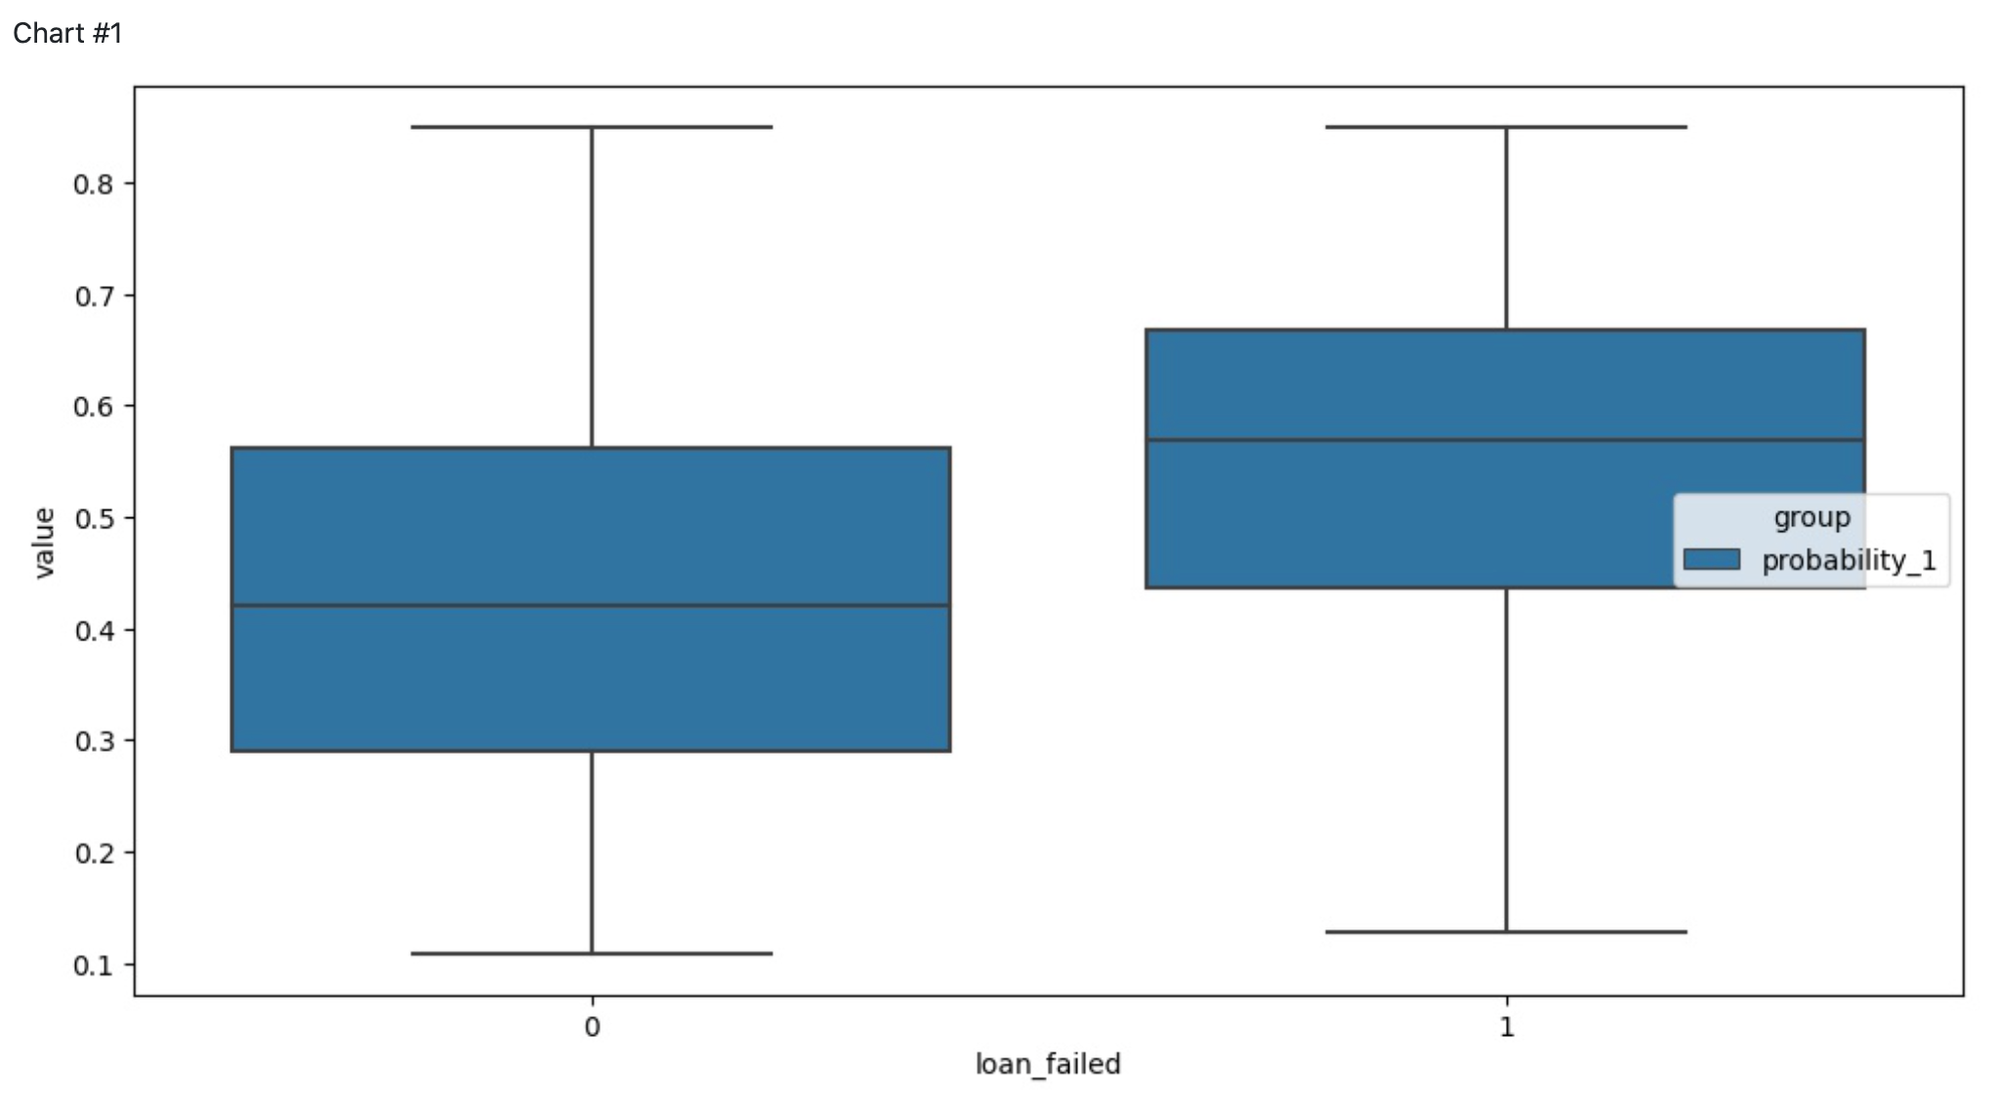
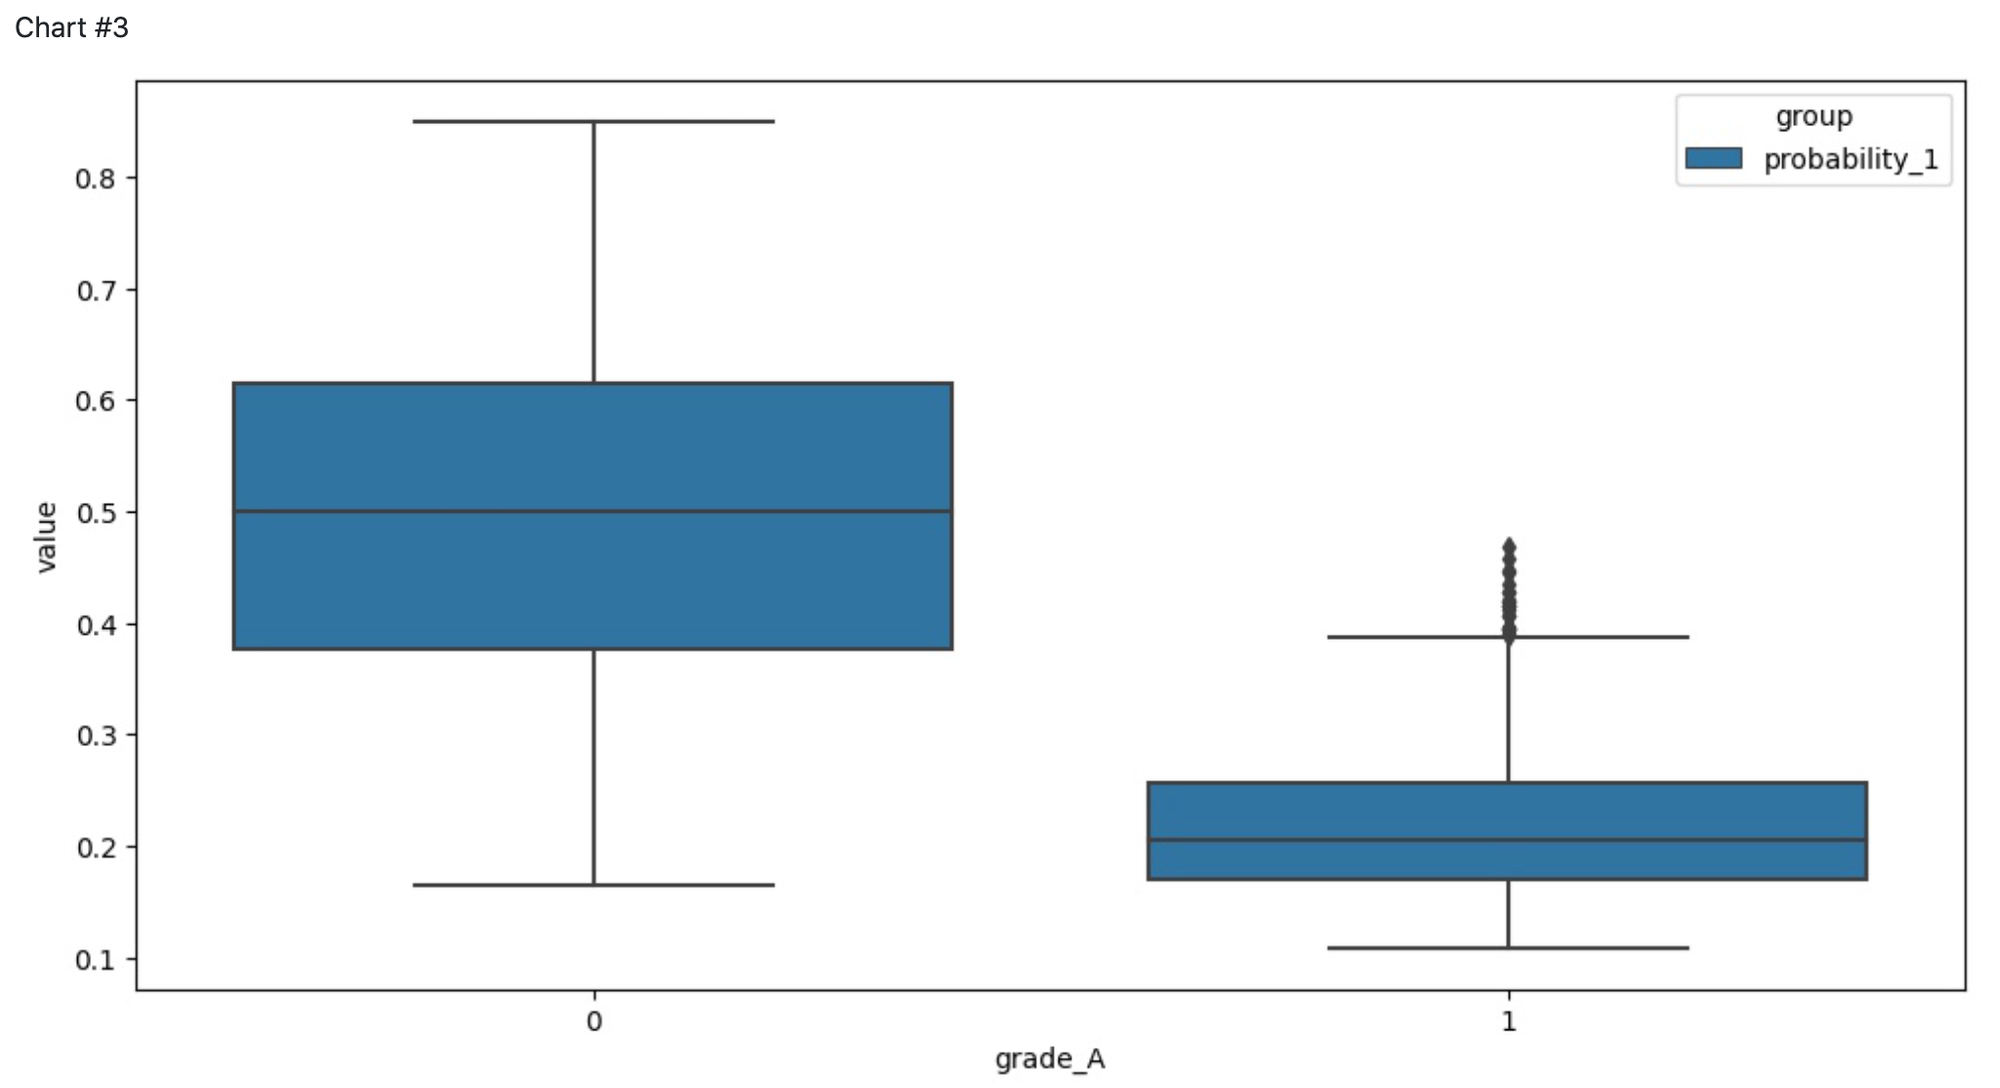
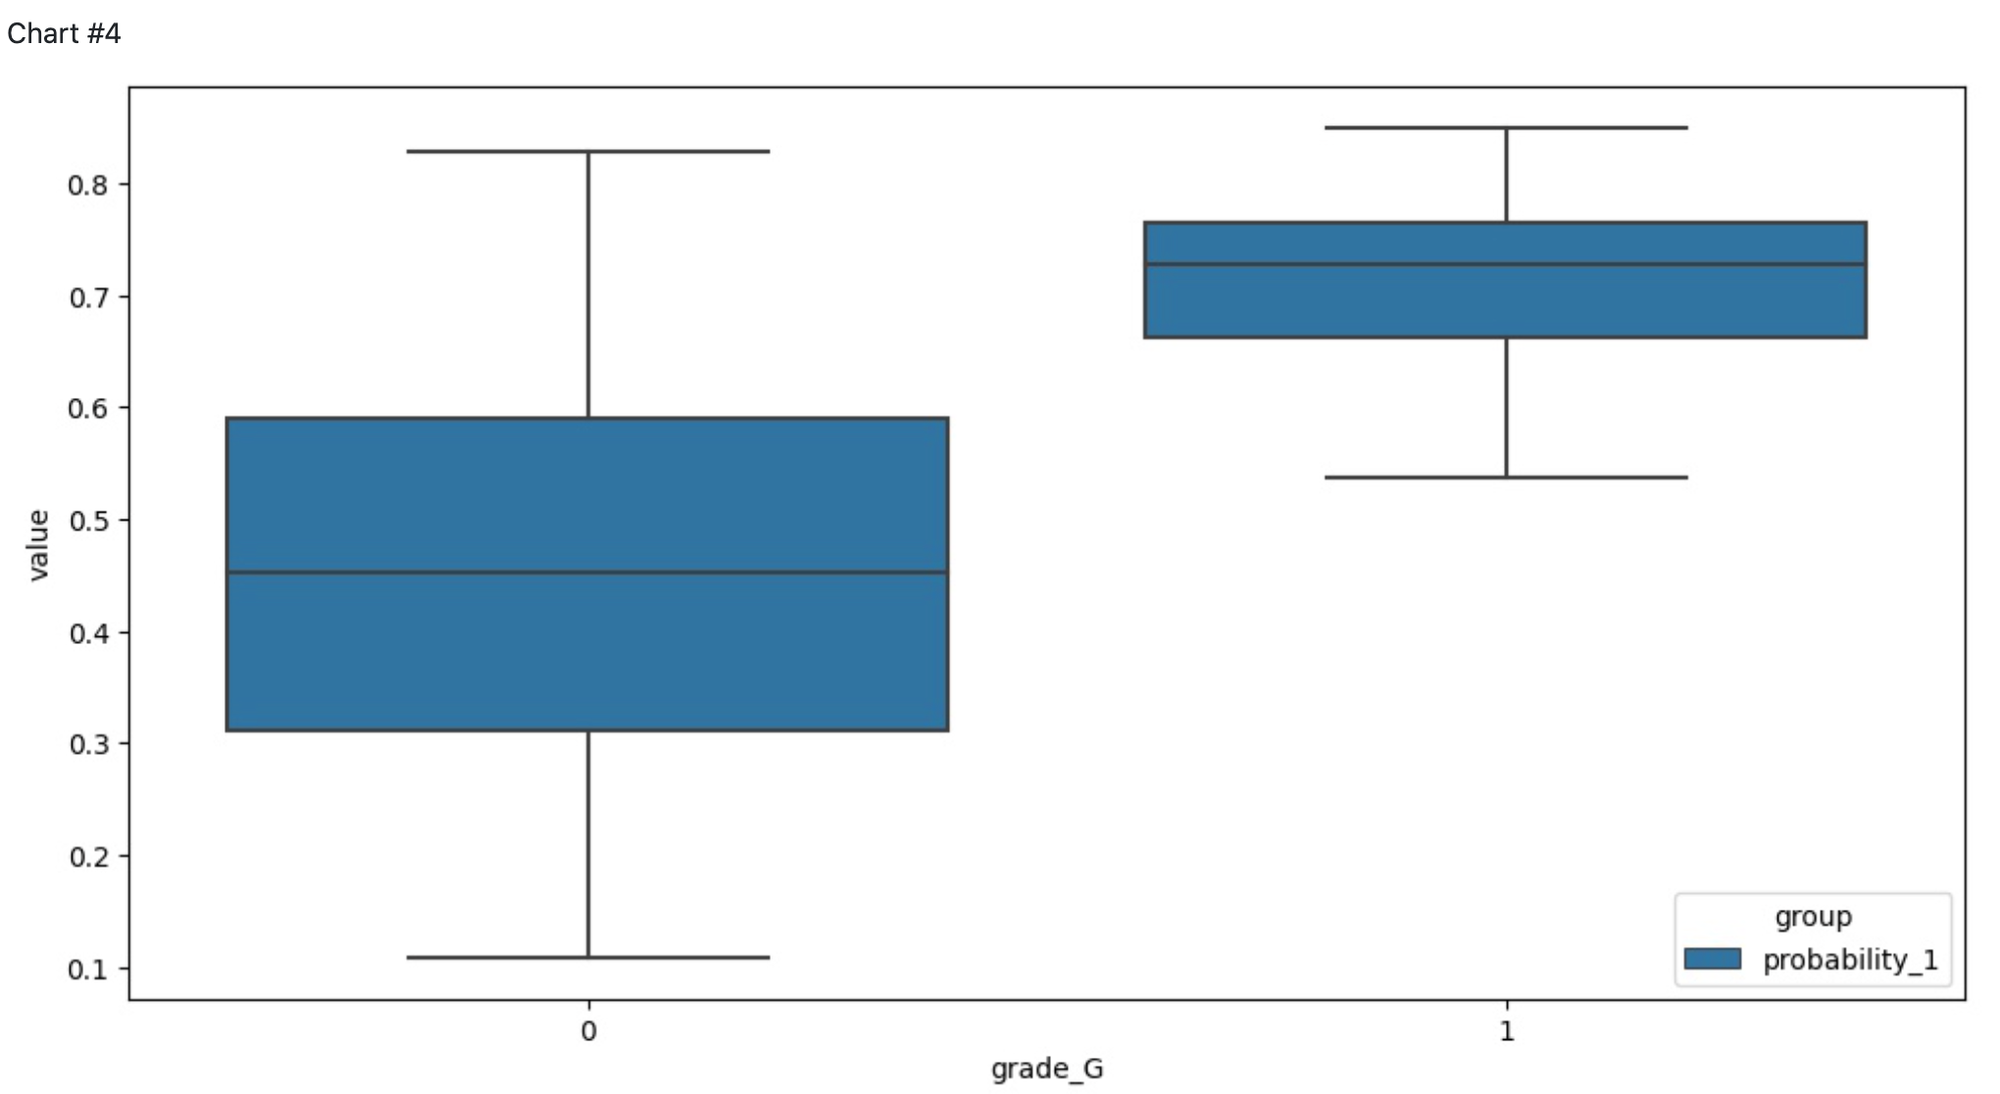
The pipeline contains Chart components for the visualizations of the different dependencies between predictors and target variable and the Risk Assessment model quality. The charts below represent the dependencies of the credit default probability from:
ground trues groups - we can see that the model is able to differentiate risk/not-at-risk groups
grage A / not grade A - the Customers who belong to Grade A group are very likely will be assessed as creditworthy clients
grage G / not grade G - the Customers who belong to Grade G group are very likely will get the low Credit Score